Although different evaluation issues have been described in many specialized reports (Barron, Reference Barron1997) the same degree of systematization and specialist literature is not available for already-validated specific instruments, or with respect to the analytic techniques to be used in evaluating satisfaction. Indeed, the specialist literature has not defined empirically and systematically the main theoretical dimensions to be taken into account when evaluating satisfaction in training programs. Furthermore, training evaluation models present general definitions of constructs that can be translated into different empirical definitions of their dimensions (Kirkpatrick, Reference Kirkpatrick1999).
In practice, differences in training program performance are normally analyzed by means of cross-group comparisons of participants’ satisfaction, for example, tests of group mean differences (Averns, Maraschiello, van Melle, & Day, Reference Averns, Maraschiello, van Melle and Day2009; Vanderberg & Lance, Reference Vanderberg and Lance2000). This type of analysis involves comparing levels of satisfaction among participants in different, specific aspects of the training process, such as content, trainers, objectives, methodology or utility (Kirkpatrick, Reference Kirkpatrick1999). Measurement instruments, such as rating scales, are frequently developed in order to evaluate satisfaction (Ybema, Smulders, & Bongers, Reference Ybema, Smulders and Bongers2010).
The design of measurement instruments is based mainly on the idiosyncrasy of the organization and the nature of the context. Moreover, the absence of validated theoretical models with empirical definitions of their substantive dimensions has resulted in a lack of well-defined measurement models. This means that it is difficult to study the construct validity of evidence obtained from existing rating scales, as their theoretical foundations or item inclusion criteria are not available (Gillespie, Denison, Haaland, Smerek, & Neale, Reference Gillespie, Denison, Haaland, Smerek and Neale2008).
Accordingly, and based on a theoretical measurement model of satisfaction, it is necessary to direct efforts toward the study of invariance when measuring satisfaction as part of training program evaluation. Doing so would provide a way of analyzing and operationalizing the substantive theoretical dimensions usually found in the literature (e.g. Kirkpatrick, Reference Kirkpatrick1999), as well as their possible generalization by recording data from samples or sub-samples of different populations (Díaz & Sánchez-López, Reference Díaz and Sánchez-López2004). This would reduce the probability of threats to validity such as the inadequate explication of constructs or their possible interactions with different organizational contexts (Shadish, Cook, & Campbell, Reference Shadish, Cook and Campbell2002; reviewed by Chacón & Shadish, Reference Chacón, Shadish, Anguera, Chacón and Blanco2008). An adequate explanation of the constructs involved entails integrating the adequacy, meaning and utility of the inferences derived from scores obtained on measurement instruments (Messick, Reference Messick1994). In this regard, the study of invariance measurement would support the correspondence between data and theory, help to increase theoretical coherence, and promote the usefulness of the scale in different contexts or situations (i.e. across organizations or training methods) (Vanderberg & Lance, Reference Vanderberg and Lance2000).
Another problem with the evaluation of satisfaction is that the measures used and their traditional forms of data analysis usually show low sensitivity in detecting differences between responses. Subjects tend to be assigned to the same assessment categories, despite being at different points on the assessment continuum, and this produces an important decrease in data variability. As a consequence, the results do not detect aspects that should be improved, unless these are particularly significant (Thayer, Reference Thayer and Goldstein1991).
However, analytic steps have been taken to avoid this lack of sensitivity when ordinal variables are used (Millsap & Tein, Reference Millsap and Tein2004). This enables a more appropriate study of construct validity with regard to one of its main aspects, the dimensionality of the instrument (Menjares, Michael, & Rueda, Reference Menjares, Michael and Rueda2000).
Given that ordinal scales have neither a point of origin nor a measurement unit it is meaningless, when analyzing subjects’ responses at the item level, to calculate the means or variance-covariance (Holgado, Chacón, Barbero, & Vila, Reference Holgado, Chacón, Barbero and Vila2010). In order to study the association between these variables the only useful information is the number of cases in each cell of a bivariate contingency table. If, in this case, Pearson correlations are used to analyze the degree of association between ordinal variables, the values obtained will be lower because Pearson correlations reduce the magnitude of the coefficients obtained among observed variables (since the categorization reduces variability). As a consequence, the factor loadings obtained when factoring the correlation matrix will also be reduced, as there is not only a random error but also a category error effect (DiStefano, Reference DiStefano2002). Problems of estimation may therefore arise (Guilley & Uhlig, Reference Guilley and Uhlig1993).
However, if the subjects were able to be situated along the latent continuum, without category restrictions, the scores obtained would be different (Flora, Finkel, & Foshee, Reference Flora, Finkel and Foshee2003; Jöreskog, Reference Jöreskog2001). In a Monte Carlo simulation study that examined the influence of the number of categories, the cell probabilities, the population correlation (ρ) and sample size, Jöreskog and Sörbom (Reference Jöreskog and Sörbom1996) found that polychoric correlations, a technique for estimating the correlation between two theorized normally distributed continuous latent variables from two observed ordinal variables (Holgado el al., 2010), were the most consistent and robust estimator. Use of the PRELIS and LISREL programs enabled data obtained from an ordinal scale to be analyzed by estimating a matrix of polychoric correlations developed from categorical data and computing the asymptotic variance-covariance matrix for the estimation (Jöreskog & Sörbom, Reference Jöreskog and Sörbom1996).
With the aim of providing useful solutions to these two criticisms (i.e. a lack of explicit measurement models of satisfaction scales that are directly related to empirical definitions of the dimensions included in the theoretical models, and the consequences of considering the effects of categorizing supposedly continuous variables), we present, based on a second-order factor satisfaction measurement model (Holgado, Chacón, Barbero, & Sanduvete, Reference Holgado, Chacón, Barbero and Sanduvete2006), an empirical measurement invariance study of participants’ satisfaction in different organizations and in different training methods (Vanderberg & Lance, Reference Vanderberg and Lance2000). Our approach takes into account both the factor structure of the measured construct and the ordinal nature of the recorded data. We then discuss the substantive consequences as regards the evaluation of training satisfaction.
In the context of invariance studies our general hypotheses are as follows: (I) the measurement model remains stable across different organizations and in different training methods; and (II) inadequate decisions can be made when conducting cross-group comparisons based on the observed scores obtained from item dimensions with different patterns of factor loading.
Specifically, we used the same Training Satisfaction Questionnaire (TSQ) (Holgado et al., Reference Holgado, Chacón, Barbero and Sanduvete2006) to collect data from three different public organizations: a provincial council (PC), a university training centre for administrative and service staff (UT), and a regional sports institute (RS). Two different training methods were being applied in these organizations: online (via internet) and traditional (method involving direct contact between trainers and participants). These were the natural conditions of the study, which did not imply the presence of a completely randomized factorial design (3x2).
Multi-group confirmatory factor analysis with polychoric correlations was used to examine whether the measurement model remained stable across the three different organizations and the two training method groups (Del Barrio, Carrasco, & Holgado, 2006; Vanderberg & Lance, Reference Vanderberg and Lance2000). Briefly, in this analysis the initial null hypothesis is that given different groups the variance-covariance matrix is equal across groups. Rejection of this hypothesis implies the non-equivalence of the groups, such that we then need to search for the source of non-invariance (Jöreskog, Reference Jöreskog1971). When looking for evidence of multi-group invariance, researchers seek to answer one of the following five questions (Byrne, Reference Byrne1998): (I) Do the items that form a particular measurement instrument operate equivalently across different populations? (II) Is the factorial structure of an instrument equivalent across populations? (III) Is a causal structure invariant across different groups? (IV) Are the latent means of a construct different across populations? (V) Is the factorial structure of a measurement instrument equivalent across independent samples of the same population?
In these analyses, categorical estimators may not be a viable alternative if the models have a large number of observable variables or sample sizes are small (Bollen, Reference Bollen1989a). Although, in theory, it is necessary to test the assumption of bivariate normality before calculating the polychoric correlation, this correlation is fairly robust with respect to such a violation (Coenders, Saris, & Satorra, Reference Coenders, Saris and Satorra1997). It is therefore necessary to find alternative indices for detecting the lack of invariance. Jöreskog (Reference Jöreskog2001) proposes using the root mean square error of approximation (RMSEA) as a fit index, as when its values are no greater than .1, parameter estimation is not significantly affected, even when the variables do not show bivariate normality. Chen, Sousa, and West (Reference Chen, Sousa and West2005), and Kim (Reference Kim2005) discuss the use of the RMSEA and the comparative fit index (CFI), where for the latter a value above .95 is considered to be indicative of a good fit. Garver and Mentzer (see Hoe, Reference Hoe2008) recommend using the non-normed fit index (NNFI), where a value higher than .9 is considered to indicate a good fit. Finally, MacCallum and Hong (see Kim, Reference Kim2005) propose the use of the goodness-of-fit index (GFI) and the adjusted goodness-of-fit index (AGFI), where values higher than .95 are indicative of a good fit in both indices.
When using Likert-type items and investigating the relationship between them by means of structural equation models the methods of estimation employed become particularly important (DiStefano, Reference DiStefano2002). The most popular among estimators based on normal distributions is the maximum likelihood (ML) method, as it finds consistent and asymptotically unbiased parameters (Bollen, Reference Bollen1989a).
However, if the variables are ordinal the relationships between them should be analyzed using polychoric correlations, along with the asymptotic variance-covariance matrix as a weighting element in the estimation. In this process the weighted least squares (WLS) method, a particular case of the generalized least squares (GLS) procedure, is recommended when sample size is large but there are not too many variables in the given model (at least 12; Jöreskog & Sörbom, Reference Jöreskog and Sörbom1996).
In this regard, previous studies found that WLS showed a small bias in estimating parameters and this bias was reduced as sample size increased (DiStefano, Reference DiStefano2002). Furthermore, when using WLS, GLS, unweighted least squares (ULS) and ML for polychoric correlations, it was shown that the factor loadings from WLS and ML were the closest; however, the standard errors for the estimated factor loading from WLS were the smallest (Bollen, Reference Bollen1989a). In conclusion, when using factor analysis to test a measurement model the scale used to measure the observable variables must be taken into account (Flora et al., Reference Flora, Finkel and Foshee2003; Jöreskog, Reference Jöreskog2001).
Specifically, three different hypotheses were tested in the invariance study (Byrne, Reference Byrne1998; Del Barrio et al., 2006):
-
a) The proposed second-order factor model is suitable across different organization and training method groups. The aim is to test whether the measurement and structural model is common to the different organization and training method groups.
-
b) The pattern of factor loading is invariant across these groups. Focusing on the measurement model the aim is to test the invariance pattern coefficients across organization and training method groups.
-
c) The structural model is equivalent in the defined groups. To test the invariance of the structural model we firstly focus on the relationship between the construct and the different factors across groups, and then on the construct itself.
Method
Participants
The sample was purposive and comprised a total of 5,272 responses obtained during the year 2007 in three different organizations: 1,968 subjects were drawn from staff of the PC, 1,630 from the UT and 1,674 from the RS. Participants were able to attend once only those training activities related to their work. Thus, each case of the sample represents another independent subject. The TSQs were filled in just after finishing the training activity. In order to obtain a large sample size we sought to guarantee anonymity and, therefore, no demographic variables were recorded.
The data were obtained from 70 training events in the PC (13 online and 57 traditional), 81 in the UT (4 online and 77 traditional) and 68 in the RS (22 online and 46 traditional). Each of these training events had various standard series. Overall, 1,099 respondents participated in an online course, while the other 4,173 received traditional training.
The average duration of training events was 23 hours, with a range of 3 to 300 hours. Their content was varied (for example, law, sport services, quality management, libraries and financial services), mainly because the professions and functions of participants were quite different (for example, police, psychologists, teachers, firemen, and gardeners).
In all three organizations professionals were trained in order to improve their skills and the quality of their work. Differences between them included the fact that the training program implemented in the RS was newer than those in the other two organizations, and also that the PC invested a large amount of resources in 2007 in order to improve its training program.
As regards the different training methods a clear advantage of the online method over the traditional one was that participants could organize their performance in a more flexible way. However, some aspects of the online method needed to be improved, mainly because this training method was relatively new; for example, further work was required in relation to how the trainers provided follow-up to participants, or in terms of adapting the training to participants without any knowledge of how to use computers.
Instruments
The steps to develop the TSQ were as follows (Holgado et al., Reference Holgado, Chacón, Barbero and Sanduvete2006):
Search for items
We reviewed available items from satisfaction questionnaires, mainly those used by different training organizations in Spain. This yielded 72 items, which were grouped into three dimensions: Objectives and content; Method and training context; and Usefulness and overall rating.
Content validity study
Expert judges (specifically, 20 training centre managers and trainers from different universities and private training firms) were used to carry out a content validity study. The judges evaluated each item with respect to its representativeness (the extent to which the specific item represents the dimension to which it is assigned) and utility (the extent to which the specific item is useful for measuring satisfaction with respect to the dimension to which it is assigned). Finally, each item was quantified through an index of congruence (Osterlind, Reference Osterlind1998). A total of 21 items presented indices higher than .6 on both aspects (representativeness and utility).
Pilot study
The psychometric properties of these 21 items were then studied after gathering data from 123 participants who attended UT training programs.
Final selection
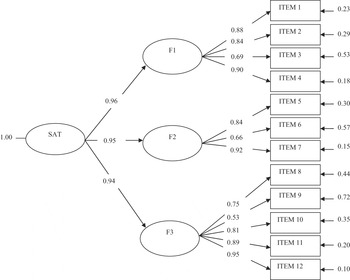
Of these 21 items we chose the 12 items with adequate psychometric properties (discrimination and item reliability from classical test theory) and the highest quantitative congruence indices. The resulting TSQ (Holgado et al., Reference Holgado, Chacón, Barbero and Sanduvete2006) comprised 12 items scored on a 5-point scale (1 = totally disagree, 5 = totally agree). The final second-order measurement model of the construct satisfaction (SAT) comprised three factors (see Fig. 1): Objectives and content (F1), measured by items 1–4; Method and training context (F2), measured by items 5–7; and Usefulness and overall rating (F3), measured by items 8–12. In the present study the structural model is defined by the relationships between latent dimensions (SAT, F1, F2 and F3). Specifically, two parameters define these relationships: gamma (γ), which refers to the relationships between the second-order factor (SAT) and the first-order factors (F1, F2 and F3), and phi (φ), representing the variance-covariance of SAT. The measurement model comprises the relationships between factors (F1-F3) and items (ITEM 1-ITEM 12), as defined by the parameter lambda (λ). The specific content of each item is shown in Table 2.
Second-order construct satisfaction measurement model obtained by Holgado et al. (Reference Holgado, Chacón, Barbero and Sanduvete2006).
Note: SAT: Satisfaction; F1: Objectives and content; F2: Method and training context; F3: Usefulness and overall rating.

Study of psychometric properties in the original sample (Holgado et al., Reference Holgado, Chacón, Barbero and Sanduvete2006)
The internal consistency, as measured by Cronbach’s alpha coefficient, was .888. The average discrimination index was .674. In accordance with the theoretical development of the scale, a second-order factor model was tested and provided evidence of construct validity.
Considering effect indicators instead of causal indicators
Based on the scale development process and our empirical evidence we consider items as effect indicators (Bollen & Bauldry, Reference Bollen and Bauldry2011) for the following reasons: (I) According to the previous content validity study (representativeness), any change in the latent variable should lead to changes in observed indicators. (II) Dropping a single indicator does not affect the relationships between the remaining indicators or their relationships with the latent variable. In this regard, one might consider effect indicators with roughly the same reliability and validity as being interchangeable or non-essential. (III) Effect indicators that are positively associated with a latent variable should all have positive correlations with one another. Here we have positive correlations among effect indicators that are positively associated with the latent variable, with no low or negative significant correlations. If we had found low or negative correlations among a set of indicators with positive relationships to the latent variable, then this would have been evidence of either poor effect indicators or causal indicators.
Procedure
The data obtained were stored in SPSS 15.0 files. The internal consistency using Cronbach’s alpha coefficient and the average discrimination index were calculated.
The matrix of polychoric correlations, using PRELIS (application included in LISREL 8.71), was estimated from different sub-samples (Flora et al., Reference Flora, Finkel and Foshee2003) because items were considered as categorized continuous variables from a normal multivariate distribution (Holgado et al., Reference Holgado, Chacón, Barbero and Vila2010).
To justify the use of the matrix of polychoric correlations it was necessary to test the assumption of bivariate normality, calculating the percentage of tests that rejected the null hypothesis of bivariate normality for each pair of correlations, assuming a nominal level of 5% and using the Bonferroni correction.
In addition, and following Jöreskog (Reference Jöreskog2001), the percentage of correlations whose RMSEA was less than .1 was reported.
The theoretical invariance model was tested using a multi-group confirmatory factor analysis (CFA) (Bollen, Reference Bollen1989b). As polychoric correlations were being used the recommended methods of estimation were WLS and robust WLS because, in large samples and with fewer than 20 indicators, these methods provide consistent estimators (Holgado et al., Reference Holgado, Chacón, Barbero and Vila2010; Jöreskog & Sörbom, Reference Jöreskog and Sörbom1996).
Before studying the structure of invariance across different groups it was necessary to study the model proposed in Holgado et al. (Reference Holgado, Chacón, Barbero and Sanduvete2006) in each subgroup using the program LISREL, specifying as free every parameter in the PC, UT, RS, traditional and online groups separately, and studying the fit between this proposed measurement and structural model and the data collected here.
Specifically, the proposed second-order factor model (with operationalized substantive dimensions) was obtained from a previous content validity study, and was tested and shown to be adequate.
Hypothesis I: testing the validity of the second-order factor model (baseline model)
All parameters of the structural and measurement model were estimated simultaneously, conducting multi-group analyses without invariance constraints being imposed. The aim of these analyses was to obtain evidence that the model was common across different organization and training method groups. Indirectly, we tested whether different reports obtained from these two types of group were equivalent.
Hypothesis II: testing for the invariant pattern of factor loading
The following analyses focused on the measurement model. Multi-group analyses were performed, imposing equality constraints on pattern coefficients of lambda (λ x ) in order to test the invariance of the measurement model of the groups (Brown, Reference Brown2006).
According to Ying and Fan (Reference Ying and Fan2003), increasing the constraints on a model leads to poorer model fit and, therefore, the different constraint models studied should be compared with a baseline model in order to assess the effect of these invariance constraints on the fit/misfit model. In this context other authors such as Cheung and Rensvold (Reference Cheung and Rensvold2002) have suggested, respectively, using the root deterioration per restriction (RDR) statistic and changes in the comparative fit index (CFI).
As a first step the pattern coefficients of all the factors were constrained to be invariant across organization and training method groups. Subsequently, the invariance of each factor was analyzed separately (maintained as equal across groups), before finally checking, again separately, the equivalence of item scores (maintaining equal across groups the parameter related to the specific item in question).
Hypothesis III: testing for invariance of the structural model
The following analyses focused on the structural second-factor model, the aim being to assess equivalent relationships between the theoretical constructs (Vanderberg & Lance, Reference Vanderberg and Lance2000).
Firstly, the comparison models were obtained, constraining all lambda parameters (λ) to be equal across groups (Byrne, Reference Byrne1998). All gamma parameters (γ) were then constrained to test the invariant structure across groups between the construct satisfaction and the three factors studied (Del Barrio et al., 2006). Finally, the factor phi (φ), related to the construct satisfaction was constrained to be equal across groups.
Results
Data Analysis
In the sample used in this study the internal consistency using Cronbach’s alpha coefficient was .917 and the average discrimination index was .691.
Assumption of Bivariate Normality
Bivariate normality was tested using the matrix of estimated polychoric correlations. As the TSQ comprised 12 items a total of 66 correlations (12 × 11/2) were obtained. Results for all of them showed that this assumption was rejected at the significance level of α = .05/66 = .00075 using the Bonferroni correction, which corresponds to a Χ² value of 38.52 with 15 degrees of freedom. Despite this, the RMSEA value was significantly lower than .1 in all cases. These results support the use of the matrix of polychoric correlations as the basis for the factor analyses.
The Proposed Model in Each Group
Fit indices presented in Table 1 show appropriate results in every group (the organizations PC, UT and RS; and the traditional and online training methods). However, the significance of Χ 2 shows discrepancies with respect to the other indices, probably because this index is influenced by sample size.
Fit indices in the different groups (a provincial council (PC), a university training centre for administrative and service staff (UT) and a regional sports institute (RS)) and for traditional and online methods

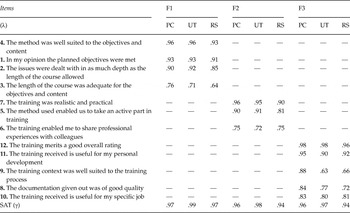
Standardized solutions for the three organization groups (a provincial council (PC), a university training centre for administrative and service staff (UT) and a regional sports institute (RS)

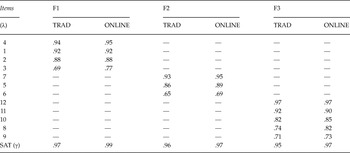
In sum, the model fit for the different groups is considered to be adequate, and the model can thus be regarded as providing a reasonable representation of the data from groups. The standardized solutions for groups referring to organizations (PC, UT and RS) are presented in Table 2 and the correlations between factors in Table 3. Similarly, standardized solutions for different training methods (traditional and online) are shown in Table 4, with the correlations between factors given in Table 5.
Correlations between factors for the three different organizations studied (a provincial council (PC), a university training centre for administrative and service staff (UT) and a regional sports institute (RS)

Standardized solutions for the two training method groups (Traditional (TRAD) and Online)

Correlations between factors for the two different training methods (Traditional (TRAD) and Online)

High correlations and standardized solution values provide further evidence of the model’s adequacy with respect to the data obtained from the different groups.
Hypothesis I: Testing the Validity of a Second-Order Factor Model (Baseline Model)
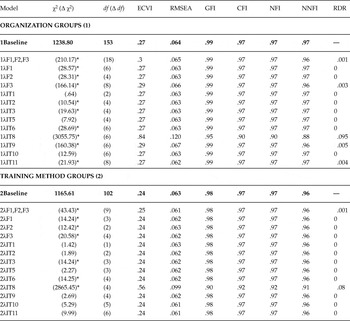
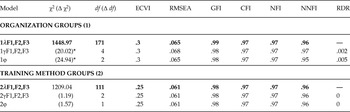
Table 6 shows the goodness-of-fit indices for the variables organization and training method separately (general baseline models 1 and 2, respectively). The values obtained support the existence of this common structure.
Invariance of factor loadings

Note:
* indicates significant increment in chi-squared (ρ<.05) compared to the baseline model.
Hypothesis II: Testing for an Invariant Pattern of Factor Loading
The results (see Table 6) support the hypothesis of invariant pattern coefficients. Although the increment in χ2 (Δχ2) compared to the baseline models was significant across both organization groups (comparing 1Baseline model with model 1λF1,F2,F3, where all the pattern coefficients of lambda (λx) were imposed as equal across organization groups) and training method groups (comparing 2Baseline model with model 2λF1,F2,F3, where all the pattern coefficients of lambda (λx) were imposed as equal across training method groups), the results for the other fit indices (ECVI, RMSEA, GFI, CFI, NFI, NNFI and RDR) were appropriate and enable us to assume equivalence across groups in the measurement model (Marsh, Reference Marsh1994). In all likelihood, the significance in Δχ2 on this occasion was also due to the large sample size.
To obtain more details and to ensure that the significant Δχ2 did not imply a lack of invariance, λx parameters were constrained as invariant in each factor across both organization groups (models 1λF1 meant that λx parameters were constrained in F1; 1λF2, constrained in F2; and 1λF3, constrained in F3) and training method groups (models 2λF1, 2λF2 and 2λF3). Except for the significant Δχ2, the indices presented acceptable values.
Finally, to obtain even more detail an equal λx was imposed on each item across groups. Non-significant Δχ2 were now found in models 1λIT1, 1λIT5 and 1λIT10 (where λx was imposed as equal on items 1, 5 and 10 across organization groups), and in 2λIT1, 2λIT2, 2λIT5, 2λIT9, 2λIT10 and 2λIT11 (where λx was imposed as equal on items 1, 2, 5, 9, 10 and 11 across training method groups).
Taking into account the acceptable values obtained for most of the models with the other fit indices (ECVI, RMSEA, GFI, CFI, NFI, NNFI and RDR) it can be concluded that the only measures which presented substantial differences across groups were those obtained in the item referring to the quality of the documentation given (IT8) across organization and training method groups, since models 1λIT8 and 2λIT8 revealed a non-fit in the results obtained, especially for ECVI, RMSEA, GFI, NNFI and RDR.
Hypothesis III: Testing for Invariance of the Structural Model
The comparison models for the organization and training method groups were, respectively, 1λF1,F2,F3 and 2λF1,F2,F3 (see Table 7).
Invariance of the structural model

Note:
* indicates significant increment in chi-squared (ρ<.05) compared to the baseline model.
As regards organization, goodness-of-fit indices (ECVI, RMSEA, GFI, CFI, NFI, NNFI and RDR) present acceptable values. Therefore, the invariance of the structural model across groups was confirmed, taking into account the influence of sample size on significant increases in χ2.
With respect to training method, the increase in the value of the χ2 test was not significant in the different models (2γF1,F2,F3 and 2φ). Given this result and the values of the descriptive fit indices (which coincide with those obtained in the comparison model 2λF1,F2,F3) the invariant hypothesis regarding the structural pattern coefficients cannot be rejected either.
Discussion
This invariance study in the area of training satisfaction evaluation sought to confirm that construct explication was adequate, and that the measurement model remained stable across different comparison groups. Furthermore, and due to the type of scale presented, polychoric correlations were used to analyze the relationship between the ordinal variables in this case. Both issues are crucial in a construct validation process.
Fit indices were used to determine whether the model adequately reproduced the relationships between variables, in this case in the substantive area of satisfaction evaluation in training programs. It should be noted, however, that we do not seek to justify an absolute solution, but rather present a possible model that is consistent with the data and with our theoretical framework. Indeed, our main concern was to provide a useful decision-making tool for practitioners to use when making comparisons based on satisfaction measures in the real world. In this regard, we report necessary information that is rarely available in published papers and in an ongoing substantive area of research. This information could, for instance, be used to make satisfaction comparison inferences, effect size estimations or measurement error corrections.
The preliminary analysis revealed that the underlying structure fitted the data across groups, thus confirming that the different organization and training method groups were equivalent.
In relation to general hypothesis I the results obtained across organization and training method groups provide empirical evidence of invariance in the measurement model. This is suggested by the optimal results obtained in the different descriptive fit indices used for the hierarchical confirmatory factor analysis models, despite the significant Χ 2 tests usually found due to sample size.
More specifically, the three hypotheses of the invariance study which involved increasingly restrictive models were confirmed: (I) the previously-tested second-order factor model is suitable across different organization and training method groups; (II) the pattern of factor loading is invariant across these different groups; and (III) the structural model is equivalent across the defined groups. The study of covariance matrix invariance is important to ensure that the lower-order factor errors are equivalent across the groups (Chen et al., Reference Chen, Sousa and West2005).
These results support the usefulness of the TSQ for measuring satisfaction in different organizations and in relation to different training methods.
As regards general hypothesis II, in both organization and training method groups the parameter related to item 8 (The documentation given out was of good quality) was not the same for different groups. Nevertheless, the scores obtained in different organizations and training methods may be comparable, except for those obtained on item 8. This finding supports the need to carry out an invariance study before conducting single-measure comparisons. Organizational decisions about the quality of documentation should not be made on the basis of the observed scores on item 8.
In this specific case, differences in scores across groups could be due to real differences across organization and training method groups, as previously described in the Participants section. As regards differences across organization groups, the PC invested the largest amount of resources to improve the quality of training documentation. With respect to differences across training method groups, one possible explanation of the differences in satisfaction was that the online method was relatively new, so the corresponding documents may have undergone less correction and revision than in the traditional method.
At all events, further research is required, and in order to analyze the possible interaction between the aspect measured and the groups, we plan to perform a bias study via differential item functioning to test whether the same level of the studied concept entails differences in item 8 (Welkenhuysen-Gybels, Reference Welkenhuysen-Gybels2004).
We would therefore like to invite any interested readers who are able and willing to measure satisfaction with training programs to collaborate with this project.