


1. Introduction
Snow avalanches represent a major natural hazard which threatens mountainous areas throughout the world. Destruction of woodlands, communication lines and inhabited areas by avalanches often results in considerable human and economic losses (e.g. Reference Fuchs, Keiler, Zischg and BrundlFuchs and others, 2005). High-risk zones are generally well identified, as avalanches usually follow the same paths year after year; however, massive avalanches related to exceptional weather conditions sometimes extend beyond their normal paths or even break new ones. Such events, which may encompass kilometer-wide areas and millions of tons of snow, are rare but particularly devastating.
In Europe, the last extreme avalanche winter was 1998/99. In February 1999, exceptional avalanches affected the northern Alps, mostly in France (e.g. Reference Marco, Karr and SkolautMarco and Karr, 2009), Switzerland (e.g. Reference Rhyner and SkolautRhyner, 2009) and Austria (e.g. Reference Patek and SkolautPatek, 2009). On 9 February a dramatic avalanche swept away 14 chalets and killed 12 people in the hamlet of Montroc, Mont Blanc region, France. Twelve days later, 9 people were engulfed in Evolene, Switzerland. In Austria, 38 fatalities occurred from 24 to 25 February in the ski domains of Galtür and Valzur. Globally, the exceptional avalanches of 1999 made this one of the deadliest winters of the last century, together with those of 1951 (235 victims in Switzerland and Austria), 1954 (143 victims in Austria), 1968 (38 victims in Switzerland) and 1970 (96 victims in France and Switzerland).
The fatal events of 1999 raised several questions for the public about the reliability of the avalanche-risk forecast and the mitigation policies adopted by the local authorities. As a consequence, since 1999 there has been an increasing effort in snow research in Europe (Reference SalmSalm, 2004; Reference SchweizerSchweizer, 2008). Considerable progress has been made in avalanche hazard estimation, particularly through mapping of high-risk zones (e.g. Reference Cappabianca, Barbolini and NataleCappabianca and others, 2008) and numerical modeling (Reference Durand, Giraud, Brun, Mérindol and MartinDurand and others, 1999; Reference Bartelt and LehningBartelt and Lehning, 2002; Christen and others, 2010). Some knowledge of low-frequency events has also been gained (Reference McClungMcClung, 2001; Reference Föhn, Stoffel, Bartelt and StevensFöhn and others, 2002;Reference JomelliJomelli and others, 2007; Reference HöllerHöller, 2009). However, existing avalanche-hazard models hardly describe the snowpack variability at a scale characteristic of the avalanche path, because of limited computational resources and sparse observational data (Reference Durand, Giraud, Brun, Mérindol and MartinDurand and others, 1999; Reference SchweizerSchweizer and others, 2008a, Reference Schweizer, Heilig, Bellaire and Fierzb). In addition, exceptional avalanche situations are still poorly documented in terms of return periods, length of avalanche run-out and triggering factors. These limitations complicate the task for local forecasters of predicting the magnitude of exceptional snowpack instability and providing the authorities with a precise location of the most threatening areas. Thus, improvement of avalanche-hazard assessment remains an essential prerequisite to develop adapted mitigation policies.
In this context, Météo-France undertook an investigation of the snow and weather factors involved in large fresh-snow avalanches as well as an evaluation of the operational avalanche hazard forecasted in such cases. With this aim, the latest versions of SAFRAN/Crocus/MÉPRA (SCM) numerical models (Reference Durand, Giraud, Brun, Mérindol and MartinDurand and others, 1999) were run on the extreme avalanche cycles observed in February 1999 in the Chamonix region and a new-snow instability index was built. This numerical study is presented in this paper, as follows. First, a general description of snow and weather conditions in winter 1999 is provided. Simulated avalanche hazards are subsequently validated and their sensitivity to various weather and snow factors is investigated. Finally, several improvements to the avalanche-hazard forecasting procedure that operated in France are proposed.
2. Study Site and Observations
The Mont Blanc massif is located in the northern French Alps and covers ~400 km2 (Fig. 1). This massif, which is oriented mainly from southeast to northwest, is the highest in the Alps, reaching 4810 m a.s.l. at the Mont Blanc summit. It is bordered by high-altitude mountain ranges, except on its northwestern and southeastern sides, where the French massifs of Chablais and Aravis and the Italian Piedmont do not exceed 2750 m a.s.l. (Fig. 1). Owing to these geographical features, the Mont Blanc massif is strongly exposed to westerly to northwesterly atmospheric flows. These flows are frequent in winter and often produce intense precipitation over the northern Alps. The massif climatology indicates that, within the massif, the valley of Chamonix, lying between 760 and 1100m a.s.l., tends to receive more winter precipitation than the southern region of Megeve and Les Contamines (locations in Fig. 1b). As a result of these climatological characteristics and a topography marked by numerous steep flanks overhanging infrastructures and inhabited areas (Fig. 1b), the massif is swept regularly in winter by destructive avalanches.
Location of the Mont Blanc massif in the northern French Alps. (a) Map of the northern French Alpine massifs and mean fresh-snow accumulation analyzed at 1800ma.s.1. from 26 January 1999 to 23 February 1999. (b) Map of the Mont Blanc massif showing the area topography, the Mont Blanc summit (▄) and the 1999 snow and weather network. Temperature, precipitation and wind were recorded at automatic (*) and manual (•) weather stations. Snow depth measurements (°) and snow pits ( ) were performed in the ski area. The blue curves correspond to avalanche paths observed in 1998/99 (Jamard and others, 2002). The black box shows the area selected for the sensitivity study.

Throughout the 1998/99 winter season, weather and snow observations were collected by Météo-France’s observation network at various locations in the Mont Blanc massif (Fig. 1b). Hourly records of precipitation, temperature and wind velocity were available from automatic weather stations. Additional precipitation, temperature and snow depth measurements were taken twice a day, at 0800 h and 1300 h local time. Weekly snow pits, dug in the ski resort area, provided information on snowpack temperature and stratigraphy (grain size and types). In parallel, the French Institute of Agricultural and Environmental Engineering Research (Cemagref) estimated the avalanche activity from avalanche path observations at given sites (Fig. 1b). Finally, the avalanche hazard was diagnosed daily at the massif scale by the local forecasters of Météo-France, based on the five- level European scale of avalanche hazard. This information and a bulletin describing the snow conditions were provided to the local authorities in charge of the risk management for avalanche paths.
3. Snow and Weather Conditions in Winter 1998/99
We present the main characteristics of snow and weather conditions of winter 1998/99 in the Mont Blanc massif, based on synoptic and local observations, a summary report of Météo-France (Reference VillecroseVillecrose, 1999) and meteorological fields analyzed by the SCM chain (Reference Durand, Giraud, Brun, Mérindol and MartinDurand and others, 1999).
3.1. Early winter conditions
The first snowfalls at low altitudes in mid-November marked the beginning of winter in the Mont Blanc massif. Largely negative air temperatures, corresponding to a 0°C surface isotherm that was generally below 1200 ma.s.l., were recorded until 13 December (Fig. 2). Over this period, sparse precipitations resulted in snow depths slightly lower than seasonal means, particularly below 1500 m a.s.l. and on southern exposures (Reference VillecroseVillecrose, 1999). Such conditions of cold and thin snowpack often favor strong temperature gradients within the snowpack and thus the growth of faceted crystals of weak mechanical cohesion (e.g. Reference HöllerHöller, 2009).
Meteorological conditions in the Mont Blanc massif during the 1998/99 winter, with the altitude of the 08C surface isotherm (curve) and the daily precipitation at 1800ma.s.l. (bars) analyzed by SAFRAN, as well as records of daily precipitation (dots) at the Chamonix observation station (1035ma.s.l.; see Fig. 1b).

During the first 3 weeks of January, successive northwesterly meteorological storms resulted in snowfalls often accompanied or followed by strong winds. The resulting snowpack was very sensitive to accidental overloading, leading to 15 people being victims of accidental avalanches in the northern French Alps from 16 to 17 January (Reference VillecroseVillecrose, 1999). The week from 20 to 26 January corresponds to a period of clear skies and mild weather, with the altitude of the 0°C surface isotherm showing marked daily fluctuations of maximums ~2000m a.s.l. (Fig. 2). These conditions favored partial snowpack stabilization, especially in the southern exposures. This period was followed by the first significant precipitation of the winter, from 27 to 30 January, with a mean accumulation of 1.2 m of cold snow at 1800 m a.s.l. and intensities reaching 0.7 m d-1 at Le Tour. Several avalanches were observed, but these caused limited damage, probably because snow depths were low below 2200 m a.s.l. (Reference VillecroseVillecrose, 1999). From 29 January to 5 February, the weather was sunny, windy and cold, with a 0°C surface isotherm barely climbing above 0m a.s.l. (Fig. 2).
Figure 3 shows a snow pit dug at Megeve station on 2 February on a northwestern flank at 2000 m a.s.l., a location characteristic of the departure zone of the avalanches observed later in February. This snow pit displays a hard base of partially refrozen depth hoar overlaid by layers of loose faceted crystals and fine grains of low volumetric weight 0.3-0.7 m above the ground. Such weak layers of faceted crystals are representative of the thin snowpack and cold conditions of the beginning of winter, as mentioned above. The fine grains are characteristic of the recent snowfall at the end of January, which had probably gained, at least at the beginning of the episode, a sintering cohesion due to the effect of the wind. The Megeve snow pit also shows a typical slab structure with the lower part of the fine grain layer, of hardness 3, overlying the weakest snow, of hardness 2 (Fig. 3). Other snow pits made throughout the winter (not shown) display similar qualitative features. The snow-cover stability at the end of January was nevertheless difficult to assess, as no stability tests were carried out.
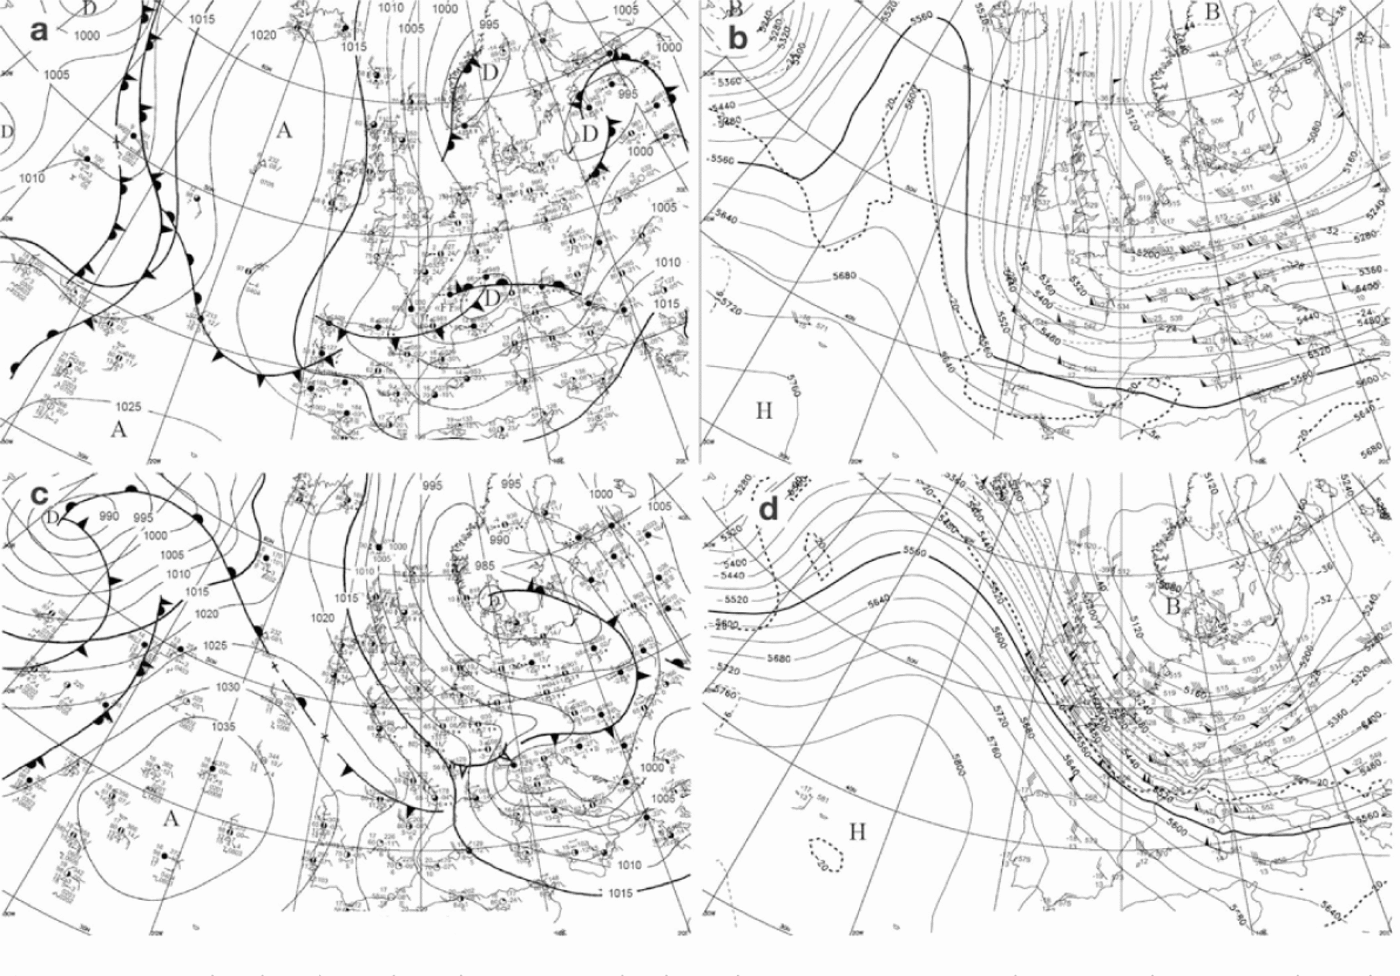
Snow pit dug at 2000ma.s.l. on a northwestern exposure at the Mege`ve station on 2 February 1999. Plot of height as a function of ram resistance and temperature, and observations from the pit (table) according to the international classification for seasonal snow on the ground (Reference FierzFierz and others, 2009).

3.2. Synoptic situation in February 1999
In February 1999, synoptic atmospheric conditions typical of winter prevailed, with a front of low pressure extending from Scandinavia to Eastern Europe and an area of high pressure centered on the Azores (Fig. 4). However, the Azores anticyclone stretched to unusually high latitudes, up to the Atlantic coast of Spain, yielding particularly large pressure gradients over northern Europe (Fig. 4a and c). As a result, fast altitude streams conveyed cold and wet air from the Arctic regions to the northern Alps (Fig. 4b and d). The frontal activity of these streams displayed a rapid circulation of storms in a general westerly/northwesterly flow (Fig. 4a and c), which were strengthened locally over the Alps by topographical effects, particularly on 9 February (Fig. 4a). Such active northwesterly-oriented frontal zones are often associated with intense precipitation and major avalanche release in the northern Alps (Holler, 2009). In February 1999, they produced exceptional snow accumulations in the northern French Alpine massifs, with up to 5.6 m of snowfall at 1800 ma.s.l. from 26 January to 25 February in the Mont Blanc massif and northern Haute-Tarentaise, twice as much as in the southern massifs of Oisans and Grandes Rousses (Fig. 1a).
Synoptic weather charts from (a,b) 9 February 1999 and (c,d) 22 February 1999 at 1200 UTC, showing (a,c) the pressure in hPa at the mean sea level and (b,d) the geopotential heights (solid curve, in ma.s.l.) and temperature (dashed curve, in 8C) at the 500 hPa isobar.
3.3. February 1999 in the Mont Blanc massif
In February 1999, contrasting snow and weather conditions were recorded in the Mont Blanc massif according to exposures and altitudes. From 6 to 11 February, massive snowfalls and low air temperatures were measured at low altitudes, with 1.4 m of fresh-snow accumulation in the center of Chamonix (1050 m a.s.l.), a once in 40 years event. Observations of snow blowing on the summits, from the west, were reported on 7 February at Le Tour station (location in Fig. 1b). A short lull occurred on 8 February, but no significant snowpack humidification was observed. At high altitudes, fresh and light snow was transported by winds of moderate velocity, forming large accumulations during these 6days (Reference VillecroseVillecrose, 1999).
The meteorological conditions of early February resulted in a highly unstable snowpac at all altitudes, so that on 6 February the local meteorological center posted a first alert of maximum avalanche danger, according to the standard five-level European avalanche-hazard scale. This alert was maintained until 10 February (Fig. 5). During this period, 26 major avalanches were reported (Fig. 5), some of them showing unusual paths and 17 reaching the bottom of the Chamonix valley. Among them, on the afternoon of 9 February, the avalanche of Montroc broke away at ~2500 ma.s.l. over an area of 30ha on a northwestern flank above Le Tour village, revealing a 1.5 m high fracture in the triggering zone. The exceptional snow volumes moved by this aerosol crossed the valley bottom and climbed up ~200m on the opposite flank, eventually sweeping away part of the hamlet of Montroc situated at 1350 m a.s.l.
Daily number of observed avalanches (blue bars, Cemagref database) and avalanche-hazard level forecasted by Météo-France (white bars) in the Mont Blanc massif in February 1999, according to the standard five-level European avalanche-hazard scale. Such forecasts, mainly based on the SCM output, may also result from the empirical knowledge of the local forecaster and additional local observations.

After this series of exceptional avalanches, 5 days of dry weather allowed significant settling of the recent snow below 2000m a.s.l. and superficial snowpack humidification in the southern exposures, up to ~2200 ma.s.l. (Reference VillecroseVillecrose, 1999). Sustained precipitation was recorded from 17 to 25 February, with average intensities of 0.3 m d-1 above 1800ma.s.l. and maximum values of 0.75 md-1 at 1800 m a.s.l. (Fig. 2), resulting in large snow accumulations. The temperature increased simultaneously and progressively so that the 0°C surface isotherm and thus the rain-snow limit reached higher altitudes on average than during the first precipitation episode of February (Fig. 2). These meteorological conditions resulted in moderate fresh-snow accumulations and partial snowpack stabilization at low altitudes, in contrast to early February. As a result of these snowpack characteristics, at low altitude the avalanches that occurred from 20 to 25 February, with a maximum activity on 22 February (Fig. 5), were generally of wet snow and small in extent.
4. Methods and Experiments
4.1. Numerical models
This study was carried out with the SCM numerical chain of Meteo-France (Reference Durand, Giraud, Brun, Mérindol and MartinDurand and others, 1999). The model suite provides diagnosed or forecasted avalanche hazards in the French Alps at the massif scale (400-500 km2 on average) for various altitudes, exposures and slopes. The models have been run since the early 1990s and validated on all French massifs on seasonal and climatological timescales (Reference Durand, Giraud, Brun, Mérindol and MartinDurand and others, 1999, 2009). We used the latest version of the models, which include an optional treatment of snowdrift, instead of the version available in 1999.
SAFRAN (Reference Durand, Brun, Merindol, Guyomarc’h, Lesaffre and MartinDurand and others, 1993, 1998, 1999) provides hourly outputs of air temperature, precipitation and their phase, humidity, cloudiness, horizontal wind speed as well as direct and indirect solar radiation. These data are available at the massif scale for elevations 900-3600 m a.s.l. at intervals of 300 m and six orientations (N, S, E, W, SE and SW). SAFRAN can be run in analysis or in forecast mode. In both cases, the first estimate is provided by mesoscale atmospheric models and several climatological fields. The analyses are made every 6hours using all available observations from various networks. In the forecast mode, the model exploits a database of analogous weather situations. The simulation mode (analysis or forecast) determines the type of the final SCM outputs, i.e. avalanche-hazard analysis or forecast.
Crocus (Reference Brun, Martin, Simon, Gendre and ColeouBrun and others, 1989, 1992) is a snow model that can use SAFRAN output to describe the energy and mass evolution of the snow cover. Values of temperature, density, liquid-water content and the stratigraphy of the snowpack are calculated each hour for the same elevations and orientations as those in SAFRAN and for three slopes (flat, 20° and 40°). Crocus is commonly initialized with a snow-free ground on 1 August. Simulations are subsequently run until complete snowpack melting without any intermediate reinitialization.
MÉPRA is an expert system (Reference Giraud and ArmstrongGiraud, 1993) which then estimates an avalanche hazard for the massif every 3 hours. This system deduces additional mechanical characteristics of the snow cover (shear stress, rammsonde resistance) from the snow properties simulated by Crocus. The natural mechanical stability of the snowpack is characterized by a natural stability index for each snow layer and for the same elevations, exposures and slopes as those in Crocus. This index can be written as follows for each snow layer, l, following Reference FöhnFöhn (1987), using the subscripts a for altitude range, o for orientation, s for slope and t for time-step:

where C laost is the shear strength of the snow layer, l, and τlaost is the shear stress resulting from the overburden snow depth. In Equation (1), 1 < l < L, 1 < a < A, 1 < o < O, 1 < s < S and 1 < t < T, with L, A, O, S and T, respectively, the number of layers, altitude ranges, orientations, slopes and time-steps. According to the magnitude and temporal evolution of S laost, and further based on concepts of fuzzy logic and empirical threshold values, a natural avalanche hazard is deduced for each snow profile on a six-level scale by MÉPRA (very low, moderate increasing, moderate decreasing, high or very high; Table 1, left column). Values ranging from 0 to 8, called M aost (Table 1, right column), can be attributed to each of these natural avalanche hazard levels to build snow stability indices (e.g. Reference Martin, Giraud, Lejeune and BoudartMartin and others, 2001; section 4.3). In MÉPRA, the natural hazard estimations are completed by a classification of different avalanche types (fresh dry, fresh wet, fresh mixed, surface slab, surface wet, bottom wet). In a similar way, MÉPRA can also diagnose accidental avalanche hazard due to skier overloading. This type of hazard is not considered in this study.
Natural avalanche hazard classes and corresponding M aost values from ME´PRA

Basic SCM runs do not treat snow accumulation or wind erosion. However, a routine called SYTRON can be included in the SCM chain to account for such effects (Durand and others, 2001). In such SAFRAN/SYTRON/Crocus/MÉPRA (SSCM) simulations, SYTRON uses both SAFRAN and Crocus output to compute, at a massif scale, snow transport rates by creep, saltation, suspension and sublimation, as a function of a friction wind and characteristics of the near-surface snow layers. Layers of drifted snow are subsequently integrated into the simulated snow profiles used by MEPRA to diagnose the avalanche hazard.
4.2. Sensitivity tests
The analysis of snow and weather conditions in section 3 raises several questions about the factors involved in this extreme avalanche situation:
-
1. Are the large and rapid surface cold-snow accumulations from 6 to 11 February a sufficient factor to explain the exceptional avalanche cycle?
-
2. Or did the mechanical characteristics of the underlying snowpack play a role in the large instability? In particular, what was the influence of the loose faceted crystals and recent snow in the upper snowpack on the avalanche trigger mechanisms?
-
3. What was the influence of the wind during the snowfalls of the end of January and early February? Did the wind-transported fresh snow enhance the snowpack instability?
To investigate these questions and explore the sensitivity of the avalanche hazard to various snow and weather factors, we carried out several numerical experiments in the first step of this study.
In a first simulation, all the snow and weather observations available from winter 1999 in the Mont Blanc massif are analyzed at the massif scale by the SCM models. This run, which used maximum input observations and thus minimized the simulation errors, can be considered as a reference experiment (REF). This simulation was initialized with a snow-free ground on 1 October 1998 and run until 28 February 1999.
The sensitivity to the mechanical features of the late January snowpack (i.e. large amounts of loose snow lying on a dense base) was tested in a scenario called HTN0. In this experiment, the SCM chain was run in the analysis mode as in the REF experiment, but the test was started on 1 February, with a ground free of snow cover. In this way, we removed the influence of the mechanical properties of the snowpack existing before the 6-11 February precipitation on the modeled instability.
The sensitivity to the amount of fresh snow accumulated in early February was tested in a scenario called RR/2. In this scenario, which was run from 1 October 1998 until 28 February 1999 as in the REF experiment, precipitation intensities were halved after 1 February. Therefore, the snowpack simulated in February shows a dense base covered by loose old snow layers and fresh surface snow accumulations that are roughly half those obtained in the REF run.
In a fourth experiment (SYT), the effects of snow transport by wind were investigated with SYTRON, i.e. using the SSCM chain, from 1 October 1998 to 28 February 1999.
In the second step of this work, we undertook the validation of the avalanche hazard forecasted by the current SCM chain on the exceptional avalanche cycles of February 1999. With this aim, a fifth experiment (PREVI) was undertaken in which the Crocus/MEPRA suite was initialized with SAFRAN analyses from 1 October 1998 to 8 February 1999 at 0600 UTC and subsequently fed each day by the 1 day range weather forecasts from SAFRAN until 28 February 1999.
4.3. Snow instability indices
To compare the results of the numerical tests, we used an index previously employed in a snow-cover stability study (Reference Martin, Giraud, Lejeune and BoudartMartin and others, 2001). We also built a new index to take into account extreme instability levels.
The first index, hereafter called IG, has been proposed by Reference Martin, Giraud, Lejeune and BoudartMartin and others (2001) to summarize at a daily and massif scale the avalanche hazards simulated at a 3 hour time-step for each snow layer, exposure and elevation by the SCM chain. To compute IG, the M aost estimations (Table 1, right column) are weighted by the altitude and exposure of the snow profile they describe. The daily maximum of these values is subsequently selected. Thus, with αa being an altitude weighting function, IG is given by

where 1 < a < A, 1 < o < O, 1 < s < S and 1 < t <T. This index spatially integrates the effects of altitude and orientation and advantageously accounts for the fact that natural avalanche release more likely occurs for maximum daily instability. However, by construction, IG ranges from 0 to 8 (Reference Martin, Giraud, Lejeune and BoudartMartin and others, 2001). Thus, this index may be insufficiently adapted to describe the evolution of large instability, particularly when it reaches its maximum value.
The new index developed for the needs of this study is based on a stability criterion applied to each snow layer of a profile. The most unstable layers, i.e. of shear strength less than twice the shear stress applied by the overlying layers, are sorted out. The raw index, S laost (Equation (1)), of each of these layers is subsequently weighted by the overlying snow depth, H laost, and the maximum of these values is selected. The new instability index is thus

where l ranges from 1 to the number of unstable snow layers within a profile, 1 < a < A, 1 < o < O, 1 < s < S and 1 < t < T. As with the M aost values, the ILP aost index characterizes the snowpack stability as a function of altitude, orientation and slope at a 3 hour time interval. This index accounts furthermore for the snow amount potentially drained in case of avalanche through the value of H laost. It can be noticed that, as S laost is linked linearly to H laost (Reference FöhnFöhn, 1987), ILP aost is quadratically dependent on this parameter. This power, not representative of any physical property, has been built according to a normalization scaling process and in order to obtain a more discriminating index, not saturated at high instability levels.
To compare the properties of ILP aost, available for each altitude, orientation and slope, to those of IG, available at the massif scale, we considered a spatial synthesis of the ILP aost values. These values are averaged over three successive downward elevation ranges, i.e. a height difference of 900 m representative of a large avalanche path. Finally, the maximum over the massif is selected at 0600 and 1200 UTC. The resulting synthetic index is thus

where 3 < a < A, 1 < o < O, 1 < s < S and t = 0600 or 1200 UTC. This index, which has a null minimum value and no upper limit, describes the snowpack instability on the massif twice a day. As this index quantifies the snow instability over large altitude differences, it also provides a qualitative indication of potential avalanche magnitudes.
5. Results and Discussion
Here we present the SCM analysis and forecasts as well as the results of the sensitivity tests. All the simulations except HTN0 start in early winter, but we focus here on the results of February, as this period covers the largest avalanche cycles observed in the Chamonix valley.
5.1. SCM analysis (REF experiment)
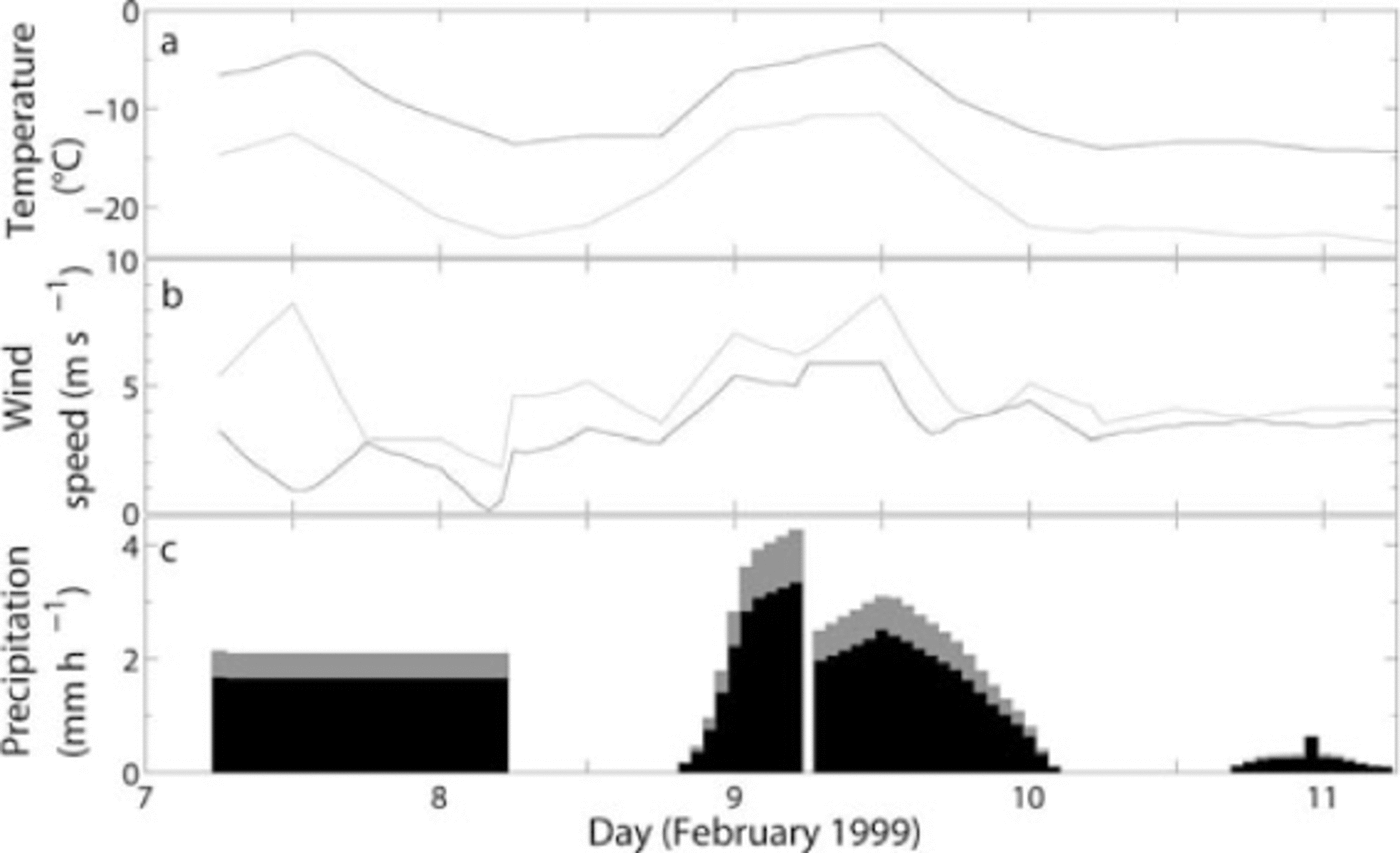
Figure 6 shows air temperatures, wind speeds and precipitation intensities analyzed at 1800 and 3000ma.s.l. by SAFRAN in February. The altitudinal trend in the precipitation intensities obtained over this period is in accordance with orographic effects which enhance precipitation at altitude. Negative altitudinal gradients of temperature dominate except during several periods of temperature inversion in early and mid-February (Fig. 6a), which correspond to air soundings performed in Lyon located 150 km east of Chamonix (not shown). Moderate wind velocities prevailed throughout the month (Fig. 6b).
Weather conditions analyzed at 1800 (black) and 3000m a.s.l. (gray) in February 1999. (a) Air temperature, (b) wind speeds and (c) precipitation intensity.

The meteorological analyses display two main events of precipitation, from 5 February in the evening to 10 February and from 17 to 25 February, respectively (Fig. 6c). The first episode is characterized by large precipitation intensities that reach a climax on 9 February and are accompanied by strongly negative air temperatures and moderate winds. A short interruption in the precipitation on 8 February coincides with a brief temperature increase and weakening wind (Fig. 6). The second precipitation episode is characterized by globally milder temperatures, stronger winds and lower precipitation intensities. During this episode, maximums of precipitation intensities and wind speeds are reached on 22 February, while the temperature simultaneously decreases (Fig. 6a and c). For both episodes, the weather analyses qualitatively agree with the observed weather conditions described in section 3.3.
The snow-cover evolution analyzed by Crocus at middle altitude in the Mont Blanc massif in winter 1998/99 is shown in Figure 7. The simulated snowpack displays a basal layer of depth hoar throughout the winter, especially below 2100 m a.s.l., and relatively small snow depths until late January. Subsequently, the snow depths increase rapidly due to the precipitation events occurring from late January to late February. At about 11 February, particularly large fresh-snow accumulations form at the surface of the snowpack. Other simulated snow profiles (not shown) reveal similar layering features, with maximum snow depths simulated in western and northern orientations. These characteristics, which probably reflect the combined effects of the early winter snow and weather conditions, the intense January and February precipitations and the main direction of synoptic winds, correspond to snow-pit observations made in Megeve on 2 February (Fig. 3).
Snow-cover structure simulated on a flat exposure at 1800, 2100, 2400 and 2700 ma.s.l. from 24 October 1998 to 28 February 1999, with colors indicating the snow types (Reference Brun, David, Sudul and BrunotBrun and others, 1992). Note the layers of faceted crystals (light blue) overlying a partially refrozen base (red), and large fresh surface snow accumulations (green), from the end of January to the end of February.

5.2. Information from the instability indices in the REF experiment
The respective properties of the IG index and the new indices (IL and ILP aost) used in this study are investigated based on the results of the REF experiment at the massif scale (Fig. 8, blue curves) and the projection maps of ILP aost (Fig. 9).
Daily avalanche hazard simulated in the sensitivity experiments and summarized at the massif scale by (a) IG and (b) IL indices.

Maps of daily avalanche hazard showing ILP aost index values obtained for the reference scenario from (a–f) 6 to 11 February 1999, respectively, at 1200 UTC in the Chamonix valley (see box in Fig. 1).

Figure 8 illustrates the avalanche hazard synthesized at the massif scale by IG and IL (Equations (2) and (4), respectively) for all the experiments. In all experiments, the results reflect the two periods of large snow instability of February, with particularly large index values that are reached at about 7-13 and 20-24 February, in agreement with the peaks of observed avalanche activity (Figs 5 and 8). In the REF experiment, the maximum value of IG is attained during both episodes (Fig. 8a, blue curves), in contrast to IL, which reaches an absolute maximum on 9 February, roughly twice as large as the second peak value on 22 and 23 February (Fig. 8b, blue curves). More generally, IL, which is calculated twice a day, seems to be more sensitive to weather fluctuations than daily IG values (Fig. 8, blue curves). As such, IL decreases temporally during the weather lull of 8 February, whereas IG increases monotonically. Moreover, IL decreases immediately after reaching a maximum value on 9 February, whereas IG still exhibits extremely large instability for the following 2 days.
Figure 9 shows daily projections of IL on a digital elevation model (DEM) during the first avalanche cycle. These maps show that the avalanche hazard started to increase on 6 February as a result of the first snowfalls, primarily above 3000ma.s.l. (Fig. 9a and b). From 7 to 11 February, snow instability was constantly large above 2500 m a.s.l. and closely related to weather variations at lower elevations. In particular, the partial snow stabilization displayed by decreasing IL values on 8 February (Fig. 8) seemed to occur preferentially at low altitudes (Fig. 9c). On 9 February, which corresponds to the date of the Montroc avalanche, high avalanche hazards reached the valley bottom (Fig. 9d). Subsequently, as the storm dispersed, there was a general and slow decrease of the instability levels, more pronounced at low altitudes (Fig. 9e and f). These results indicate that for the first cycle of February the variations of the hazard at the massif scale (Fig. 8) mostly reflect the snow-cover evolution at middle altitudes.
The good correlation between the snow stability indices and the avalanche occurrence is in agreement with previous works (Reference Jamieson, Zeidler and BrownJamieson and others, 2007), which also suggest that such correlation increases in case of snowpacks showing widespread weak layers. In this study, weak layers were identified, mainly in the loose snow of the upper snowpack (section 3.1). The occurrence frequency table of IG and IL in the Mont Blanc massif calculated over the period 19582004 indicates that their maximum values in February 1999 are reached only exceptionally (Table 2), so that Figure 8 underlines the extreme magnitude of the snow instability throughout February 1999. As it has no upper limit, IL furthermore provides fine insights into the evolution of the snowpack instability throughout February, suggesting that the avalanche situation was more critical at the beginning than at the end of the month. Moreover, the high sensitivity of this index to weather conditions is of primary interest for avalanche-hazard forecasting. Indeed, it is empirically known that, for new-snow avalanches, instability indices built on the ratio of shear strength to load following Fohn (1987) (Equation (1)) reflect the ratio of bonding between ice particles to shear stress so that IL trends are likely to provide information on the densification process within the snow- pack. Therefore, this index, completed by ILP aost instability maps (Fig. 9), may be a helpful tool to anticipate the magnitude, occurrence and location of large avalanche cycles in an operational context.
Occurrence frequency (%) of IG and IL index values in the Mont Blanc massif computed on days with snow-covered ground, from 1958 to 2004

5.3. Avalanche hazard sensitivity and forecast
5.3.1. Sensitivity tests (RR/2, HTN0 and SYT experiments)
The sensitivity of the avalanche hazard to the snow and weather factors identified in section 4.2 is explored by comparing the results of the RR/2, HTN0 and SYT experiments to those of the REF run. Results synthesized at the massif scale (Fig. 8) are completed by Figure 10, which shows ILP aost values projected on the massif on 9 February for the different experiments.
Maps of daily avalanche hazard showing ILP aost index values obtained on 9 February 1999 at 1200 UTC in the Chamonix valley for the various sensitivity tests: (a) REF, (b) RR/2, (c) HTN0 and (d) SYT.

In the RR/2 experiment, the instability levels are still exceptional (Table 2), but largely below those of the reference situation throughout February. Values of IG and IL are less than half the reference values (Fig. 8), particularly below 2500ma.s.l. (Fig. 10a and b). The snowpack simulated in this scenario presents a weak structure above the base, as in the REF run, but much smaller surface accumulations of fresh snow. This experiment thus indicates that the simulated hazard level strongly depends on the amount of snow accumulated in February.
The avalanche hazards simulated in the HTN0 experiment are generally lower than in the REF scenario, particularly below 3000ma.s.l. (Figs 8 and 10a-c). This result shows that the snowpack resulting only from the February snowfalls is more stable than in the reference case. In other words, the upper loose layers of faceted crystal and fine grains of the snowpack at the end of January are an important factor to explain the large avalanche hazard of February. However, the avalanche hazards simulated in the HTN0 experiment are larger than in the RR/2 run (Fig. 8), suggesting that the larger the February snow accumulations, the more unstable the snowpack, independent of the stability conditions before February.
It can be seen from these three sensitivity experiments that the extreme avalanche hazards of early February were primarily due to the exceptional precipitation intensities of early February. We thus suggest, in agreement with previous observation-based studies of these events in France (e.g. Reference VillecroseVillecrose, 1999;Reference Marco, Karr and SkolautMarco and Karr, 2009), that the avalanches were triggered mostly in the surface snow accumulated in February. However, we cannot exclude that, in some places, the deepest weak layers may have failed when loaded by large fresh-snow accumulations. Whether or not they were responsible for avalanche initiation in all cases, these weakest layers may have failed under the load of avalanches triggered at higher altitude, explaining at least part of the exceptional snow volumes that were moved by the avalanches. The dramatic avalanche of Montroc may thus have been caused by the combination of large snow instability at about 2400ma.s.l. and important amounts of movable snow below.
In the SYT experiment, IL is generally larger than in the REF run, in contrast to IG (Fig. 8). IL seems particularly sensitive to snowdrift effects on 9 February, where it shows an avalanche hazard level roughly twice as large as in the REF run (Fig. 8b). As shown in Figure 10d, snowpack instability associated with snowdrift seems to affect all altitudes and exposures. Interestingly, IL displays an absolute maximum during the first February storm, which does not coincide with the period of maximum wind velocities (Figs 6 and 8b). This result, difficult to verify years afterwards, may be accounted for by the changing properties of the surface snow throughout February. The first storm deposited important amounts of fresh cold snow. This snow, easily erodible by wind, may have formed locally large accumulations of denser surface snow and thus reduced the snowpack stability. The second avalanche cycle of February resulted from intense precipitations and mild weather conditions. The effects of snowdrift were not as significant as during the first episode, probably because the surface snow had become less erodible.
5.3.2. SCM forecast (PREVI experiment)
The SCM forecasts of snow instability relative to the first avalanche cycle of February can be evaluated comparing IG and IL values obtained in the REF and PREVI runs (Fig. 8, blue and green curves). This comparison reveals a rather good correlation between the analysis and the forecasts of the avalanche hazard, both in terms of magnitude and temporal evolution. On 9 February, however, the forecasted hazard is slightly underestimated by both indices. These features are likely to be explained by the SAFRAN weather forecasts. SAFRAN forecasts of temperature, wind and precipitation during the first avalanche cycle for low and mid-altitudes (Fig. 11) globally match the analyzed corresponding variables (Fig. 6). In particular, there is a very close correspondence between the maximums of the forecasted and analyzed precipitation intensities, which both occur on 9 February, reaching 3 and 4mmh-1 at 1800 and 3000 m a.s.l., respectively (Figs 6c and 11c). However, the forecasted precipitation intensities are underestimated on 9 February in the morning, possibly because of erroneous input data from large-scale atmospheric models used by SAFRAN.
Weather conditions simulated at 1800 (black) and 3000 m a.s.l. (gray) in February 1999 showing data analyzed until 8 February at 0600UTC and forecasted thereafter. (a) Air temperature, (b) wind speed and (c) precipitation intensity.
6. Conclusions
The SCM models have been validated in several studies under normal snow and weather conditions. The present work is the first study carried out with the SCM chain aimed at exploring numerically both (1) the sensitivity of the avalanche hazard to snow and weather factors and (2) the reliability of the avalanche hazard forecast in the case of the extreme avalanche hazards of February 1999 in the Mont Blanc massif.
Factors responsible for extreme avalanche phenomena are poorly known, because they are rare and involve dangerous snow conditions which often impede direct observations. In this study, an attempt was made to validate the SCM models on a situation of extreme new-snow avalanches, despite sparse available validation data. First, the models were run in the analysis mode. Comparison of intermediate outputs of weather, snow profiles and snow stability with weather, snow stratigraphy and avalanche observations showed that the models could reproduce with good confidence the exceptional magnitude and the temporal evolution of the avalanche hazard at the massif scale, on condition that snow instability indices adapted to extreme new-snow accumulations were used. The results of this first run were subsequently compared with those of an operational run, showing that in February 1999 the operational SCM chain provided reliable forecasts of extreme avalanche cycles. The main uncertainties, which here did not impact significantly upon the hazard level forecast, were the magnitudes of the precipitation and probably the result of erroneous inputs of large-scale precipitation fields from atmospheric models.
The sensitivity tests performed in this study advantageously completed our initial observation-based knowledge of the February 1999 situation. Results of these tests were in accordance with those of previous studies, suggesting that both the large fresh-snow accumulations of February resulting from intense precipitation and wind drift, and the loose snow layers characterizing the upper snowpack at the end of January, were involved in the large February avalanches. Our results furthermore provided information about the relative significance of those factors. Thus, precipitation was the primary factor in avalanche triggering, responsible for extreme snowpack instability. This instability was significantly strengthened by snow transported by the wind. In contrast, the mechanical weaknesses of the deepest snow, existing prior to February, may not have been a primary avalanche-triggering factor. They may, however, have increased the volume of snow pulled down by avalanches triggered on the surface layers, explaining the unusual extents and paths of the avalanches in February.
A strength of the snow and weather models used in this study is that they provide additional information on altitude, exposure and slope on the avalanche hazard level estimated at the massif scale compared with other statistical approaches, i.e. based on precipitation measurements. However, the typical spatial scale of the models, i.e. the massif scale, is much larger than those relevant for accurate avalanche-hazard forecasting, i.e. the scale of an avalanche path, and requires downscaling procedures. Nowadays, operational fine-scale avalanche-hazard estimations rely mainly on regional forecasts which are completed by local observations, historical records and the field experience of local avalanche forecasters (Reference Jamieson, Campbell and JonesJamieson and others, 2008). In February 1999, the local forecasters were able to foresee the exceptional degree of avalanche hazard on the Mont Blanc massif using the SCM outputs, but could not provide the public and the civil security with a fine-scale description of the areas under threat. It is interesting to note that in 1999 the lower part of the Montroc avalanche path was not registered among the avalanche risk areas. These reasons may explain why the local authorities were unable to anticipate the need for protection measures in the Montroc area, whereas other parts of the massif were highly monitored.
In this study, a first step was achieved to improve the spatial description of extreme avalanche hazards. First, a snowdrift parameterization was used to refine the hazard magnitude simulations according to the properties of the surface snow. In addition, a new index was developed to describe levels of snowpack instability as a function of altitude, slope and exposure as well as depth of movable snow. The correlation of this spatialized index with avalanches in surrounding terrain is likely to be limited by scale effects related to local weather and topography (Reference Jamieson, Zeidler and BrownJamieson and others, 2007). Nevertheless, because it has no upper value, in extreme situations this index provides finer information on the degree of instability, its evolution and localization than existing indices built at the massif scale or that may reach a saturation value. Moreover, maps of this index projected on the massif topography facilitate the visualization of the SCM results. Therefore, both SCM forecasts treating snowdrift effects and operational use of the new stability index by local forecasters are highly recommended, particularly in the case of extreme new- snow avalanche cycles.
Accurate description of snowpack instability at the avalanche-path scale remains a crucial issue to improve the protection of inhabitants and infrastructure against snow avalanches. To obtain such high-resolution results, the respective influences of fine-scale meteorology and local topographical effects on mechanical snowpack stability have to be accounted for. Emerging dynamic downscaling techniques of atmospheric models and snow mechanical models (e.g. Fohn and others, 2002) may be promising tools to address these questions.
Acknowledgements
This research was funded by the European Commission (contract 018412) within the IRASMOS project (Integral Risk Management of Extremely Rapid Mass Movements). We are grateful to C. Coléou, G. Guyomarc’h and J.P. Navarre for stimulating discussions and their interest in this study. We thank the scientific editor P. Bartelt and three anonymous reviewers for insightful comments that greatly improved the quality and focus of the manuscript. This work is dedicated to the memory of our colleague M. Sudul.



