Introduction
The prevalence of obesity is increasing worldwide and is a major public health concern due to obesity-related co-morbidities and increased mortality risk (WHO, 2000). Individuals with overweight or obesity are not only affected in their physical health, but they can also suffer from social discrimination in virtually all areas of life (Andreyeva et al., Reference Andreyeva, Puhl and Brownell2008; Fruh et al., Reference Fruh, Nadglowski, Hal, Davis, Croo and Zlomke2016). Western societies consider thinness to be an ideal of beauty and commonly believe that overweight and obesity are under personal control, and that individuals with obesity are responsible for their condition and considered lazy, weak-willed or lacking in self-discipline. This ‘obesity stigma’ (Puhl & Heuer, Reference Puhl and Heuer2010; Tomiyama, Reference Tomiyama2014) is linked to low self-esteem, poor peer relationships and an increase in the development of severe psychological, physical and social problems, and even to the risk of a greater degree of obesity (Latner & Stefano, Reference Latner and Stefano2016). Discrimination related to being overweight or obese is sex/gender-related (Bookwala & Boyar, Reference Bookwala and Boyar2008): from infancy, tolerance of overweight in boys is higher than that in overweight girls (Smolak, Reference Smolak2004), and this gendered stigmatization can continue through the life cycle. People branded as fat may internalize societal discourses on overweight and obesity (i.e. the personal responsibility for their body shape), and move away from public health messages related to the prevention and treatment of obesity (Barlösius & Philipps, Reference Barlösius and Philipps2015).
For a long time, obesity has been considered a metabolic and genetic disease treated mainly by diet change, drugs or surgery, while eating disorders (principally anorexia and bulimia) have been considered syndromes of the culture of the well-being, and have been treated mainly by cognitive behavioural therapy. However, this polarization does not currently make sense since numerous investigations have revealed the importance of psychosocial factors in the development of obesity, and different shared risk factors for eating disorders and obesity have been described, including genes, low self-esteem, dieting, media exposure and body image dissatisfaction (Day et al., Reference Day, Ternouth and Collier2009). Ethnic differences in obesity also exist, mediated by the process of acculturation, which includes a large number of biological and cultural factors and their interactions (Menigoz et al., Reference Menigoz, Nathan and Turrel2016). For this reason, more and more specialists dedicated to the study and treatment of obesity now take into account the environmental, social, cultural and psychological aspects of the condition, and carry out multidisciplinary actions in order to establish the most appropriate methods of intervention (psychological, medical or surgical).
Body image is a subjective and multidimensional construct (Cash & Pruzinsky, Reference Cash and Pruzinsky2002); it depends on different biological, psychological and cultural factors such as family, peers, mass media and ethnicity (Zaccagni et al., Reference Zaccagni, Masotti, Donati, Mazzoni and Gualdi-Russo2014) and can influence a person’s quality of life, as well as affective, cognitive and behavioural functioning (Pruzinsky & Cash, Reference Pruzinsky, Cash, Cash and Pruzinsky2002). Body image can be evaluated through different methods that assess weight and appearance satisfaction, body image investment and size perception (Sarwer et al., Reference Sarwer, Thompson and Cash2005). As the perceptual component of body image refers principally to body size (Neagu, Reference Neagu2015), disparities between the perceived and desired body size, as well as between the perceived and actual body size, are of great importance in body image perception and satisfaction. Body image dissatisfaction has been identified as a psychological consequence of obesity, which is also related to eating disorders, poor self-esteem and depression (Weinberger et al., Reference Weinberger, Kersting, Riedel-Heller and Luck-Sikorski2016). Many studies have related obesity to poor body image, but not all persons with obesity suffer from this problem or are equally vulnerable (Schwartz & Brownell, Reference Schwartz and Brownell2004). Besides, the so-called ‘normative discontent’ describes ‘the widespread weight dissatisfaction among women’ (Rodin et al., Reference Rodin, Silberstein and Striegel-Moore1984) but is observed in men too (Tantleff-Dun et al., Reference Tantleff-Dunn, Barnes and Gokee Larose2011), and also found in individuals of normal weight (Padgett & Biro, Reference Padgett and Biro2003; Weinberger et al., Reference Weinberger, Kersting, Riedel-Heller and Luck-Sikorski2016).
Nutritional status varies from one individual to another and within the same individual due to intrinsic (e.g. age, genetics) and extrinsic factors (e.g. diet, physical activity). Changes in nutritional status consequently result in the modification of body size and shape, and therefore also in body image perception and satisfaction. Cultural influences are a powerful determinant of body morphology, since cultural values unequivocally influence how members of a culture think about and behave towards other individuals (Cash & Pruzinsky, Reference Cash and Pruzinsky2002). In contemporary Western societies, socio-cultural influences known as a ‘culture of thinness’ can be appreciated in many mass media. Besides, this influence is specifically targeted at each sex, and plays an important role in the unequal development of body image dissatisfaction between the sexes. In women, attractiveness is associated with being thin, but a more muscular appearance is considered attractive in men (Brennan et al., Reference Brennan, Lalonde and Bain2010). All this can generate unrealistic ideal body images that are far from reality and could lead to conflicts between ‘ideal beauty’ and the ‘actual image’. An obsessive behaviour related to body image, in trying to reach what is beautiful in a society, could lead to low self-esteem, body image disorders and even to eating disorders and obesity, especially in women, where social rules and aesthetic cultural models are much more rigid than for men.
Body morphology and composition experience drastic changes during childhood and adolescence, when individuals are more socially and psychologically vulnerable, so these stages have been the focus of attention of the majority of body image perception studies (Abbott et al., Reference Abbott, Stubbs and Davies2010; Barret & Huffman, Reference Barrett and Huffman2011; Chang et al., Reference Chang, Lee, Chen, Chiu, Pan and Huang2013; Cohelo et al., Reference Cohelo, Fonseca, Oinro and Mourao-Carvalhal2016; Solomon-Krauss et al., Reference Solomon-Krakus, Sabiston, Brunet, Castonguay, Maximova and Henderson2017). Studies have also been conducted in adulthood (e.g. Tiggemann, Reference Tiggemann2004; Schuler et al., Reference Schuler, Vinci, Isosaari, Philipp, Todorovich, Roy and Evans2008; Bibiloni et al., Reference Bibiloni, Coll, Pich, Pons and Tur2017; Easton et al., Reference Easton, Stephens and Sicilia2017) – a period in the human lifespan characterized by relative physical stability in young adulthood and a sequence of changes during middle and late adulthood. Weight gain, reduction in tonus and muscle mass and changes in the amount and distribution of body fat are consubstantial to the ageing process. In addition, a ‘physiologic anorexia of ageing’ has also been observed in the elderly due to a deficiency in the regulation of energy intake that puts them at risk of developing either positive or negative balance (Morley, Reference Morley1997). These changes in metabolism and body composition could be a source of body dissatisfaction. Nevertheless, studies performed in adults show contradictory findings (Tiggeman, Reference Tiggemann2004; Neagu, Reference Neagu2015).
The links between nutritional status and body image are intricate and have generated considerable research and clinical interest. The main objective of this paper was to explore different aspects of body image in an adult sample of women and men from the Basque Country in Spain. Participants with normal weight, overweight and obesity were included to assess the relationship between body image and BMI, as well as to determine possible sex and age differences in body image perception and satisfaction. Despite the large volume of research on body image, studies directly comparing body image perceptions of men and women are relatively scarce in the Basque Country, a region of Europe well described at the anthropological and genetic level, but under-represented in the scientific literature on body image and obesity.
Methods
Sample
The study sample was comprised of 405 participants (227 women and 178 men) aged from 18 to 70 years, living in the Basque Country in Spain and nested within a wider sample obtained to analyse the genetic and environmental determinants of obesity in this population. Sample recruitment was carried out in different locations (i.e. medical, educational and work centres) during 2010–2013, and performed under a case-control design. Participants were deliberately chosen according to the presence or absence of obesity; however, the sample was analysed considering cases and controls together. According to the socioeconomic information obtained through standardized personal interview, the sample can be considered as generally middle class. In accordance with the Helsinki Declaration, written informed consent was obtained from all participants. The research was approved by the Ethics Committee for Research Involving Human Beings of the University of the Basque Country.
Anthropometric measurements
Anthropometric measurements were taken following standard anthropometric techniques (Lohman et al., Reference Lohman, Roche and Martorell1988). Height (cm) was measured with a Siber-Hegner Anthropometer (GPM, Switzerland) accurate to 1 mm, and body weight (kg) with a digital balance accurate to 0.1 kg. Both measurements were taken by the same investigator (M.E.I-Z) to avoid inter-observer variability. Body mass index (BMI), calculated as weight (kg)/height (m2), was classified into five nutritional status categories following the cut-off points established by WHO (2000) for adult population: underweight (UW; BMI<18.5 kg/m2), normal weight (NW; BMI=18.5–24.9 kg/m2), overweight (OW; BMI=25–29.9 kg/m2), obesity (O; BMI=30–39.9 kg/m2) and morbid obesity (MO; BMI≥40 kg/m2).
Body image
The figure rating scale designed and validated by Stunkard et al. (Reference Stunkard, Sørensen and Schulsinger1983) was used to evaluate body image perceptions and preferences. This instrument consists of nine silhouettes for each sex (adult women and men) that range from very thin (silhouette 1) to very obese (silhouette 9). The sex- and age-specific correspondence between silhouettes and BMI was established by Bulik et al. (Reference Bulik, Wade, Heath, Martin, Stunkard and Eaves2001) in a large Caucasian population sample. Two body image variables were obtained directly from this silhouettes collection: Current Body Image (CBI), which assesses perceived appearance by asking participants to identify the figure that best represents their current body size, and Ideal Body Image (IBI), which assesses appearance preferences by asking participants to identify the figure that best represents their desired body size.
From these variables, two derived scores were calculated: a body image Dissatisfaction Score (DS) and a body image Inconsistency Score (IS). The DS is calculated as CBI–IBI (Kronenfeld et al., Reference Kronenfeld, Reba-Harreleson, Von Holle, Lynn Reyes and Bulik2010). This is a measure of dissatisfaction with current body size, where ‘0’ indicates full satisfaction and larger numbers indicate dissatisfaction, as indicated by a discrepancy between current body size and ideal body size. Positive numbers indicate a dissatisfaction by excess, and negative numbers indicate a dissatisfaction by insufficiency. Based on this, seven categories were created: (3) Severe dissatisfaction by excess; (2) Moderate dissatisfaction by excess; (1) Slight dissatisfaction by excess; (0) Full satisfaction; (–1) Slight dissatisfaction by insufficiency; (–2) Moderate dissatisfaction by insufficiency; and (–3) Severe dissatisfaction by insufficiency. The IS was calculated by subtracting the nutritional status obtained based on measured BMI from the nutritional status estimated based on the silhouette chosen by the participant to represent his/her CBI (Zaccagni et al., Reference Zaccagni, Masotti, Donati, Mazzoni and Gualdi-Russo2014). The IS represents a measure of inconsistency between the perception of the CBI and the real nutritional status, where ‘0’ indicates full consistency and larger numbers indicate greater inconsistency. Negative values indicate an underestimation of the real body size whereas positive values indicate an overestimation of it. Based on this, five categories were made: (2) Moderate inconsistency by overestimation; (1) Slight inconsistency by overestimation; (0) Full consistency; (–1) Slight inconsistency by underestimation; and (–2) Moderate inconsistency by underestimation.
Analysis
The sample was divided into four groups based on sex (women and men) and age group (early adulthood <45 years, and middle/older adulthood ≥45 years). Sex differences in each age group and age differences within each sex were tested for the four studied variables (CBI, IBI, DS and IS) using a non-parametric Mann–Whitney U test for ordinal data. The associations between BMI categories and the different body image variables were tested using a Gamma coefficient for ordinal data. Body image categories with less than 10% of representation were excluded from the association analyses, as they were not considered to be representative enough of the category. Analyses were performed in SPSS 23.0 (SPSS Inc., Chicago, IL), with statistical significance set at p<0.05.
Results
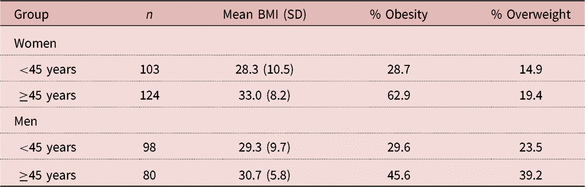
The mean BMI of the respondents was above 28 kg/m2 in all age and sex groups indicating a high prevalence of overweight and obesity in the sample, as expected due to the sample design. There were higher percentages of participants with obesity among the older than among the younger participants, especially for older women (62.9%) (Table 1).
Mean BMI and percentage of obesity and overweight for women and men by age group

Current Body Image (CBI)
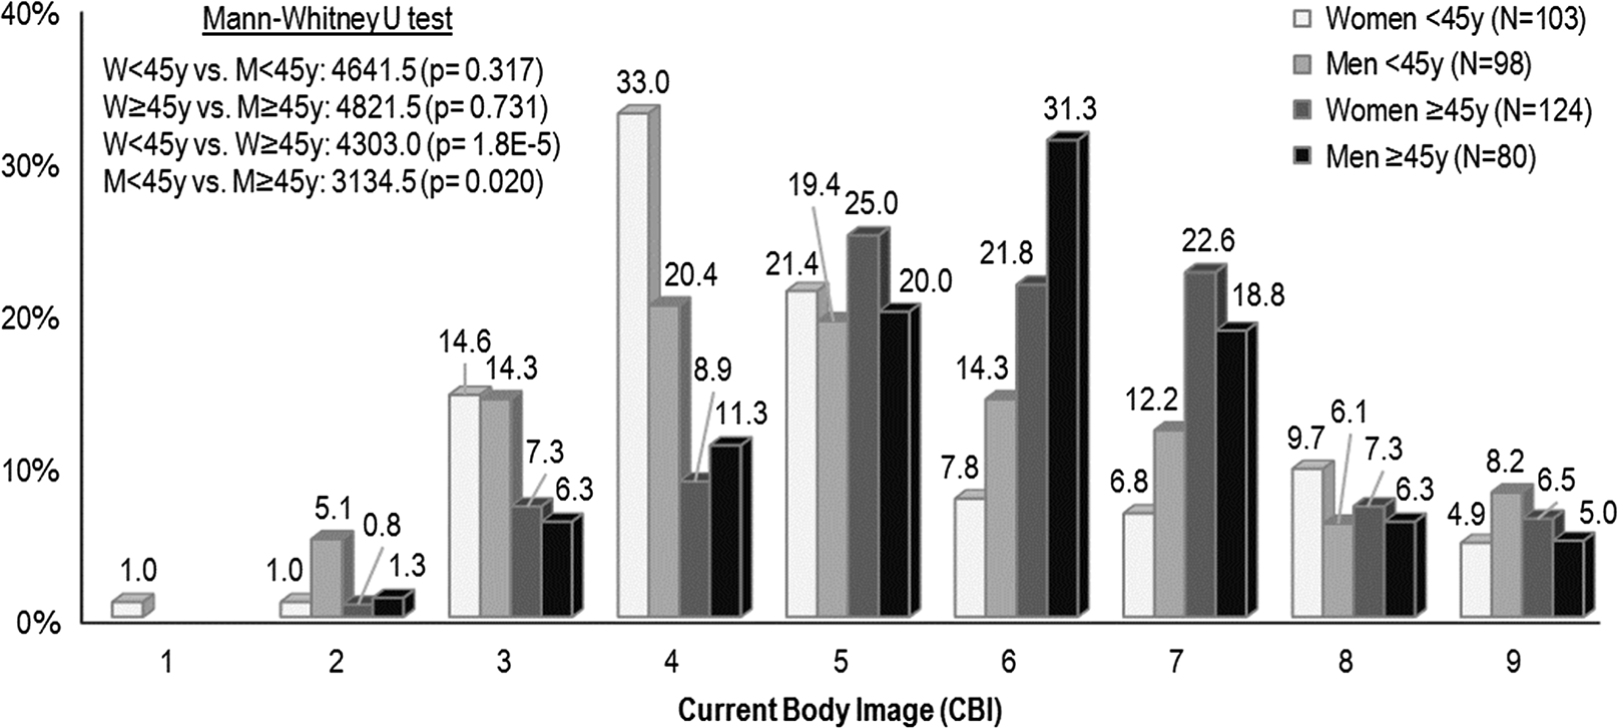
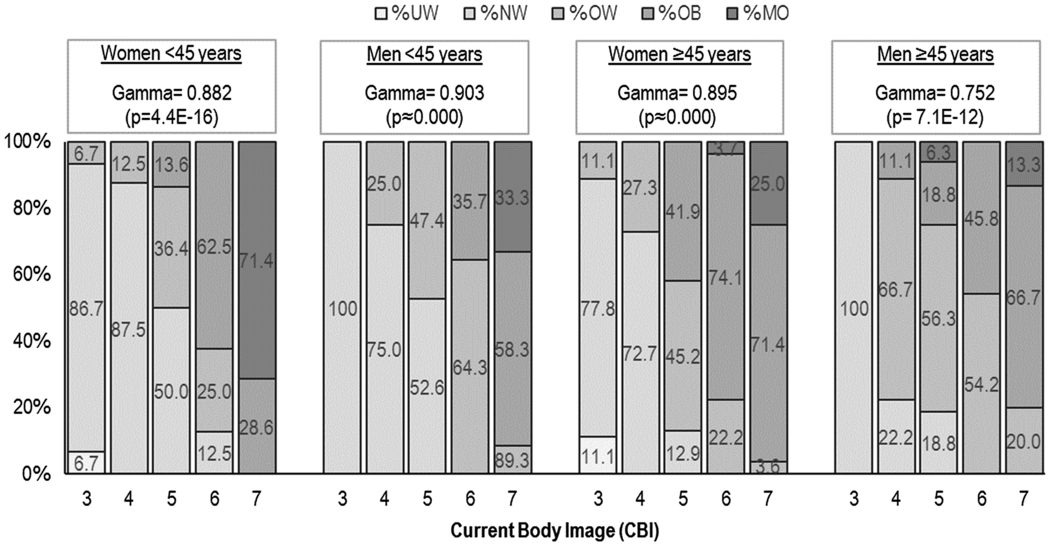
The most frequently chosen silhouette to represent CBI in the youngest groups was number 4 (33.0% of women and 20.4% of men); in the older groups, 25.0% of women chose silhouette number 5 and 31.3% of men number 6 (Fig. 1). No men and only 1% of women from the youngest group chose silhouette number 1. There were no sex differences in the chosen CBI in either of the two age groups, but age differences were significant in both sexes (p<0.001 for women; p<0.05 for men). Body mass index was significantly associated (p<0.001) with CBI in all sex and age groups (Fig. 2). Participants with a lower BMI chose smaller silhouettes, whereas those with a higher BMI chose bigger ones.
Percentages of women (W) and men (M) by age group who chose each of the nine silhouettes as best representing their Current Body Image (CBI). Values of non-parametric U test are shown.

Percentage of participants in each nutritional category choosing each Current Body Image (CBI) silhouette number by sex and age group. UW: underweight; NW: normal weight; OW: overweight; O: obesity; MO: morbid obesity. Values of Gamma coefficients are shown.

Ideal Body Image (IBI)
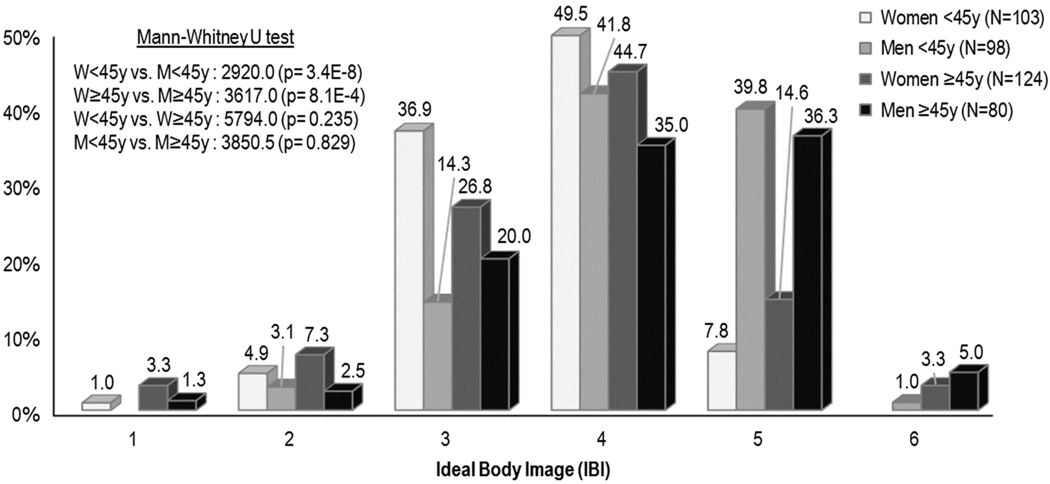
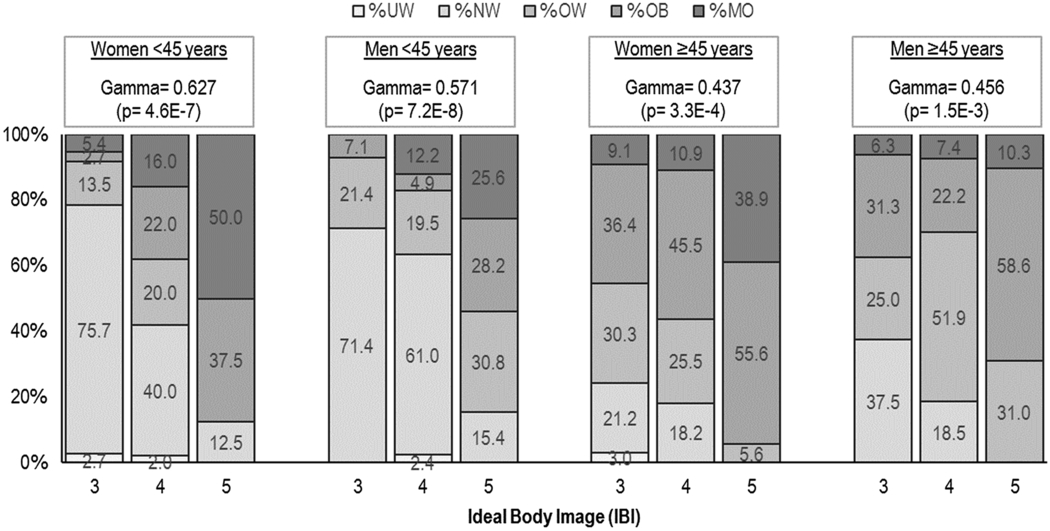
The percentages of participants who chose each silhouette as their Ideal Body Image (IBI) for women and men by age group are presented in Fig. 3. Silhouettes above number 6 were not chosen as best representing their IBI for any sex or age group. In participants <45 years, the most often chosen silhouette was number 4 (49.5% by women and 41.8% by men), followed by number 3 for women (36.9%) and number 5 for men (39.8%). Among the older participants, numbers 3, 4 and 5 were also the most chosen silhouettes: 4 (44.7%) and 3 (26.8%) for women, and 5 (36.3%) and 4 (35.0%) for men. Few participants chose silhouettes 1, 2 or 6. In both age groups there were sex differences in the silhouettes chosen as IBI (p<0.001) but age differences within the sexes were not significant. BMI and IBI showed a positive and significant association in all studied groups (p<0.01); this association was stronger in participants under 45 years (Fig. 4). Among participants <45 years, more than 75% of women and 71% of men who chose silhouette number 3 were of normal weight, whereas around 85% of participants who chose number 5 were overweight or obese. In the older group, the prevalence of obesity was higher in each chosen ideal silhouette compared with the younger groups.
Percentages of women (W) and men (M) by age group who chose each of the nine silhouettes as best representing their Ideal Body Image (IBI). Values of non-parametric U test are shown.

Percentage of participants in each nutritional category choosing each Ideal Body Image (IBI) silhouette number by sex and age group. UW: underweight; NW: normal weight; OW: overweight; O: obesity; MO: morbid obesity. Values of Gamma coefficients are shown.

Dissatisfaction Score (DS)
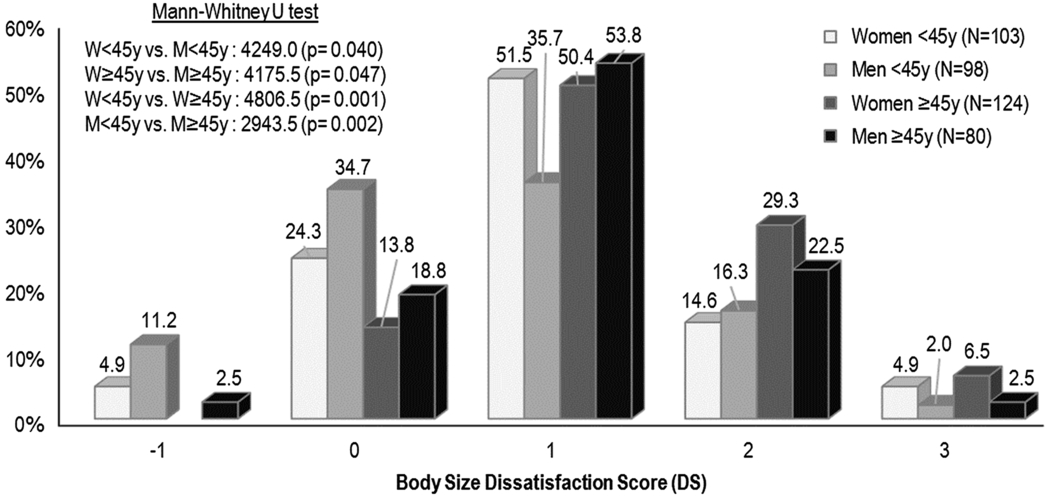
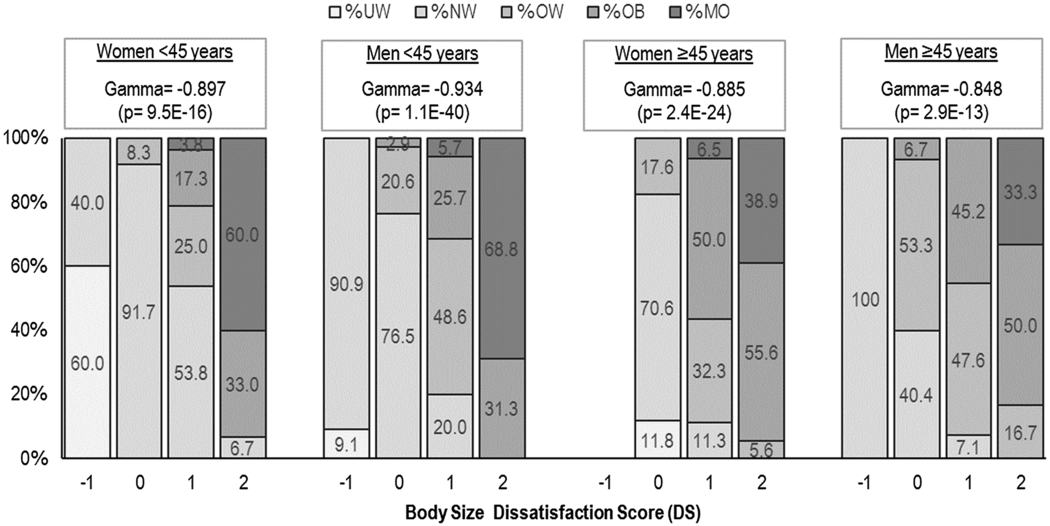
Figure 5 shows the percentage of participants included in each DS category by age and sex group. The DS showed sex differences in both age groups (p<0.05). Women showed a higher percentage of dissatisfaction by excess than men (<45 years: 71% vs 54%; ≥45 years: 86.2% vs 78.8%), whereas men presented higher percentages of satisfaction (<45 years: 24.3% vs 34.7%; ≥45 years: 13.8% vs 18.8%). Age differences in the DS were also significant for both sexes (p<0.001 for women; p<0.01 for men). A higher level of dissatisfaction by excess in the older groups was observed compared with the younger groups; however, the performed analyses did not determine if the dissatisfaction found in this group was due to their higher age or to their higher BMI. The DS showed a significant negative association with BMI in the four considered groups (p<0.001) (Fig. 6). Participants with a higher BMI category presented body image dissatisfaction by desiring smaller body sizes.
Percentages of women (W) and men (M) by age group for each body size Dissatisfaction Score (DS) category. Values of non-parametric U test are shown.

Percentage of participants in each nutritional category for each body size Dissatisfaction Score (DS) by sex and age group. UW: underweight; NW: normal weight; OW: overweight; O: obesity; MO: morbid obesity. Values of Gamma coefficients are shown.

Inconsistency Score (IS)
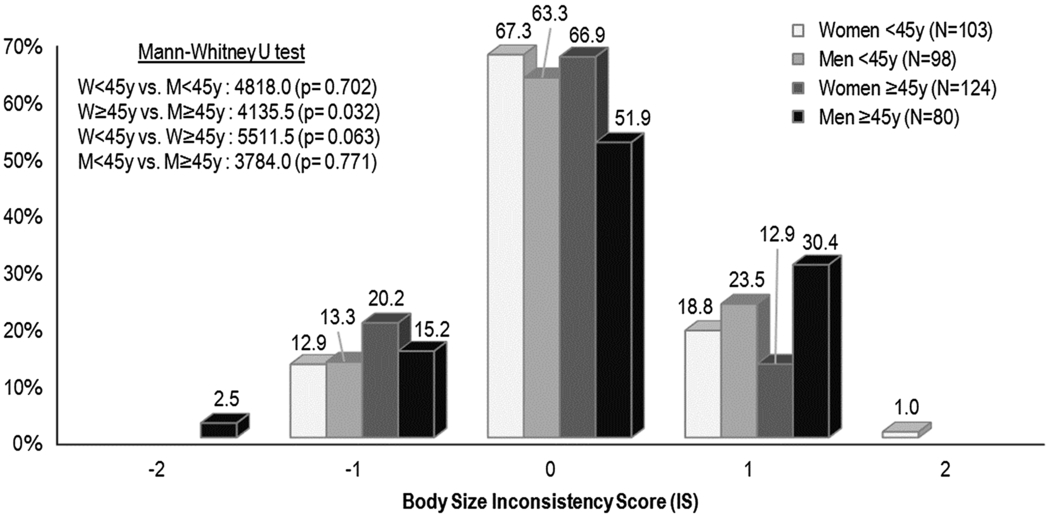
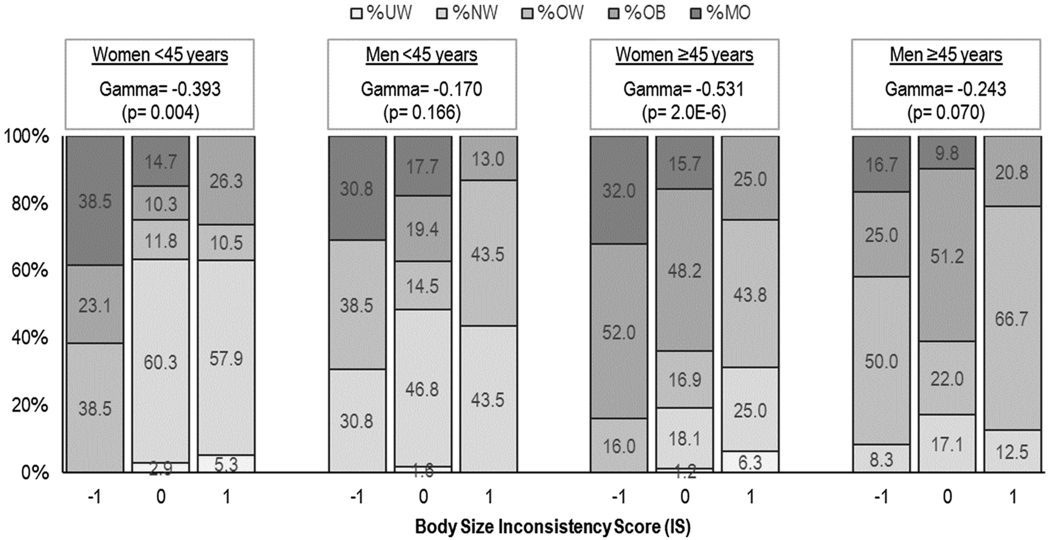
In all groups, more than 50% of participants showed a full consistency (IS=0), reflecting a good perception of their CBI in relation with their actual nutritional status (Fig. 7). With the exception of older women, the other groups showed more inconsistency due to overestimation (IS≥1) than to underestimation (IS≤−1), especially older men (30.4%). Only the older group showed sex differences (p<0.05). No significant age differences were detected, although in the older men group both under- and overestimation were higher compared with the younger one. Significant negative associations between IS and BMI were only observed for women (p<0.01 and p<0.001 in younger and older age groups, respectively; Fig. 8). Women who underestimated their body image were those in the higher nutritional status category, and vice versa.
Percentages of women (W) and men (M) by age group in each body size Inconsistency Score (IS) category. Values of non-parametric U-test are shown.

Percentage of participants in each nutritional category for each body size Inconsistency Score (IS) category by sex and age group. UW: underweight; NW: normal weight; OW: overweight; O: obesity; MO: morbid obesity. Values of Gamma coefficients are shown.

Discussion
Obesity is considered an important nutritional and health problem in many countries, not only due to its associated co-morbidities (cardiovascular diseases, hypertension, Type 2 diabetes, some type of cancers, etc.), but also because of its psychological impact (Onyike et al., Reference Onyike, Crum, Lee, Lyketsos and Eaton2003; Schwartz & Brownell, Reference Schwartz and Brownell2004). Western societies generally consider thinness as an ideal of beauty, and individuals with obesity suffer social rejection and negative judgments. As a result, overweight and obese people tend to have a poor self-image and low self-esteem compared with their peers (Kindes, Reference Kindes2006) and often experience varying degrees of dissatisfaction with their own body image. Body image encompasses perceptions, emotions, cognitions and behaviours towards physical appearance (Muth & Cash, Reference Muth and Cash1997), and plays an important role in the aetiology of overweight and obesity. Therefore, in weight-control practices, any factor of body perception should be considered (Bibiloni et al., Reference Bibiloni, Coll, Pich, Pons and Tur2017). As indicated by Duncan et al. (Reference Duncan, Wolin, Scharoun-Lee, Ding, Warner and Bennett2011) ‘weight misperception among overweight and obese populations is of public health and medical significance and may limit the effectiveness of weight loss and obesity prevention efforts’. Besides, sex and age affect body composition and are therefore of great importance in obesity prevalence. In the studied sample, the effect of sex, and especially of age, on the prevalence of obesity was in agreement with other studies, which have suggested an increase in overweight and obesity with age, mainly in women (Chapman, Reference Chapman2008; Schulze & Stefan, Reference Schulze and Stefan2011).
No sex differences were observed in the silhouette chosen as best representing current body size (CBI), but differences with age were evident. The highest percentages of young women and men chose silhouette number 4, with a mean BMI corresponding to normal weight (men: 23.5 kg/m2; women: 22.3 kg/m2; data not shown). These BMIs are similar to those associated with this silhouette in adults belonging to a large Caucasian population-based sample from 18 to 40 years of age (men: 23.2 kg/m2; women: 22.6 kg/m2), according Bulik et al. (Reference Bulik, Wade, Heath, Martin, Stunkard and Eaves2001). For the older group, silhouettes 5 and 6 were most frequently chosen as representing current body size by women and men, respectively. The mean BMI corresponding to these silhouettes (women: 29.5 kg/m2; men: 30.7 kg/m2) were slightly higher than those established by Bulik et al. (Reference Bulik, Wade, Heath, Martin, Stunkard and Eaves2001) (women: 26.3 kg/m2; men: 28.2 kg/m2). The silhouettes perceived by participants as representing their current size were positively associated with their BMI categories, which means that in both sexes nutritional status is determinant of how a person perceives him- or herself. Several studies have also reported notable correlations between BMI and CBI, with women presenting higher correlations than men (Kaufer-Horwitz et al., Reference Kaufer-Horwitz, Martínez, Goti-Rodríguez and Ávila-Rosas2006; Nagasaka et al., Reference Nagasaka, Tamakoshi, Matsushita, Toyoshima and Yatsuya2008). Differences between age groups for both women and men in CBI could be related to the higher prevalence of overweight and obesity in the older group. Therefore, older populations should be considered a risk group, susceptible to overweight and obesity, and also vulnerable to having high degrees of dissatisfaction with their own image.
The only significant difference for inconsistency score was found between women and men in the oldest age group. In agreement with other studies, older women seem to relate their body image to their own nutritional category better than men (Sánchez-Villegas et al., Reference Sánchez-Villegas, Madrigal, Martínez-González, Kearney, Gibney, de Irala and Martínez2001). According to these authors, men from the European Union are apparently less aware of their body size than women. Additionally, older men seem to be more prone to overestimate their body size in comparison with women of the same age group, who are more prone to underestimate it. These results were discrepant with the observations of Fallon and Rozin (Reference Fallon and Rozin1985), who found that women were more likely to overestimate their weight, whereas men tended to underestimate it. However, although misperception of body image was lower in women ≥45 years, it is important to highlight that in this group IS was associated with BMI. In fact, women with a higher body size tended to underestimate it, which has been proposed as a mechanism of self-esteem protection (Barrett & Huffman, Reference Barrett and Huffman2011). Such an underestimation could also influence people with obesity not to see the need to lose weight and make it difficult to follow up on weight control practices (Duncan et al., Reference Duncan, Wolin, Scharoun-Lee, Ding, Warner and Bennett2011).
Inconsistency scores did not present significant differences between women and men in the younger age group, where a full consistency score was predominant in both sexes (>60%) and overestimation was higher than underestimation. Misperception in the younger group is particularly important in women because, as observed in older women, IS and BMI were associated and a relatively high percentage of normal-weight women overestimated their body size. Regarding age differences, although they were not significant, in women they were close to significance. Several studies have revealed a common pattern of underestimation of weight by women across different cultures (Kirk et al., Reference Kirk, Cockbain and Beazley2008). In the present work, this pattern could be observed in women in the older group but not the younger one.
Only silhouettes 3, 4 and 5 were chosen as the ideal body image (IBI) by more than 10% of participants in all groups, except for younger women, where just silhouettes 3 and 4 were represented with more than 10%. The results are consistent with the work of Rand and Wright (Reference Rand and Wright2000), who also found that mid-range silhouettes were chosen as the ideal image. According to these authors, people seem to be more restrictive selecting ideal body sizes from what could be acceptable based only on a medical perspective. These results seem to reflect the socio-cultural restrictions of beauty, especially in young groups and even more in women, who have always been more susceptible to body image disorders (Ramos-Valverde et al., Reference Ramos-Valverde, Rivera-de-los-Santos and Moreno-Rodríguez2010).
Sexual dimorphism in IBI was observed in both age groups. Silhouettes 3 and 4 were the most chosen silhouettes in women, while 4 and 5 were in men. This indicates that women prefer smaller bodies than men, which is in agreement with many studies (e.g. Barret & Huffman, Reference Barrett and Huffman2011; Bibiloni et al., Reference Bibiloni, Coll, Pich, Pons and Tur2017) and confirms the usually observed conduct in women derived from the socio-cultural pressure that emphasizes a thin ideal for this sex (Morrison et al., Reference Morrison, Kalin and Morrison2004). Stunkard’s silhouettes are unable to distinguish between similar body builds with different compositions of fat mass and fat free mass, so in agreement with Muñoz-Cachón et al. (Reference Muñoz-Cachón, Salces, Arroyo, Ansotegui, Rocandio and Rebato2009), men could probably associate bigger silhouettes with a higher musculature instead of adiposity; therefore, men’s data probably reveal their preferences for more muscular physiques, as an explicit representation of masculinity (Blashill & Wilhelm, Reference Blashill and Wilhelm2014).
In the present study, silhouettes representing slightly larger bodies were more usually chosen by participants in the upper BMI categories than by those in the lower BMI categories, who usually chose silhouettes representing smaller bodies. The association between IBI and BMI has also been observed in other populations. For instance, Naghshizadian et al. (Reference Naghshizadian, Rahnemai-Azar, Kella, Weber, Calin, Bibi and Farkas2014) found that the higher the subject’s BMI, the higher they thought their ideal weight was supposed to be. A possible explanation is that obese individuals, who are aware of their status, choose slightly larger silhouettes as a more realistic goal in their attempt to reduce their obesity.
Although significant sex differences in CBI were not detected in any of the age groups in this study, the image perceived as ideal was clearly different between the sexes, as reflected by the dissatisfaction score. A slight desire to be thinner was predominant in the whole sample, but in agreement with other studies (Mendelson et al., Reference Mendelson, Mendelson and White2001; Ramírez-Molina et al., Reference Ramírez-Molina, Godoy-Izquierdo, Vázquez-Pérez, Lara-Moreno, Navarrón-Vallejo and Vélez-Toral2015; Bibiloni et al., Reference Bibiloni, Coll, Pich, Pons and Tur2017) women were more dissatisfied with their body image than men. Besides, young adults were more satisfied with their bodies that the oldest ones, where a higher level of dissatisfaction by excess was observed. Other authors (see Tiggeman, Reference Tiggemann2004) have also observed that men experience bodily dissatisfaction as they age, although this pattern is not the same in women: older women are more satisfied with their bodies than younger ones (Tiggemann, Reference Tiggemann2004). This could be due to the high frequencies of overweight and obesity observed in the older group, which may lead to a greater degree of dissatisfaction. In fact, in the studied sample, body image dissatisfaction was associated with BMI. In general, fat mass increases with age and this makes older people more susceptible to overweight and obesity, which can increase their dissatisfaction with their body image. In fact, people who are overweight or obese usually report greater body image dissatisfaction than normal weight people (Schwart & Brownell, Reference Schwartz and Brownell2004; Sarwer et al., Reference Sarwer, Thompson and Cash2005). Even though full satisfaction was higher in the younger group compared with the older one, dissatisfaction by excess was also predominant within this group. Dissatisfaction by insufficiency was relatively small in the sample, but in young men it reached a remarkably high percentage (11.2%). The results agree with those observed by Bibiloni et al. (Reference Bibiloni, Coll, Pich, Pons and Tur2017), where younger men had the highest rates of dissatisfaction due to low weight.
Regarding the association between body image dissatisfaction and BMI shown in this sample, lower nutritional categories were predominant at lower DS, whereas higher nutritional categories were prevalent at higher DS. However, more than 50% of normal weight younger women desired smaller bodies, as has been observed in other studies (e.g. Weinberger et al., Reference Weinberger, Kersting, Riedel-Heller and Luck-Sikorski2016). This result seems to confirm the ‘normative discontent’ described by Rodin et al. (Reference Rodin, Silberstein and Striegel-Moore1984) in younger women. For men of both age groups full satisfaction categories showed higher percentages of overweight than women groups of similar age. As previously discussed, this could be related to a preference for muscular bodies in men (Brennan et al., Reference Brennan, Lalonde and Bain2010).
This research has some limitations. First, the relatively small number of participants included in the sample limited the power of the statistical analyses. Secondly, the case-control methodology recruitment may have led to selection bias and loss of generalizability so that it does not allow extrapolation of obesity prevalence rates to the general population; however, the method of recruitment provided a good representation of participants with varying degrees of obesity, including morbid obesity. Additionally, the sample included women and men of a wide age range, and it was highly homogeneous in terms of SES and origin. Third, BMI was used as a measure of nutritional status, but this index is unable to distinguish between fat mass and fat-free mass. However, BMI is broadly used in the adult general population as a criterion of adiposity, and is widely used by the WHO. Besides, the use of direct height and weight measurements to calculate BMI as opposed to self-reported measures increases the accuracy of BMI estimation. Nevertheless, in addition to BMI, other body composition approaches, such as waist perimeter or fat percentage, could be included in future studies. Finally, the results of the present research are population-, setting- and time-specific, and cannot be generalized to other populations. It would be of interest to analyse other samples in order to support the obtained results.
In conclusion, this study has shown that young adults tend to overestimate rather than underestimate their current body size. Misperception was related to nutritional status in women: underestimation was common among participants with high BMI and overestimation in those with lower nutritional status. In men, misperception was not affected by nutritional status but was more frequent in the middle/old adult group than in the younger one. As opposed to current body size perceptions, preferences in body image showed a clear sexual dimorphism: women preferred for themselves slightly smaller body sizes than men, confirming that body image has a sexual pattern. In particular, young women may be considered a high-risk group since a high percentage of normal-weight women wanted thinner bodies. Inter-individual differences in ideal body image were appreciated, associated with the nutritional status of each participant. Women were more dissatisfied by excess than men regardless of age, and young adults were more satisfied with their bodies that the oldest ones, which could be due to their smaller body mass. Dissatisfaction by insufficiency was also observed, especially among young men, who in spite of being normal weight desired greater body sizes, reflecting their preference for muscular bodies. This research confirmed not only the relation between BMI and body size perception and satisfaction in both sexes, but also the relationship between BMI and the reliability with which women are able to classify themselves. In middle-aged men, despite the inconsistency found between their body perception and their actual BMI, this relationship was not as clear.
Author ORCIDs
María Eugenia Ibáñez-Zamacona, 0000-0002-1942-428X
Acknowledgments
The authors are grateful for the collaboration of the staff of the educational and health centres that allowed them to carry out the study. In particular, they thank Dr F. Goñi (Osakidetza) for his invaluable help.
Funding
This research received support from the Spanish Ministry of Science and Innovation (GCL2010-15511) and from the University of the Basque Country (pre-doctoral grant PIF09049, for M.E.I-Z).
Conflicts of Interest
The authors have no conflicts of interest to declare.
Ethical Approval
The authors assert that all procedures contributing to this work comply with the ethical standards of the relevant national and institutional committees on human experimentation and with the Helsinki Declaration of 1975, as revised in 2008.