Introduction
Agate refers to a banded variety of transparent and translucent chalcedony, valued as a gemstone since the Roman Empire due to its diverse colours, shapes and textures (Götze et al., Reference Götze, Möckel and Pan2020; Karampelas et al., Reference Karampelas, Kiefert, Bersani and Vandenabeele2020). The term ‘agate’ originates from the River Drillo (previously known as Achates) in Sicily, Italy (Powolny et al., Reference Powolny, Dumańska-Słowik, Sikorska-Jaworowska and Wójcik-Bania2019). Prominent silica minerals associated with agate include moganite, α-quartz, cristobalite and tridymite, which form under moderate to high temperatures (90–1470°C) (Herdianita et al., Reference Herdianita, Browne, Rodgers and Campbell2000; Pretola, Reference Pretola2001; Heaney et al., Reference Heaney, McKeown and Post2007; Ostrooumov, Reference Ostrooumov2007). According to Heaney et al. (Reference Heaney, McKeown and Post2007), macrocrystalline silica is generally understood to form through the assembly of layered molecular structures within microcrystalline agate minerals, indicating a crystalline growth from more ordered molecular arrangements. In contrast, chalcedony, a form of microcrystalline quartz, develops from a silicic colloidal solution, suggesting a different formation pathway involving the gradual organisation of silica particles suspended in a gel-like medium. This distinction highlights the contrasting crystallisation processes between the two silica types. Fibrous chalcedony and microcrystalline quartz are commonly intergrown or intercalated within the chalcedony layers of agate (Götze et al., Reference Götze, Nasdala, Kleeberg and Wenzel1998; Moxon and Ríos, Reference Moxon and Rios2004). Agate typically contains minor amounts of impurities and water (<2%) (Moxon and Ríos, Reference Moxon and Rios2004). Its characteristic banding arises from the influx of separate siliceous fluids into cavities, creating variations in silica crystallinity within a geode (Conte et al., Reference Conte, Della Ventura, Rondeau, Romani, Cestelli, La, Napoleoni and Lucci2022). Different cryptocrystalline textures have been identified in silica, such as radial length-fast and fibrous chalcedony (with the c axis situated perpendicular to the fibres), and quartzine with length-slow chalcedony (α-quartz) including c axis situated parallel to the fibres (Frondel, Reference Frondel1978; Keene, Reference Keene1983; Flörke et al., Reference Flörke, Flörke and Giese1984; Rodgers and Cressey, Reference Rodgers and Cressey2001). Agates occur in diverse geological settings, including sedimentary and volcanic rocks, and may form through both syn-genetic and epigenetic processes (Götze et al., Reference Götze, Möckel, Vennemann and Müller2016). Primary agates are associated with silica-rich volcanic rocks such as rhyodacite and rhyolite or silica-poor rocks such as basalt and andesite and dacite. In silica-rich volcanic units, agates form as spheroidal aggregates (lithophysae) within the rock matrix, whereas silica-poor volcanic units host agates in cavities (Götze et al., Reference Götze, Möckel, Vennemann and Müller2016). Secondary inclusions such as clay minerals, calcite, zeolite and Fe- and Mn-oxides often account for colour variations in agates (Parali et al., Reference Parali, Guinea, Kibar, Cetin and Can2011). This study aims to investigate the mineralogical, geochemical and isotopic characteristics of agates and chalcedony from eastern Iran, identifying their formation processes, trace-element influences and spectroscopic properties. Advanced analytical techniques are utilised to determine the role of hydrothermal fluids, host rock interactions and mineral inclusions in chalcedony genesis and colouration.
Geological setting
Geological background
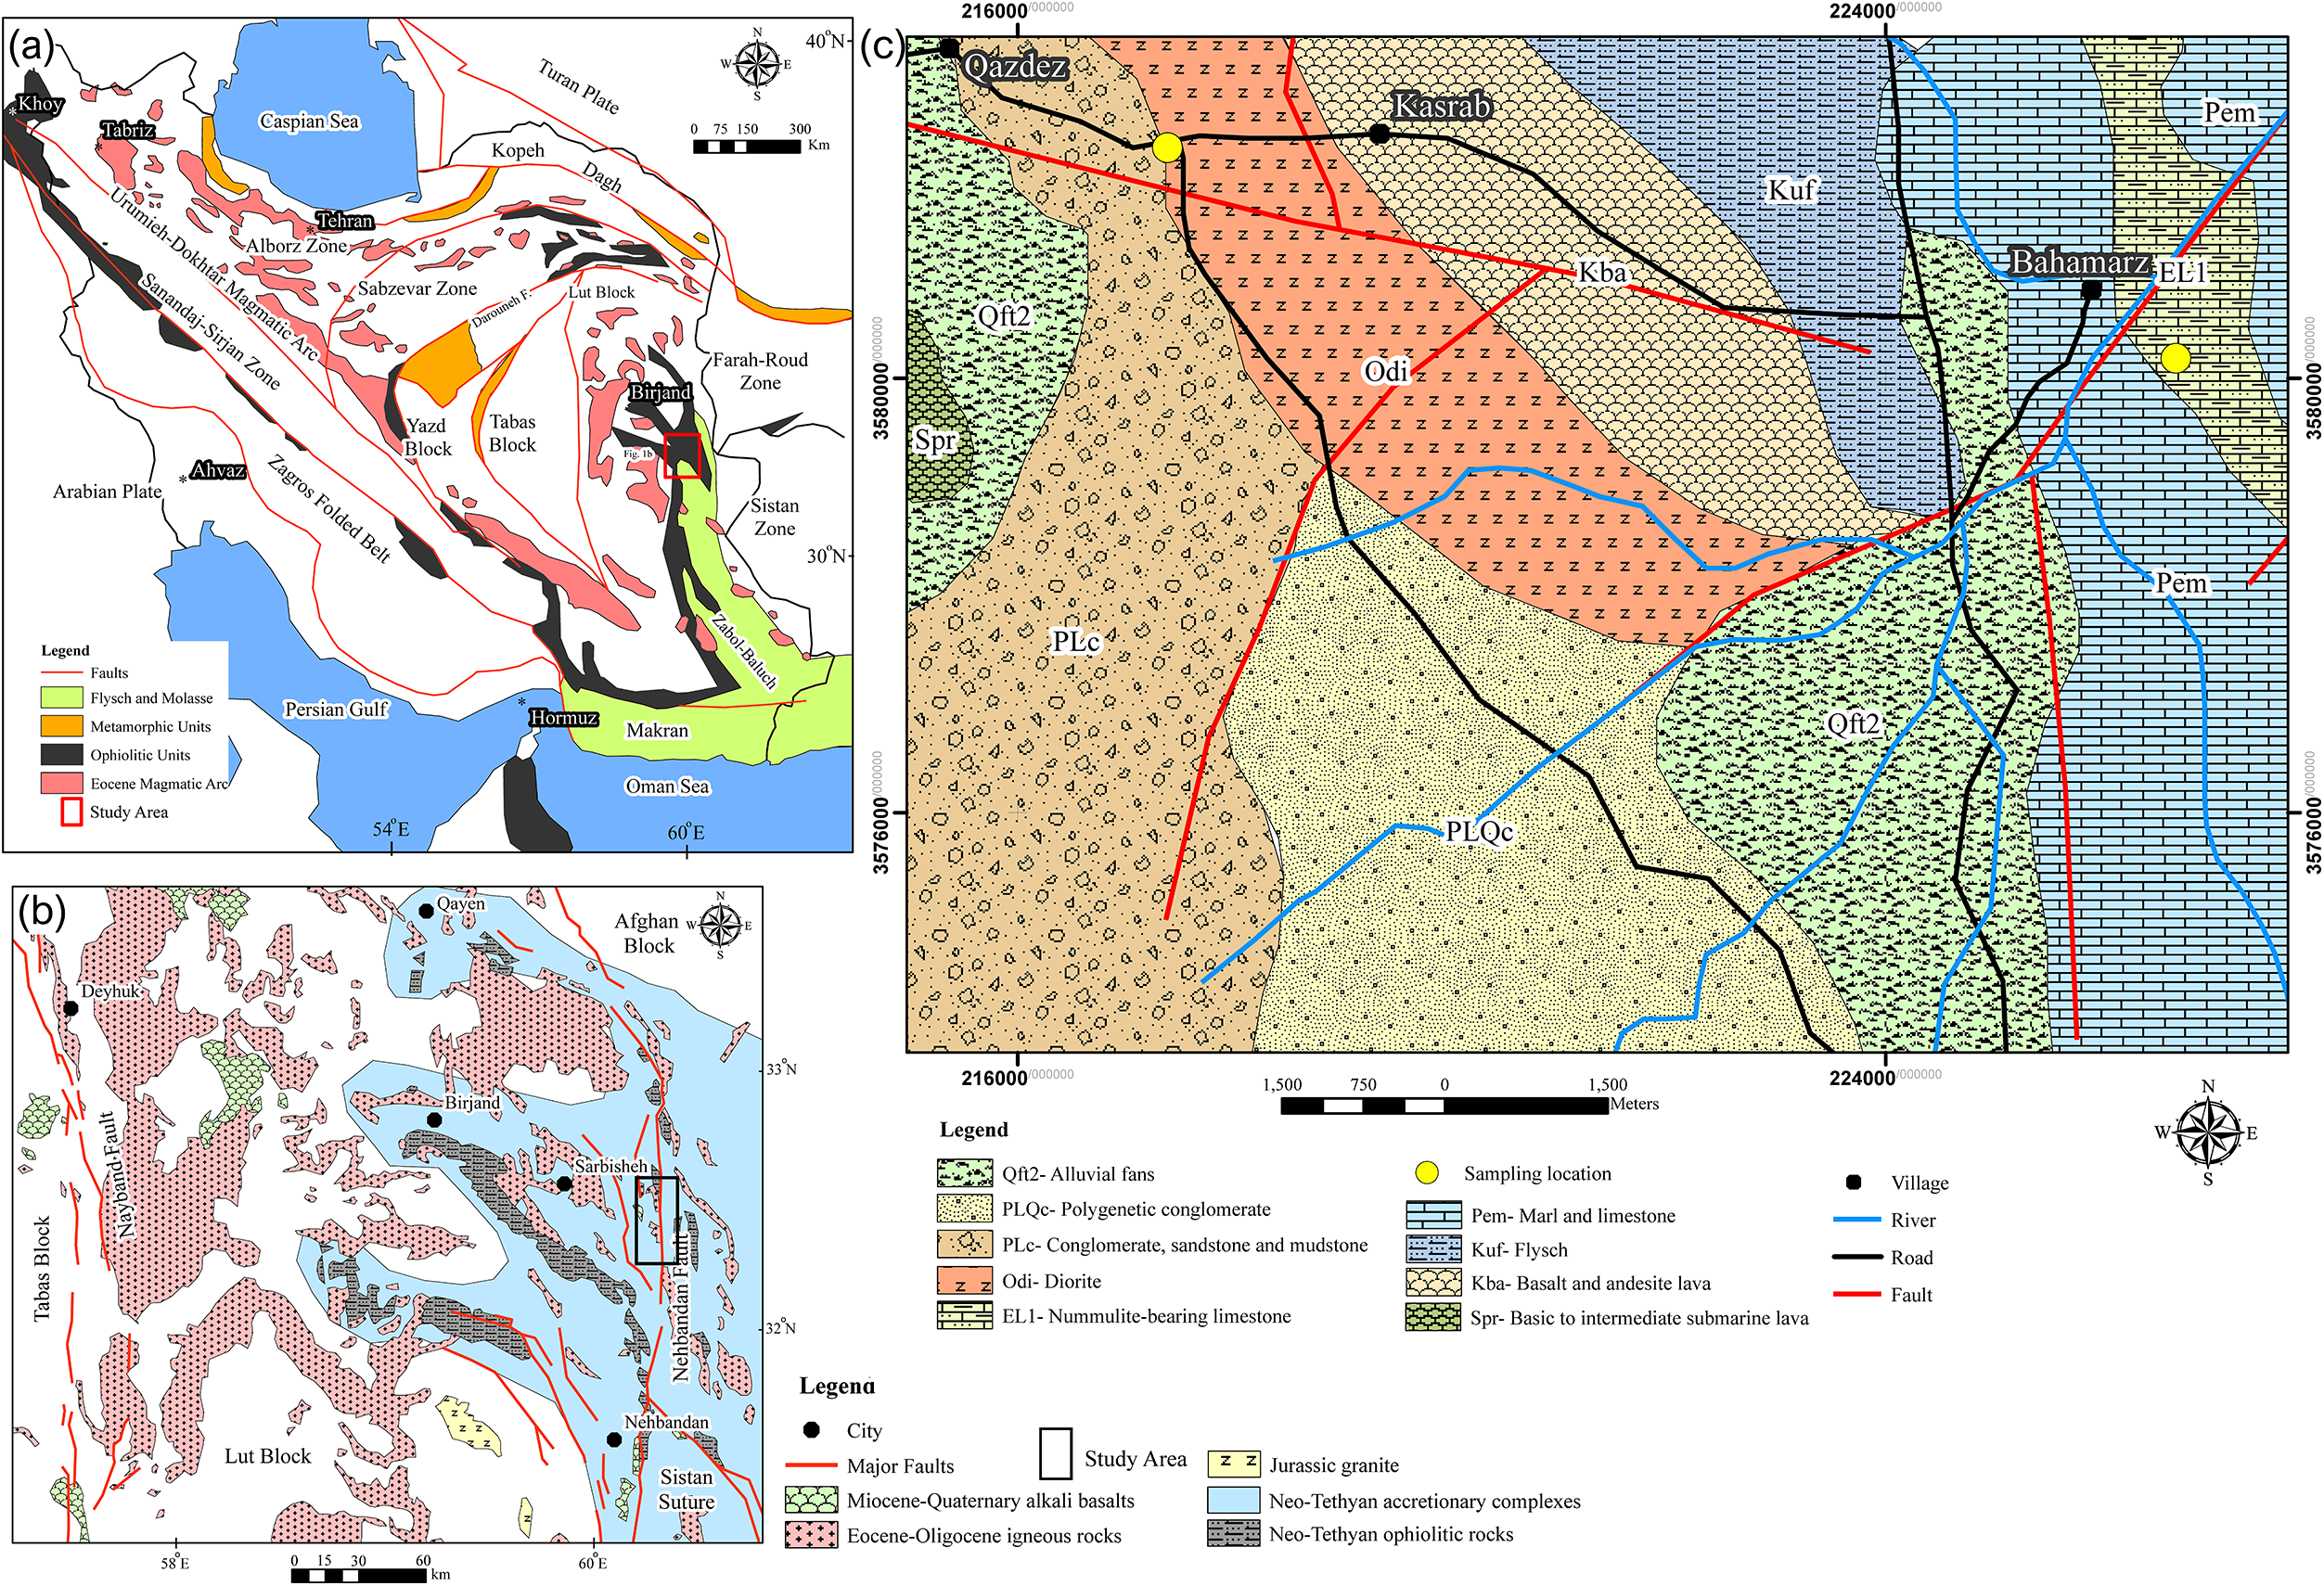
Iran is located in the central part of the Alpine-Himalayan Orogenic Belt, a major tectonic feature extending over 15,000 km from western Europe through Anatolia to Iran and Tibet. This orogenic belt records the progressive closure of the Neo-Tethys Ocean during the Mesozoic–Cenozoic eras (Ghorbani, Reference Ghorbani2013). The earlier Palaeo-Tethys Ocean, which existed between the Eurasian and Central Iranian plates from the Late Cambrian to Early Ordovician, was closed by the Late Triassic, contributing to the formation of the Alborz Mountains. Rifting along the northern margin of the Arabian Plate during the Late Permian initiated the opening of the Neo-Tethys Ocean between the Arabian margin and the Iranian microcontinent (Fig. 1a). The subsequent complex collisional processes during the Neo-Tethyan evolution resulted in the formation of several lithospheric plates and microcontinental blocks. Kazemi et al. (Reference Kazemi, Kananian, Xiao and Sarjoughian2018) estimated that the final closure of the Neo-Tethys occurred between the Cretaceous and Miocene periods. Based on the tectonic evolution of these basins, Iran’s geostructural zones have been classified as follows (Alavi, Reference Alavi1991; Aghanabati, Reference Aghanabati2005): Azerbaijan, Alborz, Zagros, Sanandaj–Sirjan, Central Iran, Eastern Iran, Kopeh Dagh, southeastern Iran (Makran).
(a) Geological and structural map of Iran (modified after Şengör, Reference Şengör1987; Alavi, Reference Alavi1996; Bagheri and Stampfli, Reference Bagheri and Stampfli2008; Samiee et al., Reference Samiee, Karimpour, Ghaderi, Haidarian Shahri, Kloetzli and Santos2016). (b) Geological map of Lub block and Sistan zone (modified after Pang et al., Reference Pang, Chung, Zarrinkoub, Mohammadi, Yang, Chu, Lee and Lo2012; Javidi Moghaddam et al., Reference Javidi Moghaddam, Karimpour, Malekzadeh Shafaroudi, Santos and Mendes2019). (c) Geological map of the Qazdez-Bahamarz area.

The two oldest and most prominent magmatic zones are the Lut Block in eastern Central Iran and the Urumieh–Dokhtar Magmatic Belt (UDMB). The Lut Block extends ∼900 km in length and 200 km in width along a north–south orientation. It is bounded by the Doruneh Fault to the north and the Jazmourian Basin to the south (Karimpour et al., Reference Karimpour, Stern, Farmer and Saadat2011). According to Golonka (Reference Golonka2004), the Lut Block was originally part of Gondwanaland and separated from its northern margin during the opening of the Neo-Tethys Ocean in the Permian. It subsequently accreted to the Eurasian plate during the Paleo-Tethyan collisional events in the Triassic. The Sistan orogenic zone, which separates the Afghan and Lut Blocks, contains well-preserved Mesozoic ophiolites formed under high-pressure, low-temperature conditions (Bröcker et al., Reference Bröcker, Fotoohi Rad, Burgess, Theunissen, Paderin, Rodionov and Salimi2013; Angiboust et al., Reference Angiboust, Agard, De Hoog, Omrani and Plunder2013). These ophiolitic units have been estimated as ∼106.9 ± 1.1 Ma using U–Pb zircon radiometric age determination (Zarrinkoub et al., Reference Zarrinkoub, Pang, Chung, Khatib, Mohammadi, Chiu and Lee2012), although Ozsvárt et al. (Reference Ozsvárt, Bahramnejad, Bagheri and Sharifi2020) reported an older age of ∼120 Ma for associated cherts. Magmatism in the Lut Block occurred predominantly between the Middle Eocene and Early Oligocene (Karimpour et al., Reference Karimpour, Malekzadeh Shafaroudi, Stern and Farmer2012), producing volcanic rocks such as andesite, basalt, rhyolite and dacite, along with occasional granodioritic intrusions between 59 and 24 Ma (Abdi and Karimpour, Reference Abdi and Karimpour2013; Delavari et al., Reference Delavari, Amini, Schmitt, McKeegan and Harrison2014; Arjmandzadeh and Santos, Reference Arjmandzadeh and Santos2014). This magmatic activity is attributed to subduction along an active westward-dipping slab beneath Iran (Beydokhti et al., Reference Beydokhti, Karimpour, Mazaheri, Santos and Klötzli2015). Omidianfar et al. (Reference Omidianfar, Monsef, Rahgoshay, Zheng and Cousens2020) proposed that lithospheric root delamination and asthenospheric upwelling led to partial mantle melting, which triggered this magmatism during collisional tectonics. Sedimentary records, such as the Senonian flysch sequences (89–66 Ma), suggest the existence of a rapidly subsiding forearc or back-arc basin near the subduction zone (Tirrul et al., Reference Tirrul, Bell, Griffis and Camp1983). During the Miocene to Pliocene, alkali basaltic magmas were extruded along major fault zones, probably as a result of partial melting of the ascending asthenosphere (Pang et al., Reference Pang, Chung, Zarrinkoub, Mohammadi, Yang, Chu, Lee and Lo2012).
Local Geology
The Qazdez-Bahamarz prospect area is situated 40 km southeast of Sarbisheh city in eastern Iran (Fig. 1b), within the central region of the Lut Block. It is located between the coordinates 59°59’00”–60°04’10” E and 32°19’15”–32°17’13” N. The oldest rock unit in the western portion of the area consists of mafic to intermediate submarine flows, which are predominantly covered by recent alluvial fans (Fig. 1c). Basaltic and andesitic flows dominate the central section of the region. These flows are overlain by thick flysch deposits, indicative of an actively subsiding basin probably associated with a nearby subduction zone (Tirrul et al., Reference Tirrul, Bell, Griffis and Camp1983). Above the flysch unit lies a sequence of marl and nummulite-rich limestone, which predates the emplacement of an Upper Eocene–Oligocene dioritic intrusive body (Abdi and Karimpour, Reference Abdi and Karimpour2013; Pang et al., Reference Pang, Chung, Zarrinkoub, Khatib, Mohammadi, Chiu, Chu, Lee and Lo2013; Delavari et al., Reference Delavari, Amini, Schmitt, McKeegan and Harrison2014). This dioritic intrusion appears as stocks and dykes intruding pyroclastic rocks, subsequently covered by more recent deposits of conglomerates, sandstones and alluvial fans. The Bahamarz Fault, the oldest tectonic structure in the area, is a sinistral strike-slip fault with a north–south orientation, branching towards the east (Fig. 1c).
Mineralisation of chalcedony in the study area
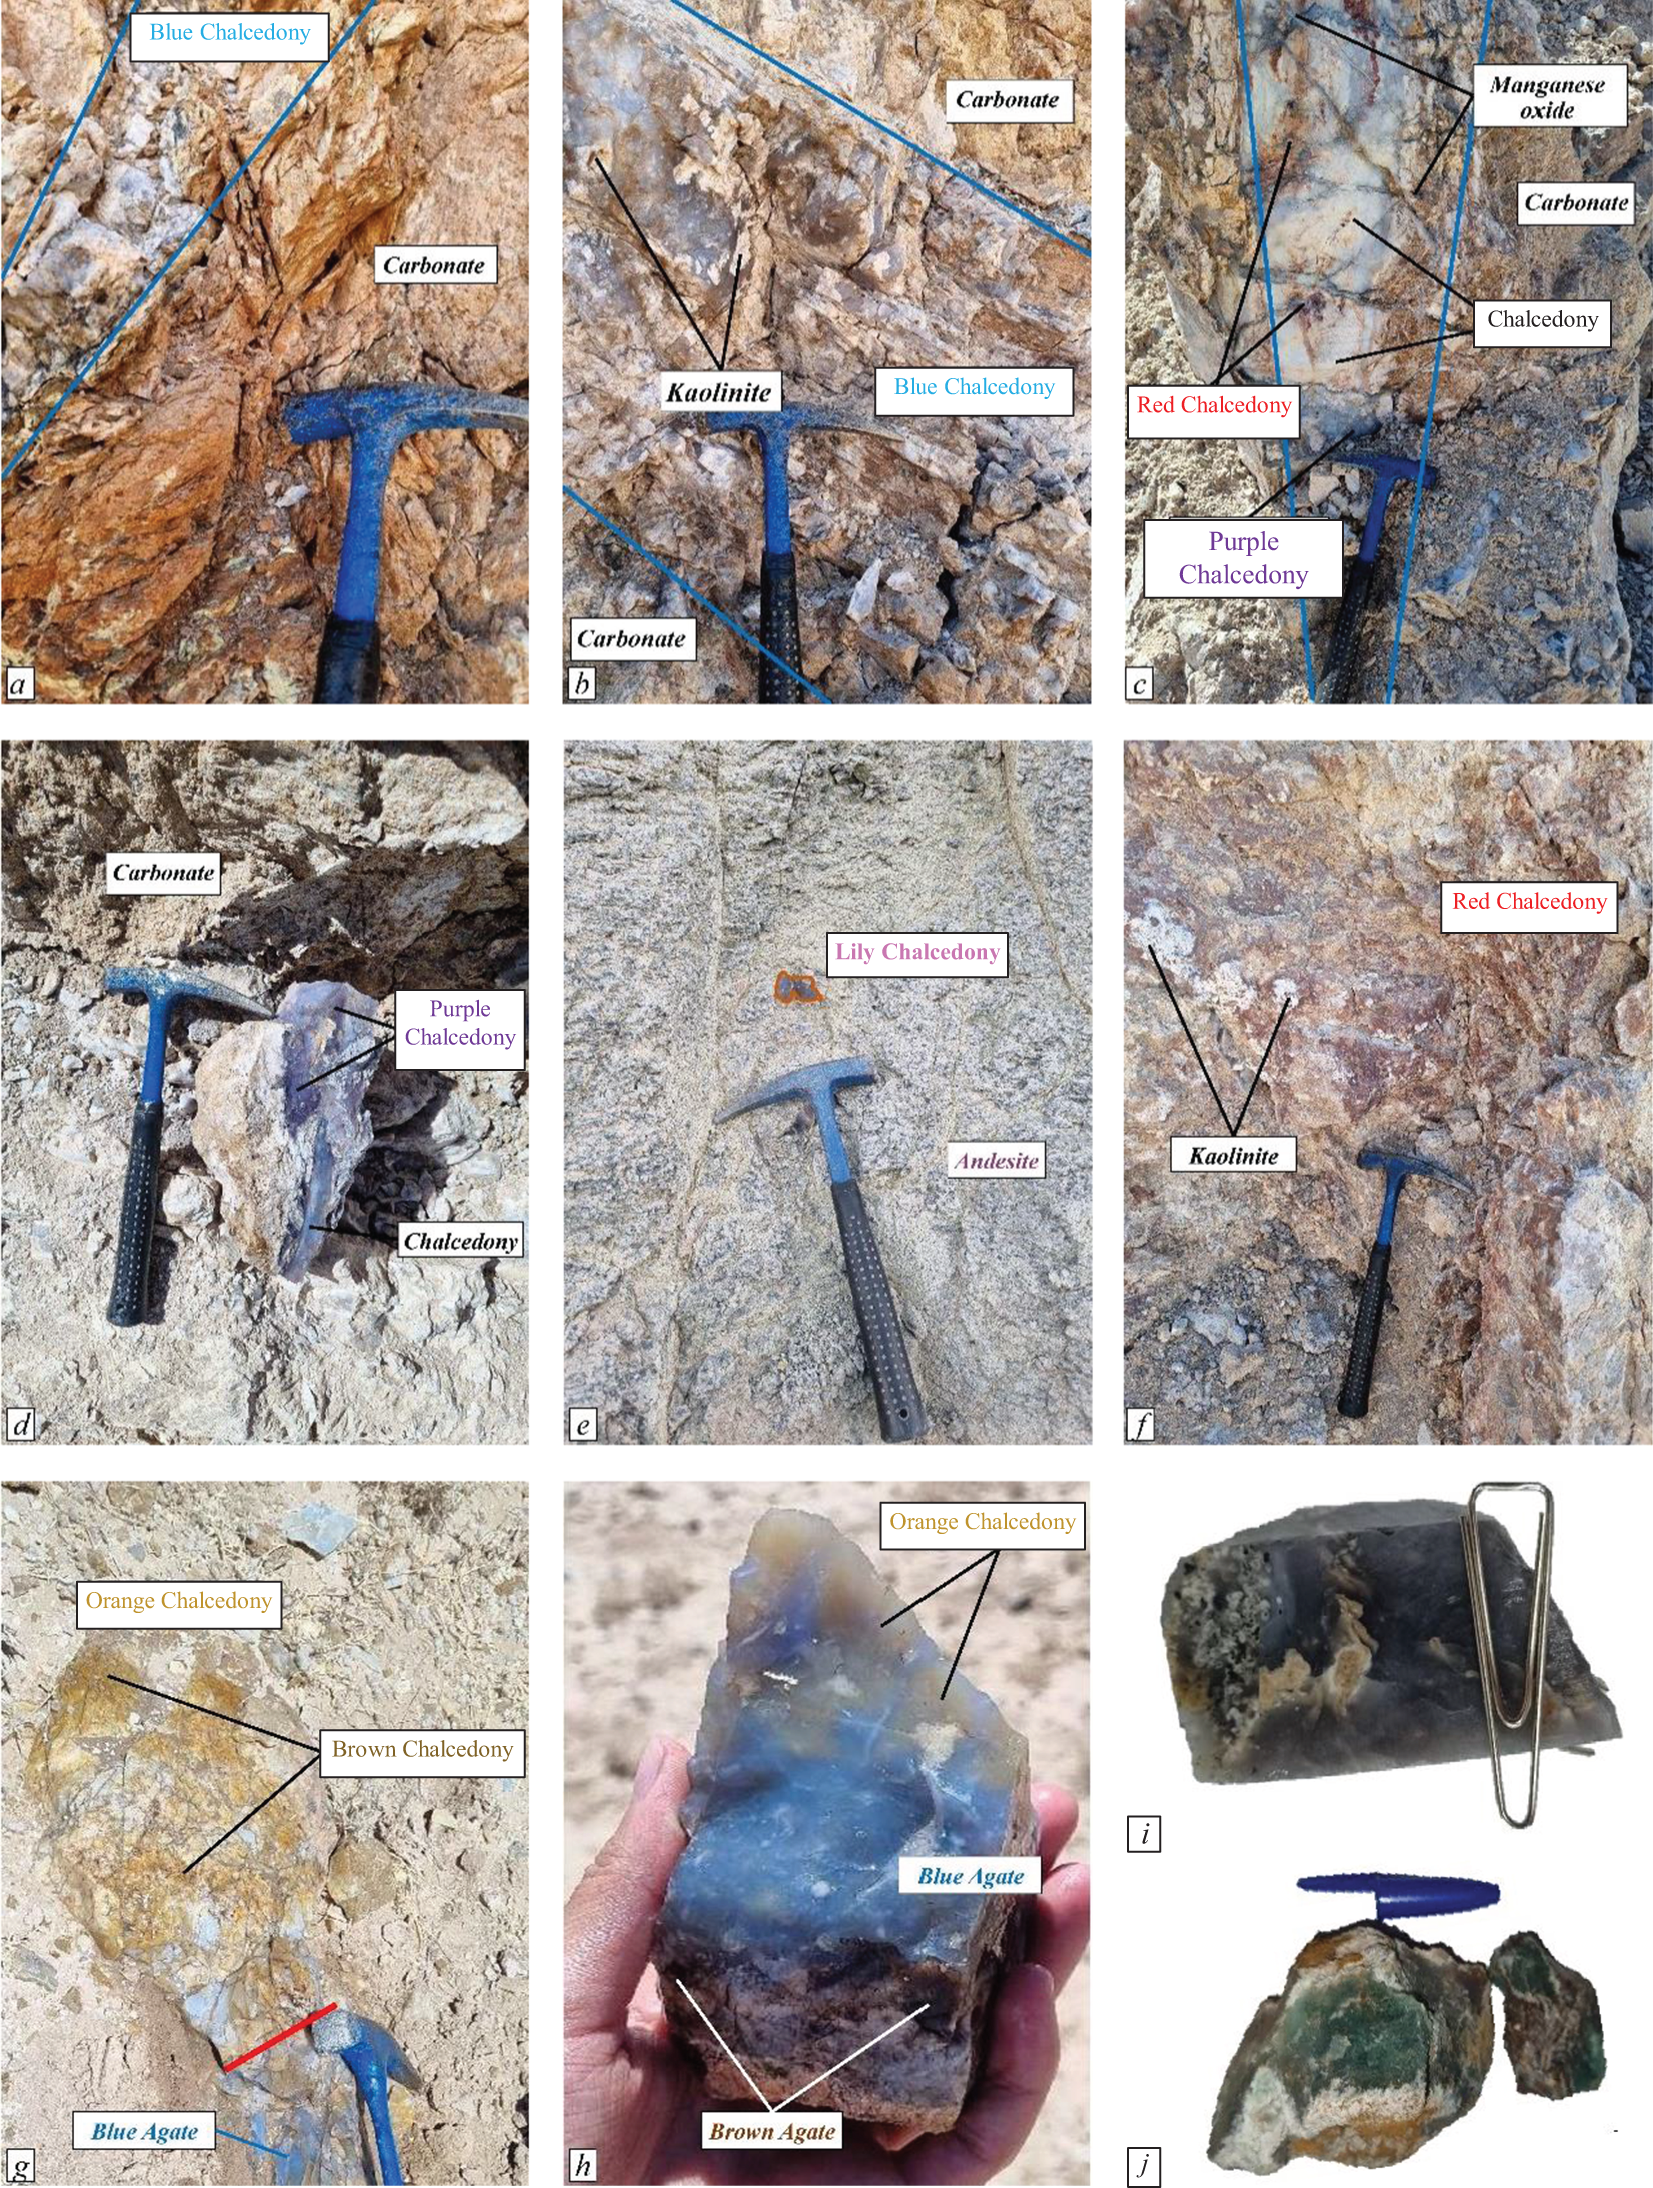
In the Qazdez-Bahamarz area, chalcedony and agate formed during late-stage hydrothermal activity within volcanic and carbonate host rocks (Fig. 2). The samples display a wide range of colours, including blue, grey, purple, red, lavender, brown, orange, black and green chalcedony. The most common occurrence is cross-cutting veins and veinlets associated with open-space-filling structures in volcanic rocks. High-quality, pure blue chalcedony veins and veinlets, typically <30 cm thick, are the dominant form of chalcedony mineralisation in the area and are commonly accompanied by carbonate in host rocks (Fig. 2a). Low-quality, blue chalcedony veins, thicker than their high-quality counterparts, often contain kaolinite, indicating the influence of more acidic fluids during the mineralisation process (Fig. 2b). Grey chalcedony associated with manganese oxide, red chalcedony and purple chalcedony occurs in veins up to 50 cm thick (Fig. 2c). Purple chalcedony, one of the rarest silica varieties, was identified in the footwall of a strike-slip fault, in veins up to 20 m long and 20–65 cm thick (Fig. 2d). Lavender chalcedony samples with aragonite and calcite inclusions, found in the volcanic host rocks, exhibit vesicular and open-space-filling structures, suggesting an epigenetic formation process within volcanic units (Fig. 2e). Red chalcedony samples are distributed widely across outcrops and are commonly associated with kaolinite (Fig. 2c,f). Orange and brown chalcedony samples are primarily found alongside blue chalcedony in the Bahamarz area. Though similar in appearance, brown chalcedony has a darker tone compared to orange chalcedony (Fig. 2g,h). Black chalcedony samples, characterised by clay mineral inclusions (mainly kaolinite), were formed in several fault-controlled veins >2 m thick (Fig. 2i). Green chalcedony, the rarest and most valuable variety in the Qazdez-Bahamarz area, is found in the Bahamarz section of the study area (Fig. 2j).
Field images depicting chalcedony mineralisation in the Qazdez-Bahamarz Region: (a) a blue chalcedony veinlet within carbonate host rock; (b) kaolinite embedded in a chalcedony vein; (c) grey and purple chalcedony accompanied by red chalcedony interlayers within a veinlet in the carbonate host rock; (d) purple chalcedony exhibiting a vein-veinlet structure; (e) lens-shaped lavender (‘lily’) chalcedony found in volcanic units; (f) kaolinite lens interlayers associated with red chalcedony; (g) a gradual transition from blue to brown and orange chalcedony; (h) orange chalcedony interlayers within blue chalcedony; (i) black chalcedony with kaolinite inclusions; (j) green chalcedony specimens.

Material and methods
During a two-month field exploration in September 2023, 72 chalcedony samples were collected from two primary mineralisation sites in the Qazdez-Bahamarz area. For petrographic and textural analysis, 21 thin sections of chalcedony samples and six from host rocks were prepared. These were studied under a transmitted-light microscope (Olympus BX60) with a Nikon-DXM–1200 digital camera at the Department of Earth Science, University of Tabriz, Iran.
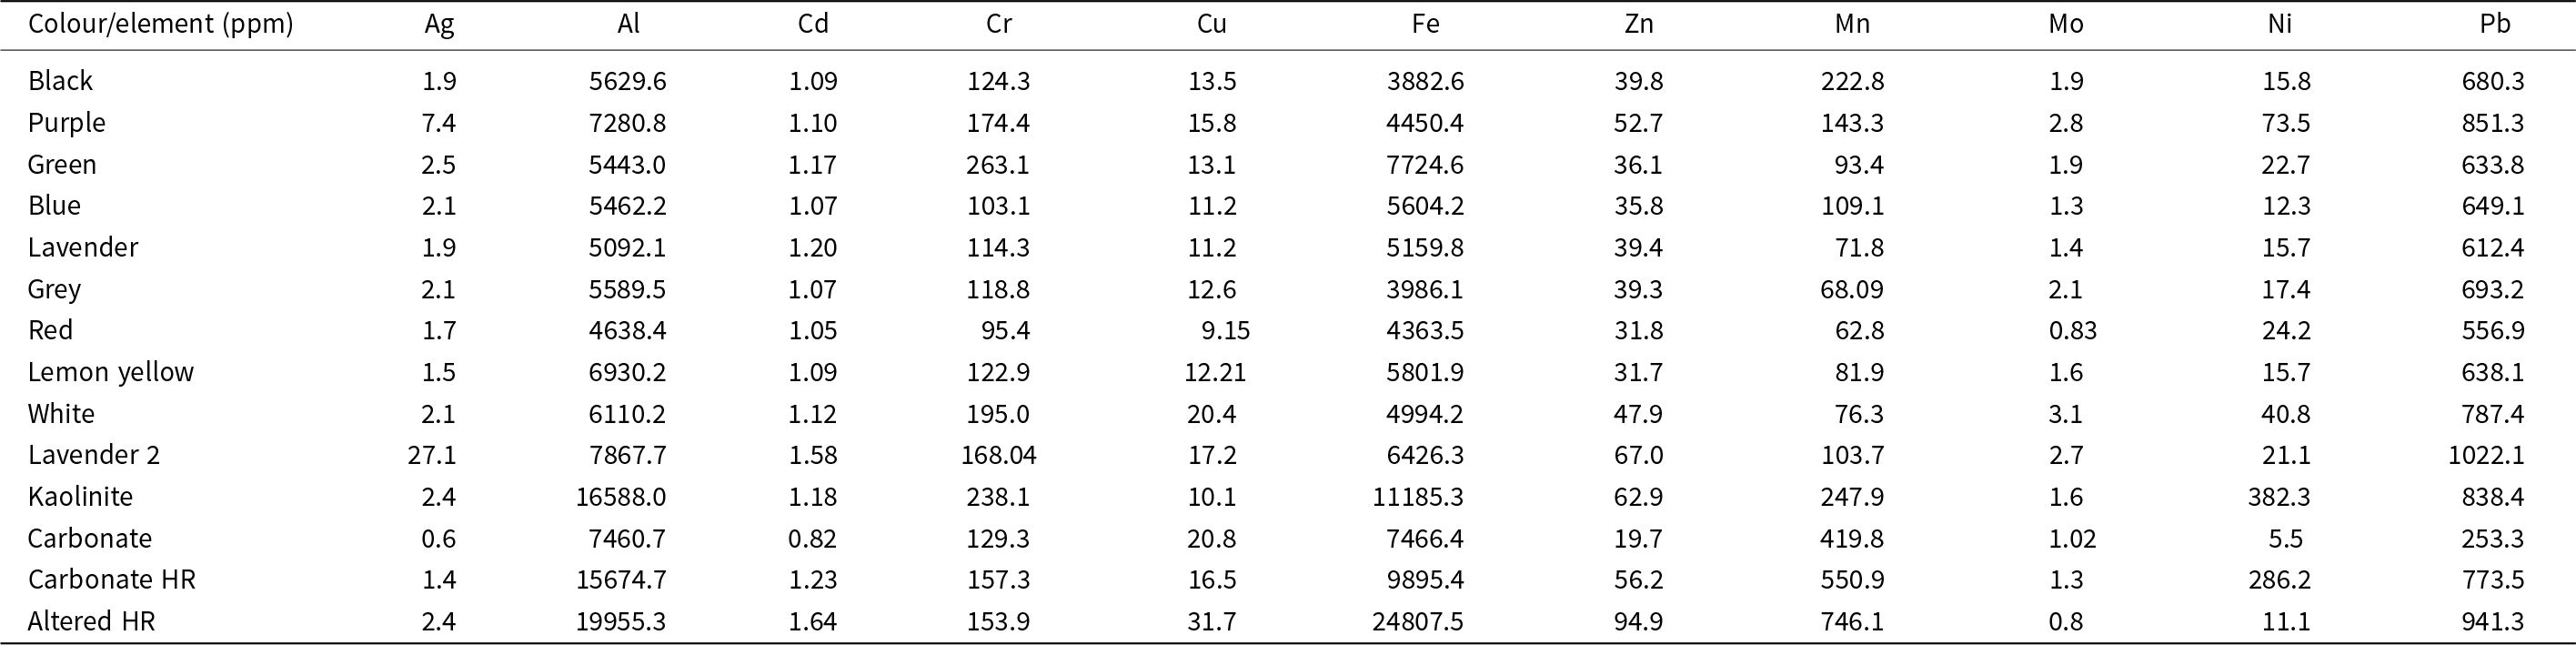
Trace-element analysis was conducted on 14 samples, including agate, chalcedony and altered and fresh host rocks, using inductively coupled plasma optical emission spectroscopy (ICP-OES; PG Instruments, model ICP 5000 DV), at the Central Laboratory, University of Tabriz (analytical results shown in Table 1). The kaolinite is separated from adjacent veins of purple chalcedony and carbonate is separated from adjacent veinlets of blue chalcedony samples. Carbonate host rock (Carbonate HR) and altered host rock (Altered HR) in Table 1 refer to volcanic host rocks (dacite and andesite) with carbonate alteration and slightly propylitic alteration, respectively. For ICP-OES analysis, samples were first crushed and pulverised to <75 μm. Approximately 0.1–0.2 g of each sample was digested using a HF-HNO₃-HClO₄ acid mixture in Teflon vessels. The solutions were heated at 120–140°C to ensure complete dissolution of silicates. After evaporation, residues were re-dissolved in 2% HNO₃ and diluted for analysis. Elemental concentrations were measured using ICP-OES, with calibration standards and certified reference materials ensuring accuracy. These data were used to interpret geochemical interactions between chalcedony and host rocks.
Trace-element concentrations in chalcedony and host-rock samples from the Qazdez-Bahamarz area

Stable isotope analyses of carbon (δ13C) and oxygen (δ1⁸O) were conducted on both carbonate phases intergrown with agate and chalcedony, as well as on the silicate (cryptocrystalline quartz) phases. The kaolinite was separated from the adjacent veins and veinlets of purple chalcedony, and the carbonate was separated from the adjacent veins and veinlets of blue chalcedony samples. All measurements were performed at the Queen’s Facility for Isotope Research (QFIR), Queen’s University, Canada.
To determine the δ13C and δ1⁸O values of carbonate minerals (mainly calcite), ∼1 mg of powdered sample was weighed precisely and placed in reaction vessels. Each sample was then reacted with anhydrous phosphoric acid (H₃PO₄, ≥99.999% purity) under vacuum conditions at 72°C for 4 h. The evolved CO₂ was cryogenically purified and introduced into a Thermo-Finnigan DeltaPlusXP continuous-flow isotope ratio mass spectrometer (CF-IRMS). The isotope ratios were calibrated using international standards e.g. NBS-19, NBS-18 (Crowley, Reference Crowley2010), and the results were expressed in per mil (‰) relative to the Vienna Pee Dee Belemnite (VPDB) standard. The analytical precision was ±0.2‰ for both δ13C and δ1⁸O values, based on repeated measurements of standards and replicate samples.
For oxygen isotope analyses of the silicate portion (agate and chalcedony), carbonate contamination was first removed by treating the powdered samples with 0.1 M acetic acid (CH₃COOH). Samples were then rinsed multiple times with ultra-pure deionised water and dried in an oven at 60°C. Following pretreatment, oxygen was extracted from the silicate matrix using the BrF₅ fluorination technique, according to the method of Clayton and Mayeda (Reference Clayton and Mayeda1963). In this method, 10–15 mg of powdered sample was reacted with bromine pentafluoride (BrF₅) at 550–600°C in a vacuum-sealed nickel reaction vessel. The liberated oxygen (as O₂) was then purified via cryogenic trapping and converted to CO₂ using a hot graphite rod for analysis.
Isotope measurements were again conducted on the Thermo-Finnigan DeltaPlusXP IRMS, and δ1⁸O values were reported relative to Vienna Standard Mean Ocean Water (VSMOW). The analytical precision for oxygen isotope measurements of silicates was better than ±0.4‰, based on multiple runs of internal and international quartz standards.
Raman spectroscopy was carried out using an Andor Technology Uni-Dron-A instrument with a 532 nm laser and a Peltier-cooled CCD detector at the Central Laboratory, University of Tabriz. Ten unpolished agate and chalcedony samples were analysed, focusing the laser on a 0.9 µm2 area using a 40 LWD objective lens.
Field Emission Scanning Electron Microscopy (FE-SEM) imaging was performed with a Tescan/MIRA3 SEM-FE equipped with an EDS (Energy Dispersive Spectroscopy mapping) detector, capturing images at magnifications up to 50,000× and a resolution of 1 nm. Nano-photography of nine fresh agate and chalcedony samples produced 18 high-resolution images at the Central Laboratory, University of Tabriz.
X-ray diffraction (XRD) analysis of agate and chalcedony was performed using a Tongda/TD–3700 XRD with CuKα radiation (λ = 1.5406 Å). Scans were conducted at 5–80°2θ with a step size of 0.03° and 5 s per step. Data were processed using RayfleX software and refined using Autoquan V. 3.11 (Seifert, XRD Eigenmann GmbH, Germany).
Electron paramagnetic resonance (EPR) analysis of ten agate samples and three additional samples (kaolinite, carbonate and fresh host rock) was conducted using a Bruker EMX spectrometer at the Saskatchewan Structural Sciences Centre, University of Saskatchewan, Canada. Measurements were taken at ∼9.87 GHz microwave frequency, 100 kHz modulation frequency, and magnetic field ranges of 100–700 mT and 320–380 mT, with a resolution of 0.01 mT.
Results
Petrography and textures
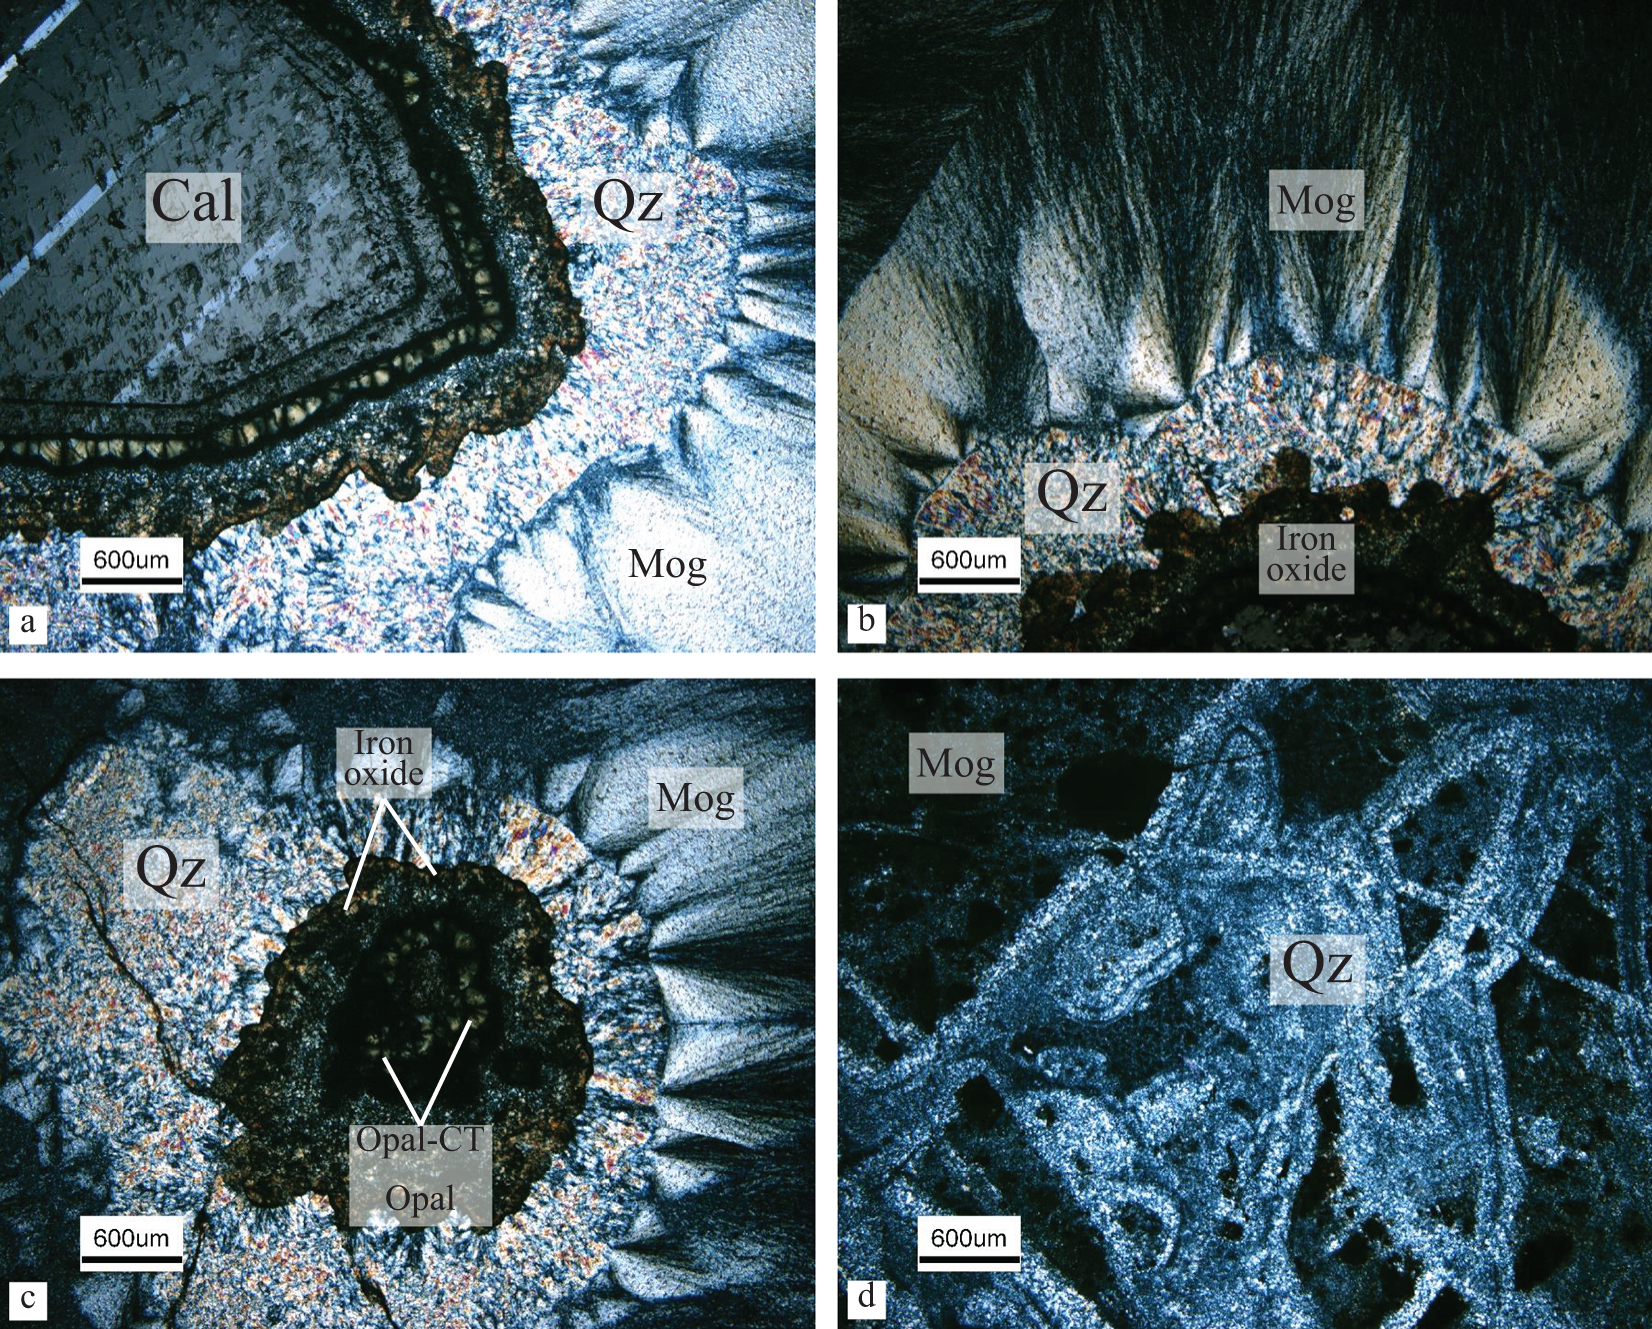
Both the agate and chalcedony samples exhibit fibrous, spherical and coarse-grained quartz crystals with cryptocrystalline or microcrystalline textures (Fig. 3). The inner part consists of coarse-grained calcite with twining, surrounded by microgranular quartz with negative elongation (Fig. 3a), and then by fibrous chalcedony and spherical moganite cryptocrystals with positive elongation (Fig. 3b). Some microcrystalline quartz aggregates, associated with opal-CT (cristobalite and tridymite) and opal-C (cristobalite) (Pretola, Reference Pretola2001), representing cryptocrystalline and pseudo-crystalline textures which are commonly stained with iron oxide (Fig. 3c). Moganite is also prevalent within the matrix of quartz-bearing veins and veinlets (Fig. 3d).
Photomicrographs of chalcedony from the Qazdez-Bahamarz area: (a) a calcite crystal surrounded by microcrystalline quartz and cryptocrystalline moganite; (b) a chalcedony sample containing iron oxide, encircled by quartz and moganite; (c) opal-CT in the central part of chalcedony, showing banding of opal, quartz and moganite from the centre to the margin; (d) various microcrystalline quartz veinlets in a red chalcedony sample (abbreviations from Warr, Reference Warr2021).

Trace elements
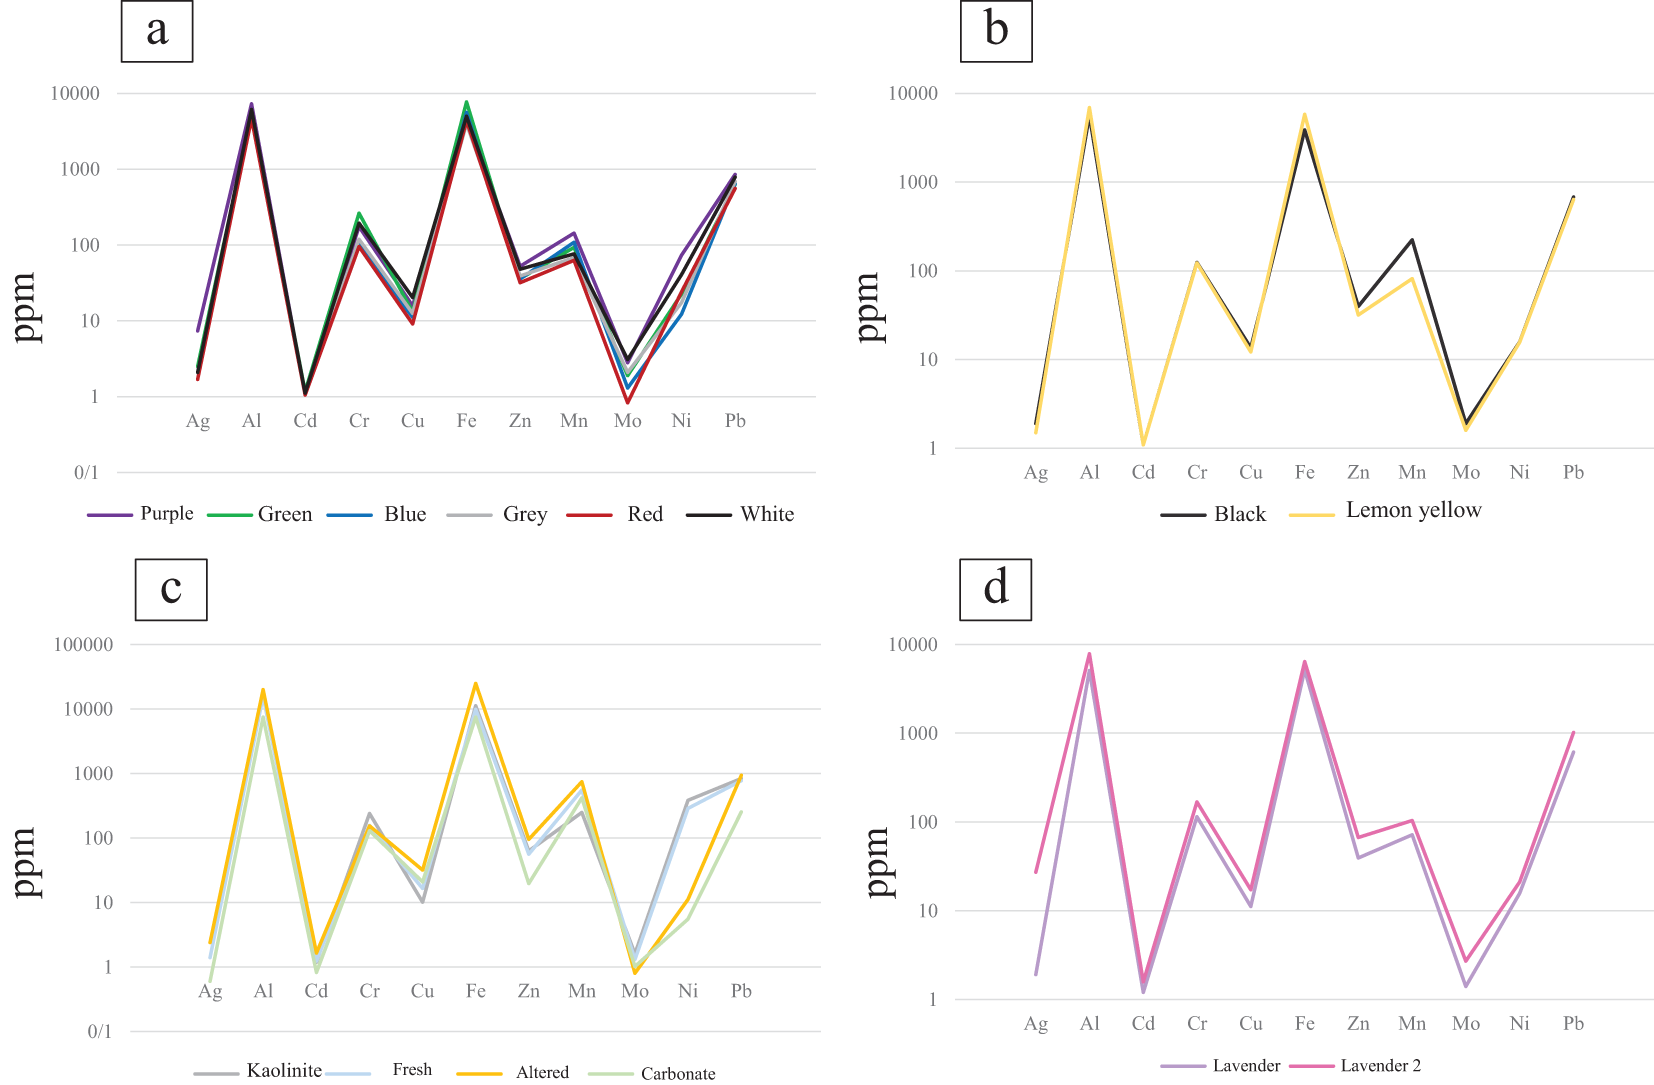
The trace-element geochemical data for agate, chalcedony, and both fresh and altered volcanic and carbonate host rocks are summarised in Table 1 and Fig. 4. The analyses revealed notable variations in the concentrations of several trace elements, particularly those associated with colour formation, such as Cr, Cu, Fe, Mn and Ni. These elements exhibit significant differences in coloured agates compared to the other minerals. Chromium (Cr) and iron (Fe) concentrations were notably higher in green and white chalcedony samples, with values of 263 ppm and 7725 ppm for green chalcedony and 239 ppm and 11185 ppm for white chalcedony, respectively. The high concentrations of Cr and Fe in white agate is related to the nature of their host rock and enrichment of the elements during late-stage processes that doesn’t affect their colour. These elevated concentrations suggest a strong influence of these elements on the colouration of the chalcedony samples, which is consistent with previous studies indicating the role of iron and chromium in the colour zoning of silicate minerals (Mrozik et al., Reference Mrozik, Götze, Pan and Möckel2023). Copper (Cu) concentrations were found to be higher in white and purple chalcedony samples, with levels of 20.4 ppm and 15.8 ppm, respectively. In contrast, manganese (Mn) was more abundant in black and purple chalcedony samples, with concentrations of 223 ppm and 143 ppm, respectively. Manganese is typically associated with darker tones, and its elevated levels in these chalcedony samples may account for the dark colouration observed in these samples (da Costa et al., Reference da Costa, Alencar, Gomes, de Almeida and de Oliveira2016). Nickel (Ni) concentrations were significantly higher in purple chalcedony (73.5 ppm) and associated kaolinite (382 ppm), suggesting a potential influence of Ni on the distinctive purple colouration. The association of nickel in the purple chalcedony could reflect a localised geochemical environment, possibly influenced by hydrothermal processes (Monico et al., Reference Monico, Cantaluppi, Diella, Gatta, Adamo, Fumagalli and Marinoni2024).
Diagrams showing the variation in trace-element concentrations across chalcedony and host-rock samples from the Qazdez-Bahamarz area: (a) purple, green, blue, grey, red and white chalcedony; (b) black and lemon yellow chalcedony; (c) kaolinite, fresh host rock, altered host rock and carbonate host rock; (d) lavender and lavender 2 chalcedony samples.

When examining the altered volcanic host rocks, concentrations of Cu, Zn, Mn and Pb were found to be higher than in the chalcedony and chalcedony samples. This trend suggests that the host rocks, particularly those with altered mineral assemblages, may serve as a significant source of these elements to the hydrothermal fluids that contributed to the formation of the chalcedony deposits (Miladinović et al., Reference Miladinović, Simić, Nikolić, Orsini and Rosić2024). On the other hand, molybdenum (Mo) concentrations were found to be lower in both host rocks compared to the chalcedony samples, indicating limited mobilisation of Mo during the formation of the siliceous minerals (Bali et al., Reference Bali, Keppler and Audetat2012).
Stable isotopes
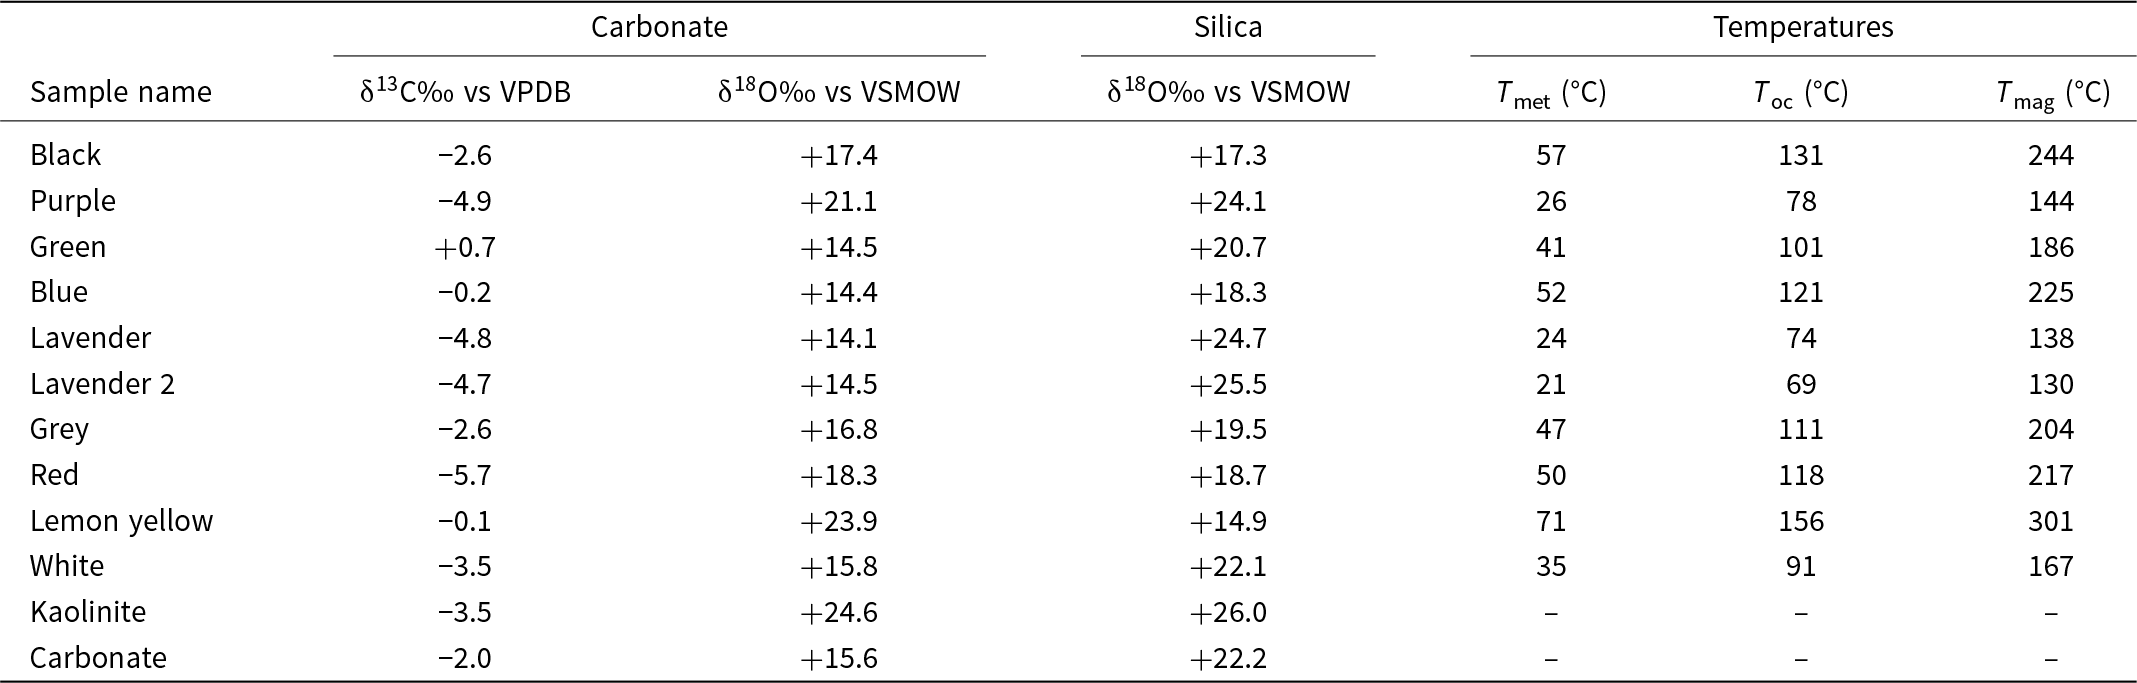
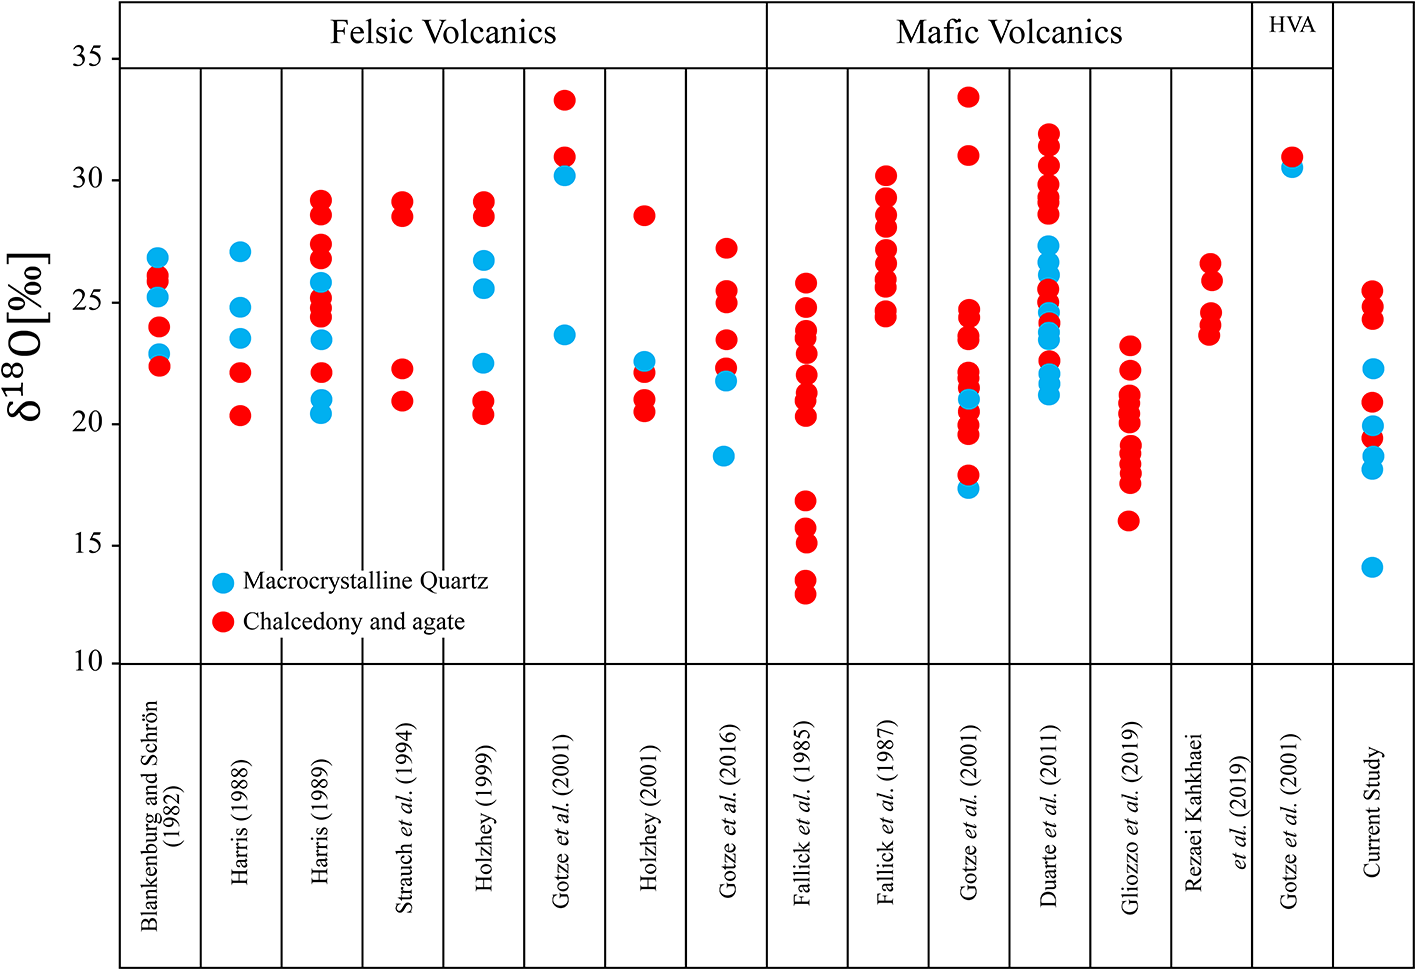
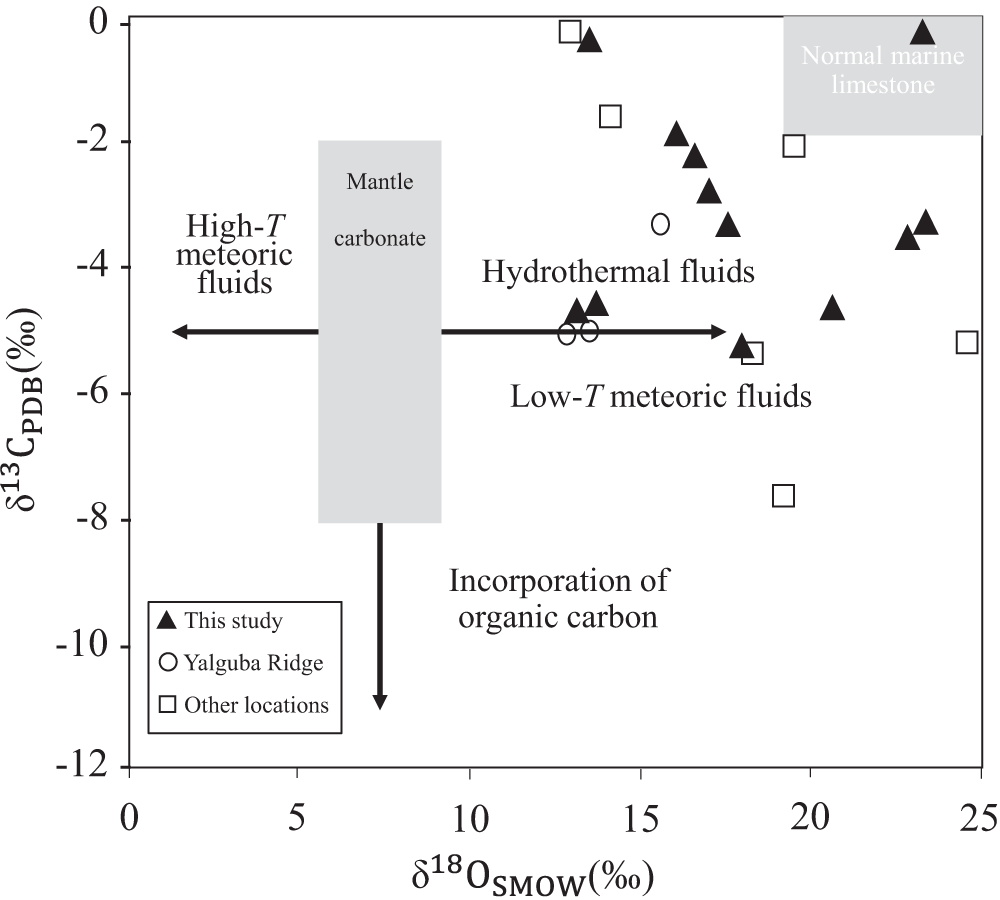
Oxygen and carbon isotope data for the carbonate and silica phases of chalcedony samples and host rocks are presented in Table 2. The isotopic compositions in chalcedony vary depending on the chemical composition of the fluid, meteoric water and host rock. The δ18O values for the carbonate and silica phases in chalcedony range from 14.1 to 24.8‰ and 14.9 to 24.7‰, respectively. The δ13C values for the carbonates range from –5.7 to 0.7‰. The stable isotope data of quartz and chalcedony from the Qazdez-Bahamarz area are compared with other chalcedony mineralisations worldwide (Fig. 5). Lavender, purple, green and red samples are chalcedony, and white, grey, blue, black and lemon yellow samples are microcrystalline quartz samples. Previous studies have shown that temperature plays a significant role in the fractionation of δ18O, meaning these ratios can be used to estimate the formation temperatures of chalcedony samples (e.g. Matsuhisa et al., Reference Matsuhisa, Goldsmith and Clayton1979). The δ13C vs. δ18O diagram (Fig. 6) shows that most analysed carbonate minerals in blue chalcedony samples fall within the hydrothermal field (Giuliani et al., Reference Giuliani, Phillips, Kamenetsky, Fiorentini, Farquhar and Kendrick2014).
Oxygen and carbon isotope compositions of carbonate and silica minerals in chalcedony and carbonate host rock from the Qazdez-Bahamarz area associated with temperatures of oxygen isotope equilibration which were calculated according to Matsuhisa et al. (Reference Matsuhisa, Goldsmith and Clayton1979) for meteoric water (–10‰ = T met), oceanic water (0‰= Toc) and magmatic water (+8‰ = T mag)

Comparison of oxygen isotope compositions of chalcedony samples from different origins (HVA = hydrothermal vein agate) (data from Blankenburg and Schrön, Reference Blankenburg and Schrön1982; Fallick et al., Reference Fallick, Jocelyn, Donnelly, Guy and Behan1985; Fallick et al., Reference Fallick, Jocelyn, Hamilton, Rodriguez-Clemente and Tardy1987; Harris, Reference Harris1988; Harris, Reference Harris1989; Strauch et al., Reference Strauch, Nitzsche and Holzhey1994; Holzhey Reference Holzhey1999; Götze et al., Reference Götze, Tichomirowa, Fuchs, Pilot and Sharp2001; Holzhey, Reference Holzhey2001; Duarte et al., Reference Duarte, Hartmann, Ronchi, Berner, Theye and Massonne2011; Götze et al., Reference Götze, Möckel, Vennemann and Müller2016; Gliozzo et al., Reference Gliozzo, Cairncross and Vennemann2019; Rezaei Kahkhaei et al., Reference Rezaei-Kahkhaei, Ansarifar and Ghasemi2019).

The δ13C versus δ18O plot for carbonates linked to chalcedony or agate samples from various regions, including those from Yalguba Ridge (Svetova and Svetov, Reference Svetova and Svetov2023) and samples from other global locations (Götze et al., Reference Götze, Tichomirowa, Fuchs, Pilot and Sharp2001). The mantle carbonate box and arrows represent different processes and their influence on δ13C and δ18O values as described by Giuliani et al. (Reference Giuliani, Phillips, Kamenetsky, Fiorentini, Farquhar and Kendrick2014). The composition of typical marine limestone is sourced from Valley (Reference Valley, Valley, Taylor and O’Neil1986).

Raman spectroscopy
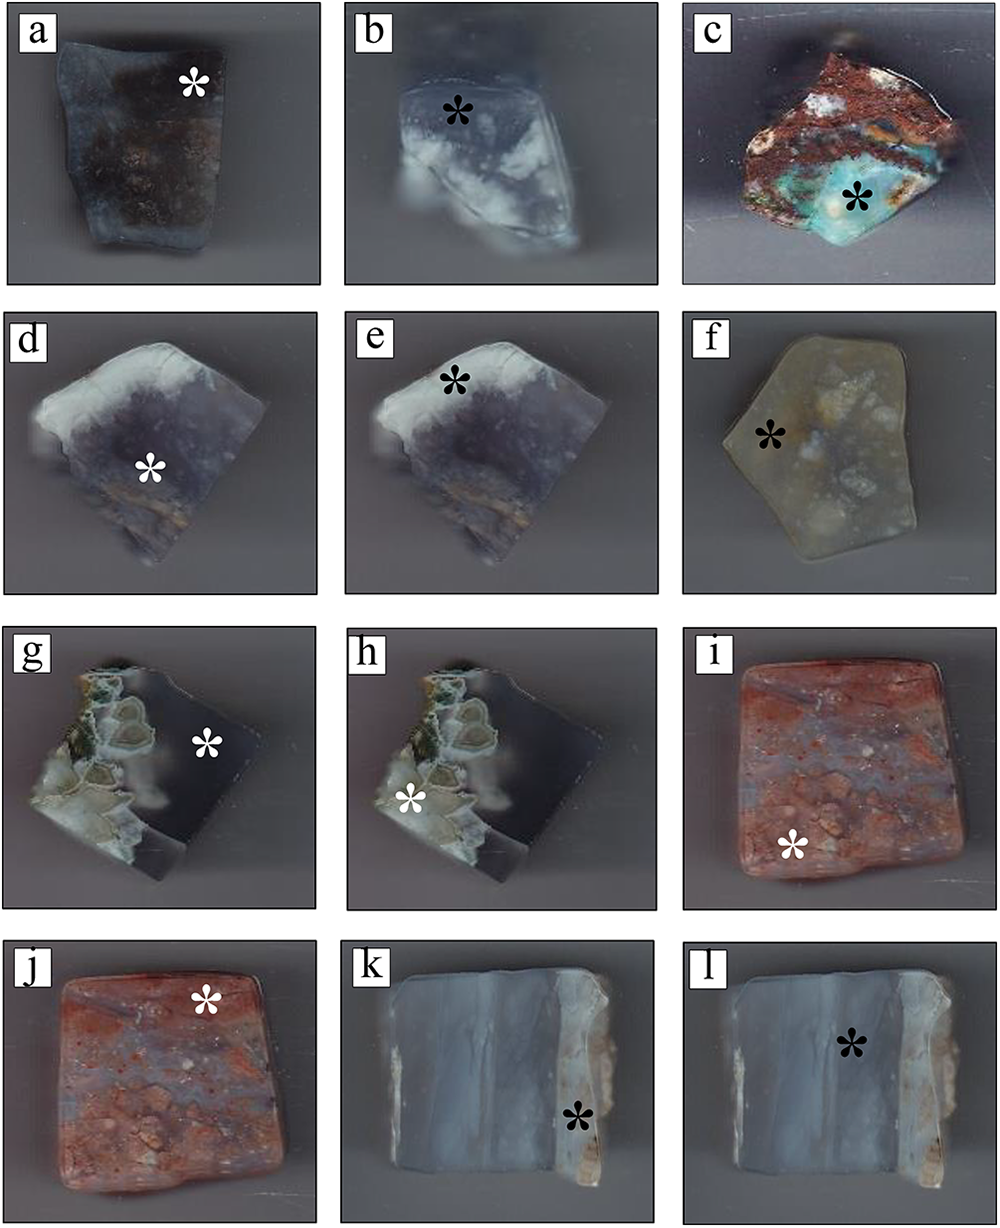
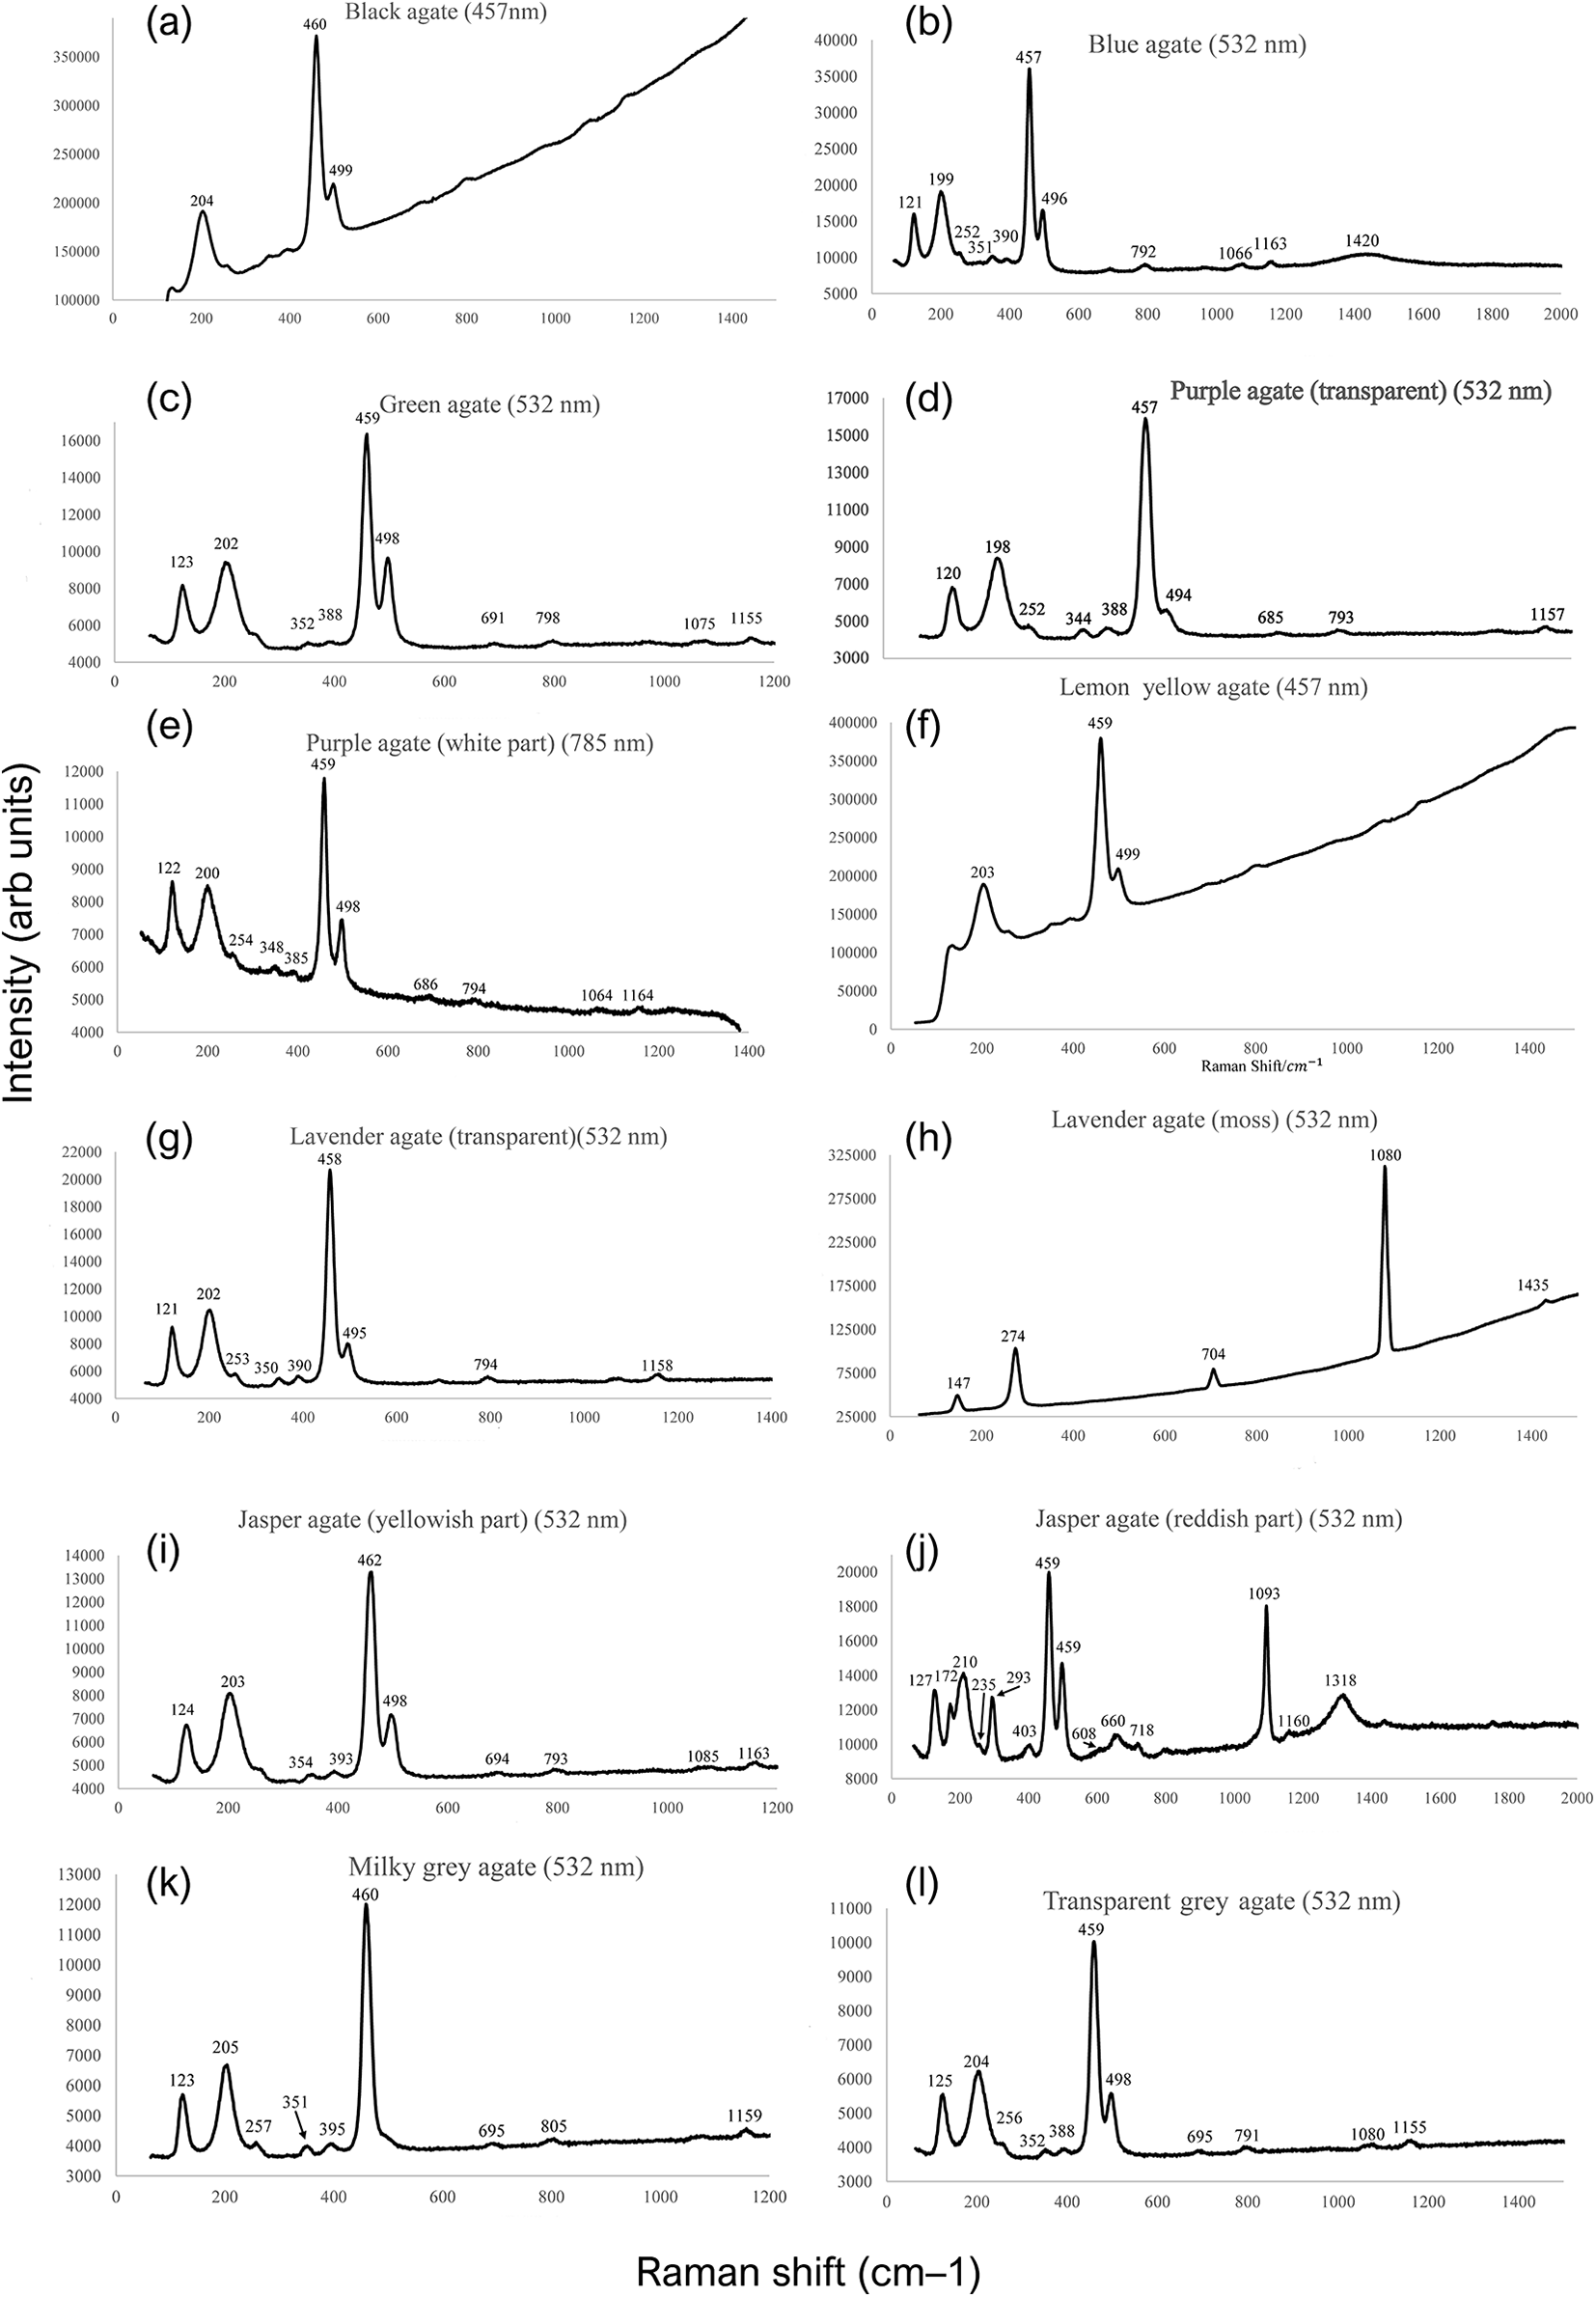
Raman spectrometry is a powerful, non-destructive analytical technique widely used in the study of silicate minerals such as agate and chalcedony (Ferraro and Nakamoto, Reference Ferraro and Nakamoto1994). Both are microcrystalline varieties of quartz, and Raman spectroscopy provides detailed insight into their mineralogy, inclusions, and even geological provenance. Agate, noted for its concentric banding, typically exhibits strong Raman peaks characteristic of α-quartz, particularly around 464 cm–1 (symmetric Si–O–Si stretching), along with lower-frequency peaks near 207 cm–1 and 128 cm–1 (Palyanova et al., Reference Palyanova, Sidorov, Borovikov and Seryotkin2020). Chalcedony, though chemically similar to agate, often appears more fibrous or cryptocrystalline and may contain moganite – a monoclinic silica polymorph that coexists with quartz in many samples (Conte et al., Reference Conte, Della Ventura, Rondeau, Romani, Cestelli, La, Napoleoni and Lucci2022). The presence of moganite is particularly important, as it shows a distinct Raman peak near 502 cm–1, which allows for differentiation between pure quartz and quartz–moganite mixtures. Advanced Raman mapping techniques have enabled the visualisation of the internal banded structure of agates, revealing spatial variation in the distribution of quartz and moganite (Lorenzi et al., Reference Lorenzi, Zullino and Gagliardi2022). The used samples of the Qazdez-Bahamarz chalcedony samples and their Raman spectra span from 100 to 1200 cm–1 (Figs 7 and 8).
Specimens of various chalcedony samples (from the Qazdez-Bahamarz region) used for Raman spectroscopy: (a) black chalcedony; (b) blue chalcedony; (c) green chalcedony; (d) purple chalcedony; (e) white part of purple chalcedony; (f) lemon yellow chalcedony; (g) lavender chalcedony (transparent part); (h) lavender chalcedony (grey part); (i) red chalcedony (yellowish part); (j) red chalcedony (reddish part); (k) milky grey chalcedony; (l) transparent grey chalcedony.

Raman spectroscopy: (a) black chalcedony; (b) blue chalcedony; (c) green chalcedony; (d) purple chalcedony; (e) white part of purple chalcedony; (f) lemon yellow chalcedony; (g) lavender chalcedony (transparent part); (h) lavender chalcedony (grey part); (i) red chalcedony (yellowish part); (j) red chalcedony (reddish part); (k) milky grey chalcedony; (l) transparent grey chalcedony.

Scanning electron microscopy
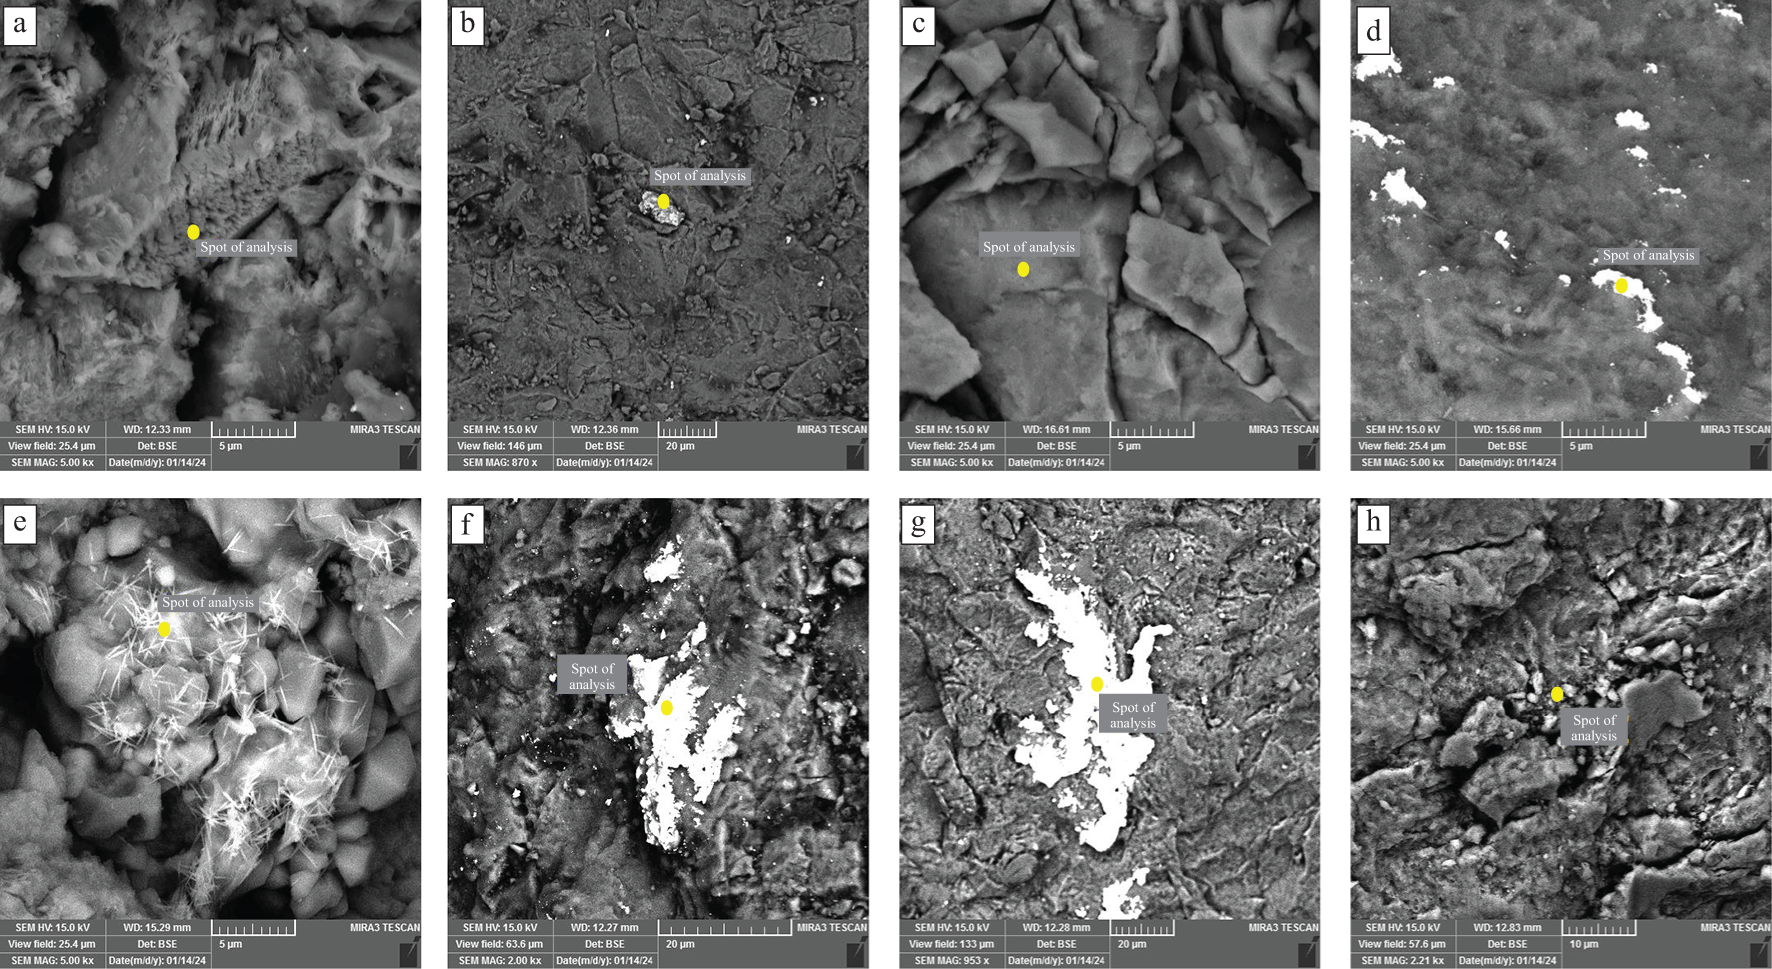
Field-emission scanning electron microscopy (FE-SEM) imaging reveals distinct microtextural features across various chalcedony types, reflecting differences in their formation environments. The SEM method is appropriate to show the composition, morphology, and amount of impurity mineral phases in different types of agates, which affect their colour and determine the content of the identified impurity elements. Transparent zones show fibrous texture (Fig. 9a), indicative of rapid silica precipitation from hydrothermal fluids. In contrast, white chalcedony displays a granular texture and Ti-bearing mineral inclusions (Fig. 9b and c), suggesting slower crystal growth or recrystallisation, whereas super-transparent green chalcedony features a smooth surface (Fig. 9d), probably due to uniform silica deposition under stable conditions. These textures support the presence of concentric zoning, especially in grey chalcedony, and align with previous studies that associate banding with episodic crystallisation from hydrothermal fluids. However, in chalcedony samples from the Qazdez-Bahamarz district, the zoning appears to result primarily from variations in grain size, influenced by changes in the composition and activity of hydrothermal fluids over different mineralisation stages. Formation of needle-shaped opaque inclusions in the green chalcedony samples was identified by FE-SEM (Fig. 9e) and detected by SEM-EDS as Ti-bearing mineral inclusions. Fe-bearing mineral inclusions in blue chalcedony are shown in Fig. 9f. Red agate samples indicate Fe-bearing mineral inclusions (Fig. 9g) with a granular surface (Fig. 9h).
FE-SEM images of chalcedony from the Qazdez-Bahamarz area; (a) Lavender chalcedony from volcanic units showing a fibrous texture; (b) opaque inclusion in white chalcedony within a smooth matrix; (c) granular texture in a white chalcedony sample with <10 µm size; (d) Sn-rich inclusions in a smooth matrix of green chalcedony; (e) needle-shaped opaque inclusions in a green chalcedony sample; (f) Fe-rich inclusions in a blue chalcedony sample; (g) Fe inclusion in a red chalcedony sample; (h) granular texture in red agate samples.

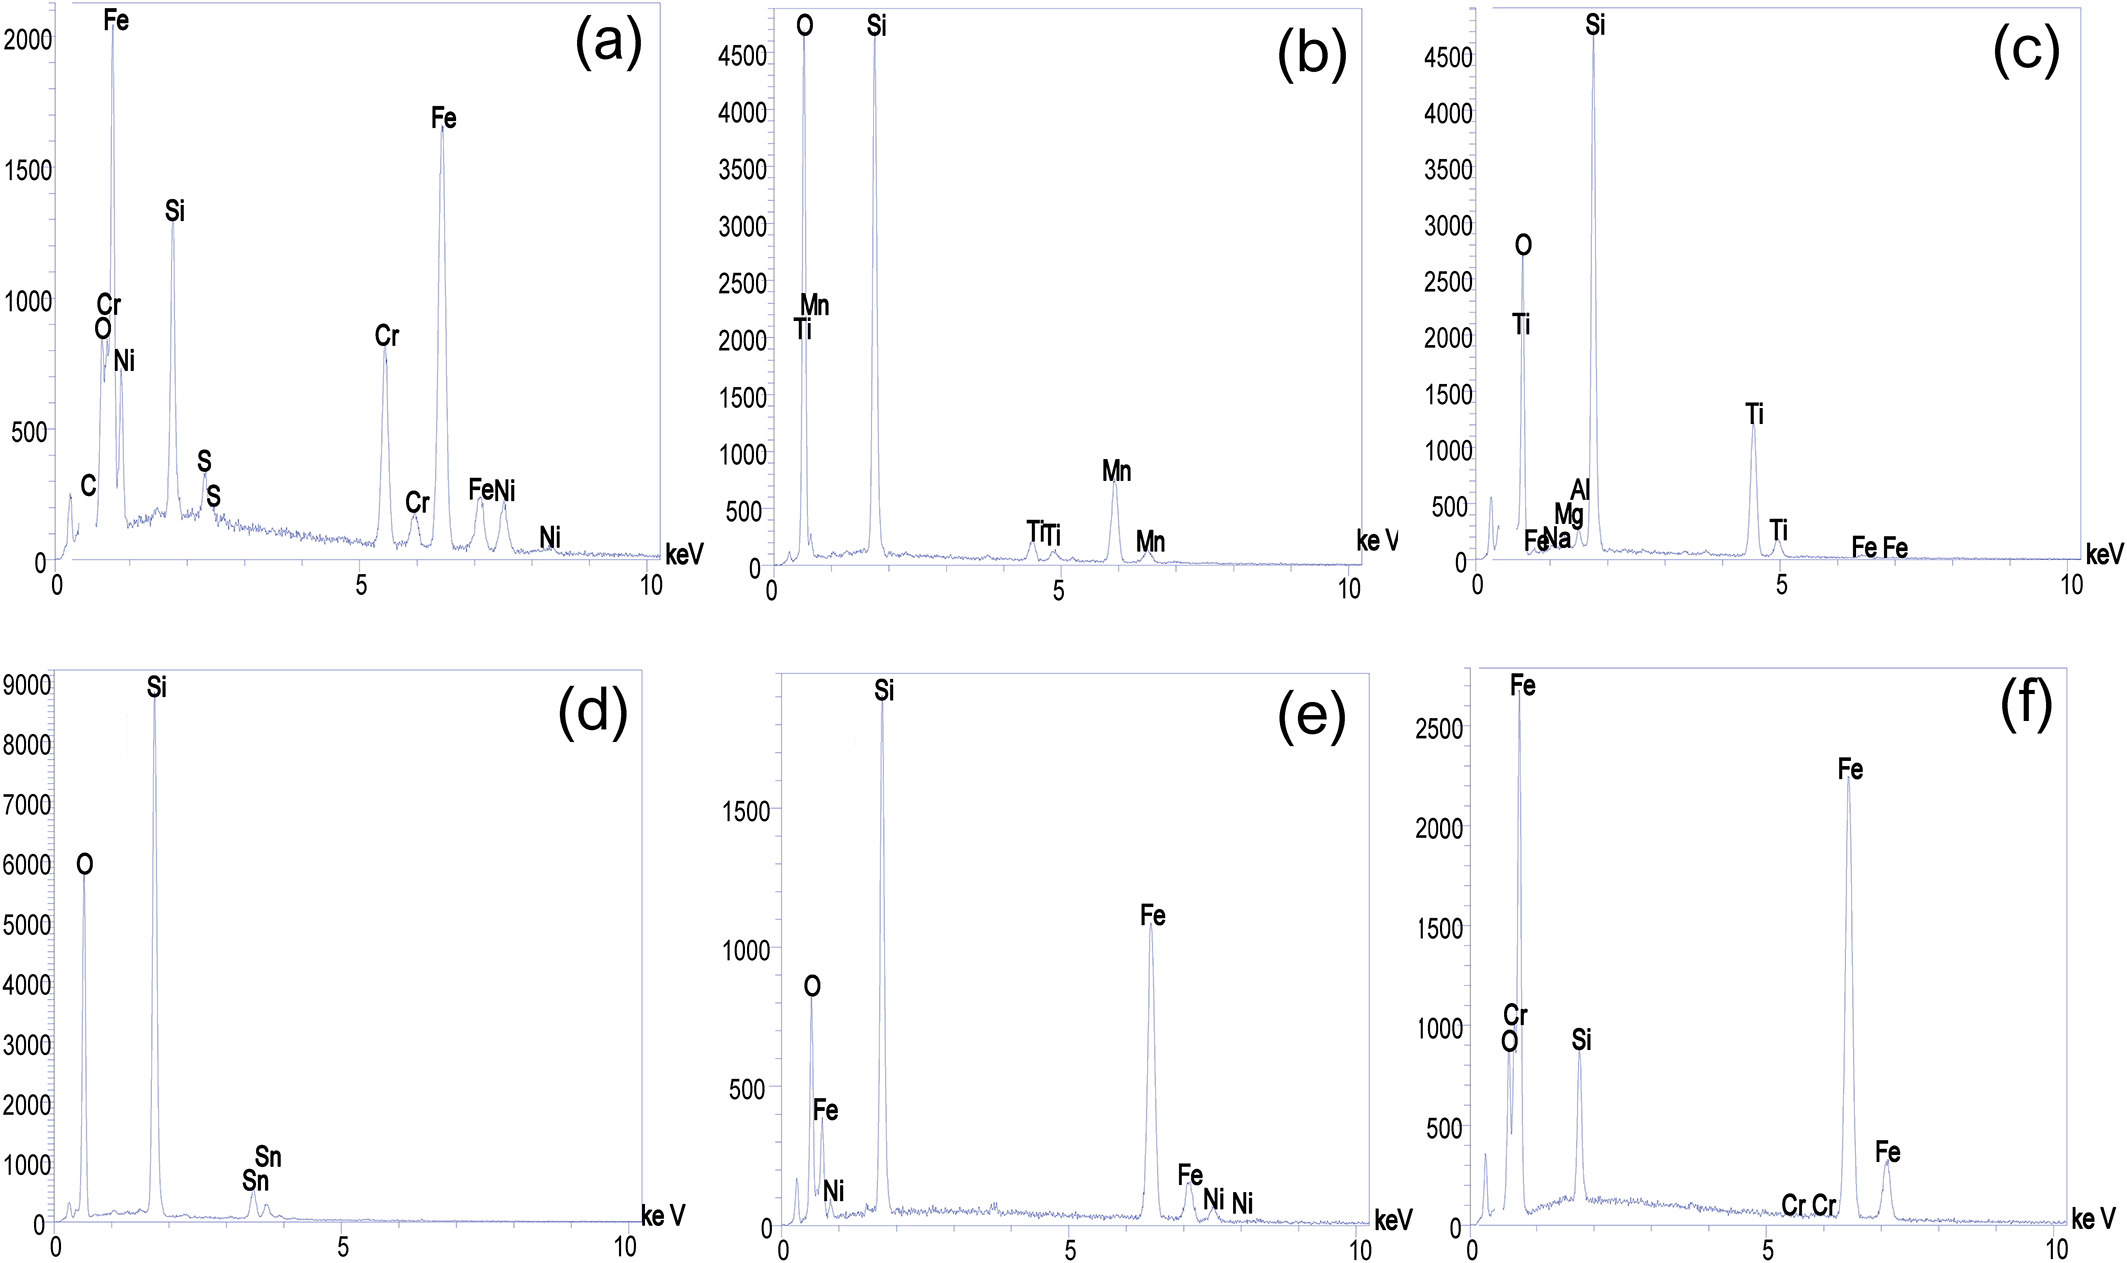
Elemental analysis of micro-inclusions reveals further differentiation among chalcedony types. Black chalcedony samples contain high levels of Cr- and Ni-bearing minerals, pointing to ultramafic source material (Fig. 10a). White chalcedony is marked by elevated Ti- and Mn-bearing mineral inclusions (Fig. 10b), and green chalcedony contains Ti-, Sn-, Fe-, Al- and Mg-, with visible TiO₂-bearing mineral inclusions (Fig. 10c, 10d). Blue chalcedony shows increased Fe- and Ni-bearing mineral inclusions (Fig. 10e), and red chalcedony has the highest Fe concentration overall (Fig. 10f), probably due to iron oxide inclusions.

X-ray diffraction (XRD)
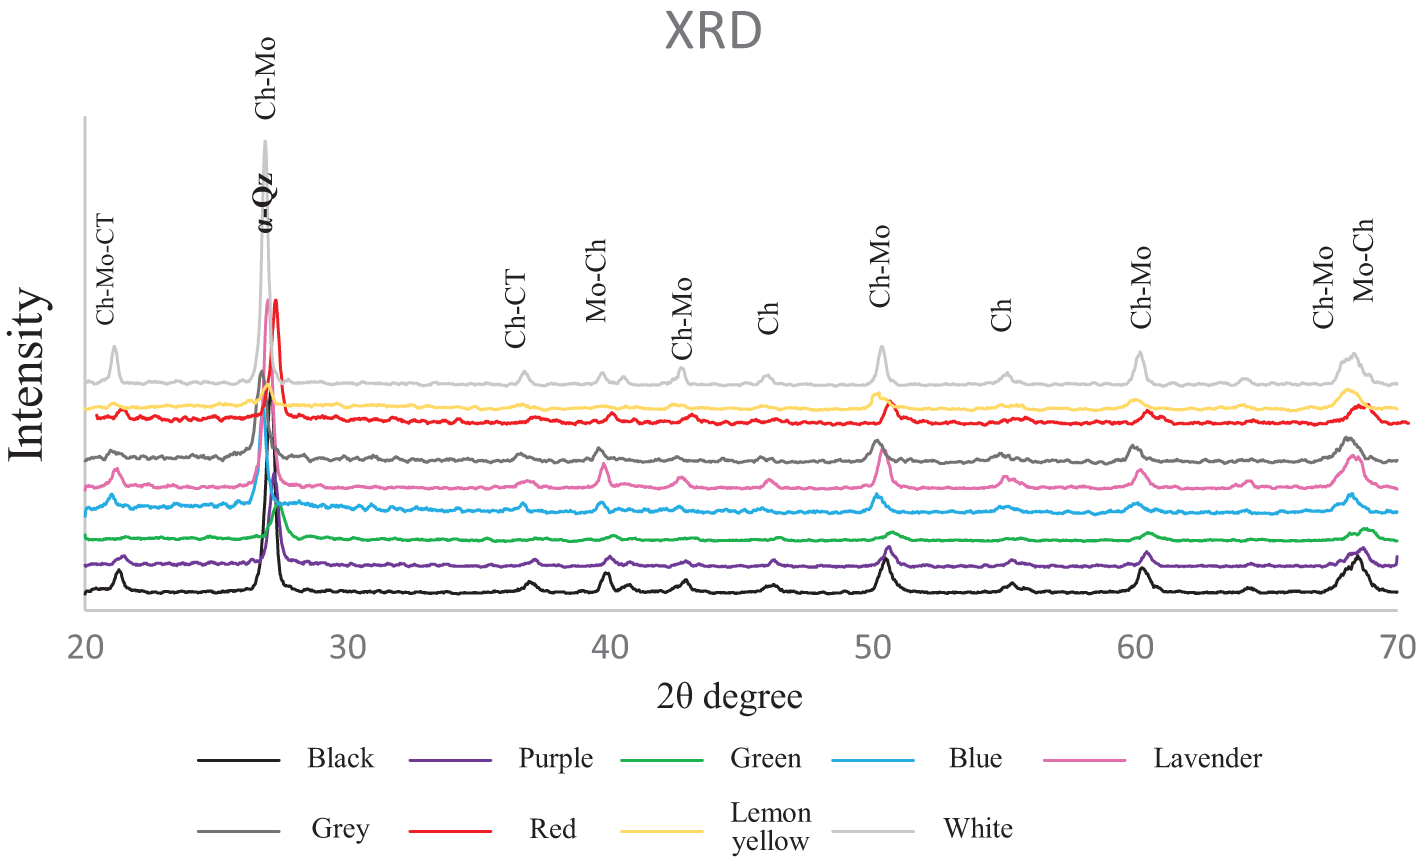
X-ray diffraction (XRD) analysis was conducted to determine the mineralogical composition and crystallinity of agate and chalcedony samples collected from the Qazdez-Bahamarz area. The diffraction patterns (Fig. 11) revealed a series of sharp and well-defined peaks, with major reflections occurring at 2θ values of 20.81°, 26.62°, 36.49°, 39.52°, 42.29°, 50.12°, 55.31°, 60.08°, 64.20° and 68.11°. These peaks correspond to α-quartz (SiO₂), confirming that the primary mineral phase in all samples is well-crystallised quartz, characteristic of agate and chalcedony. The most intense peak at 26.62° (d ≈ 3.34 Å) is typical of the (101) reflection of quartz, whereas additional peaks indicate the presence of multiple crystallographic orientations, suggesting a mixture of fine-grained microcrystalline and cryptocrystalline quartz.
XRD pattern of chalcedony samples from the Qazdez-Bahamarz region, including black, purple, green, blue, lavender, grey, red, lemon yellow and white chalcedony samples.

Electron paramagnetic resonance (EPR)
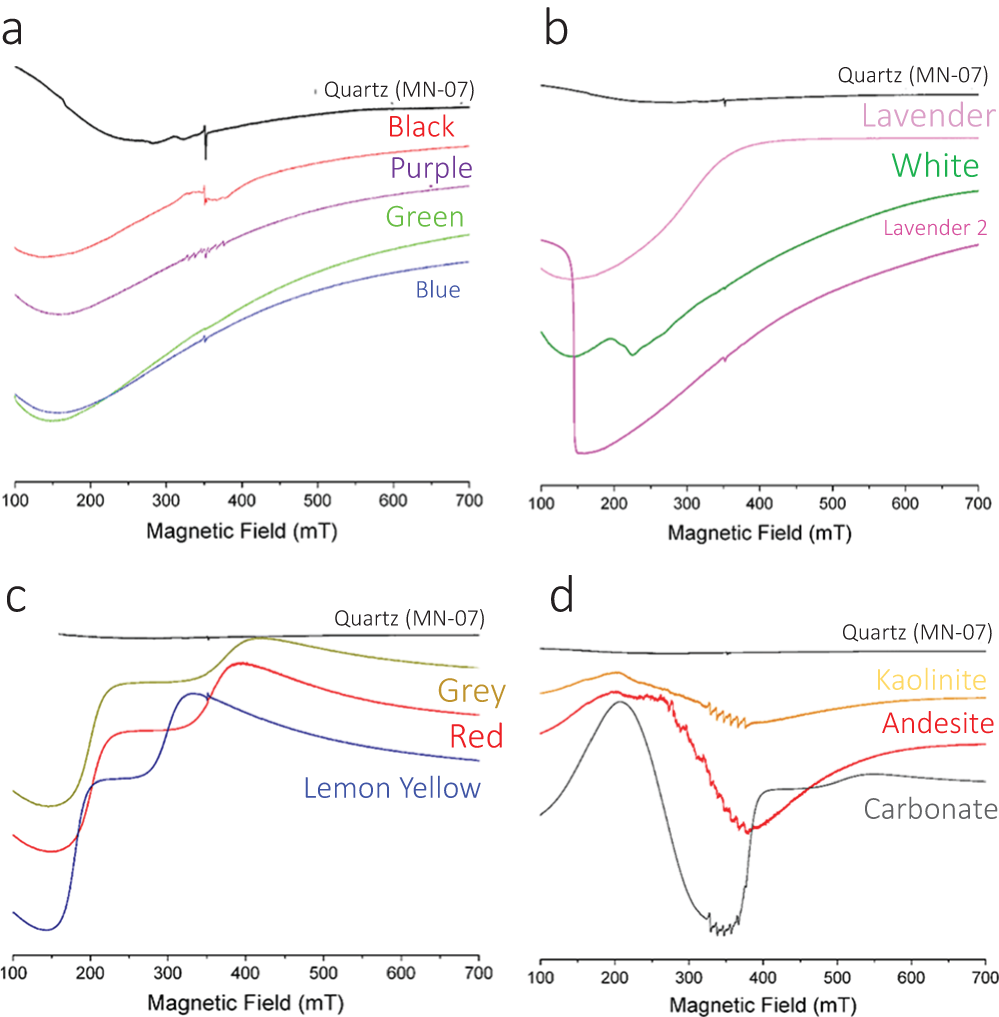
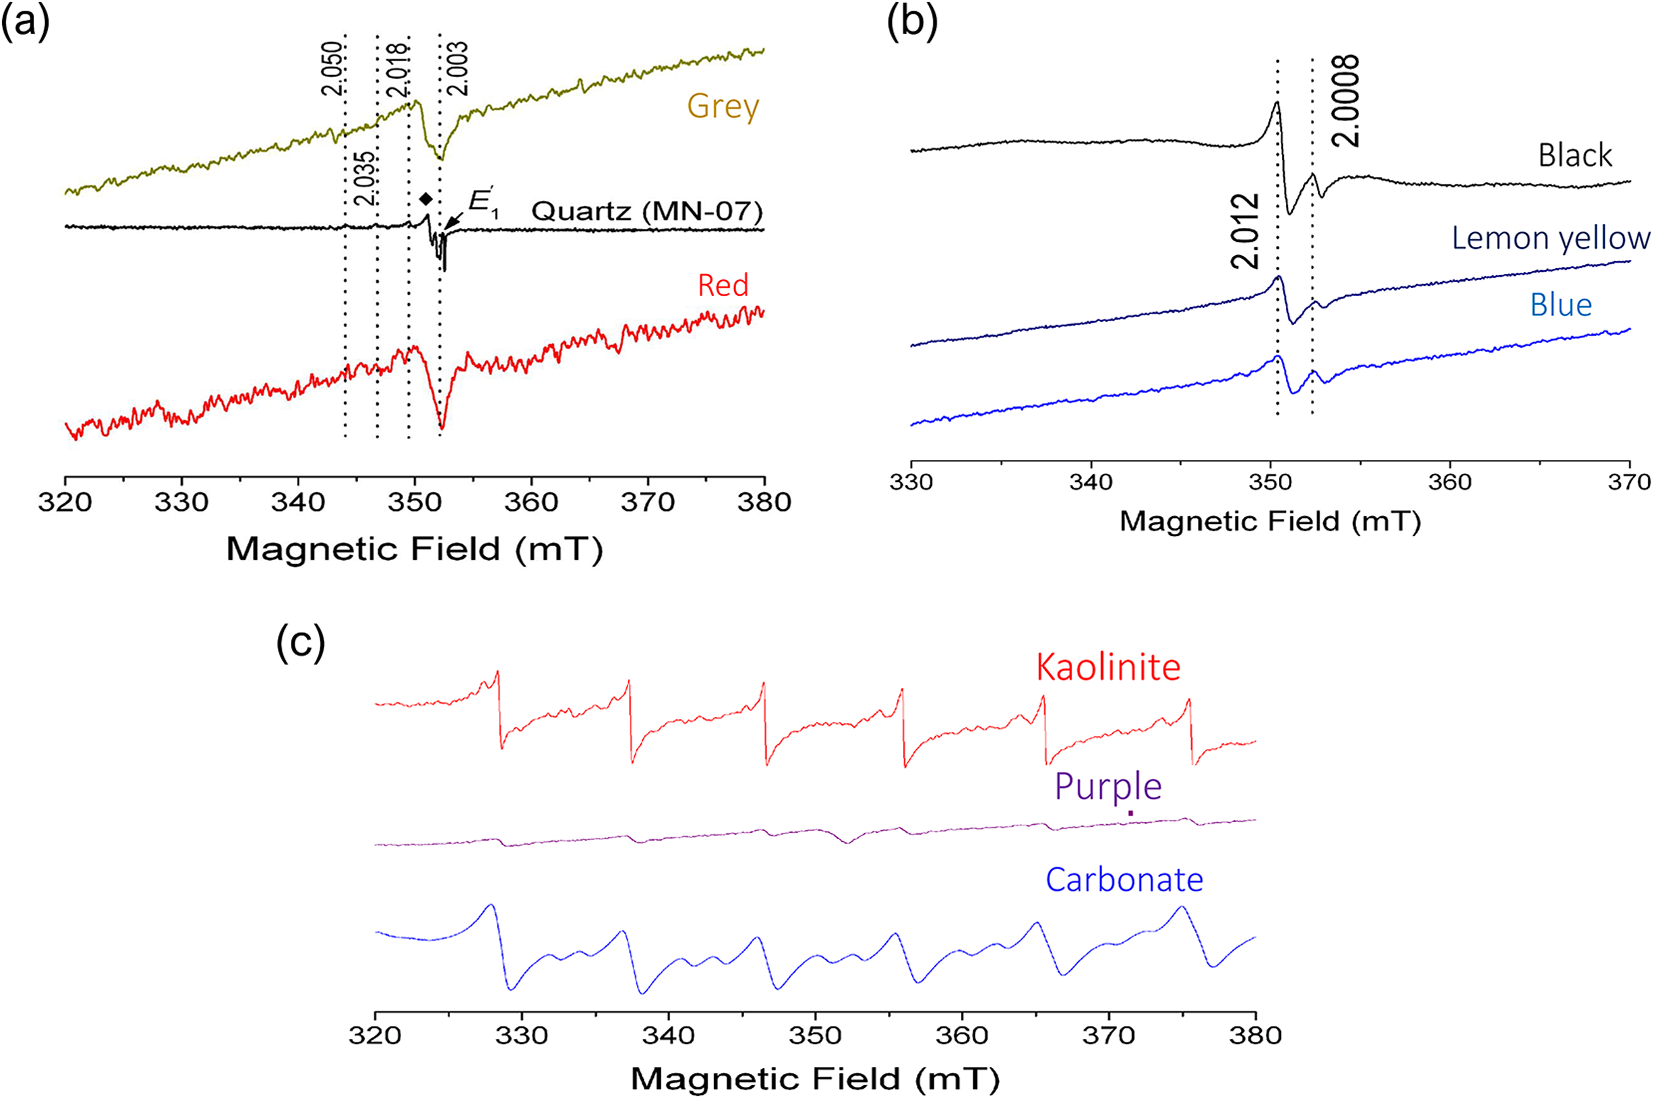
The powder EPR spectra of all ten chalcedony samples, along with four other samples (a carbonate host rock, kaolinite interlayer in a chalcedony, fresh and altered carbonate and volcanic rocks) from the Qazdez-Bahamarz area, are displayed in Figs 12 and 13. Notably, the altered volcanic host rock sample could not be analysed due to issues with tuning the spectrometer, probably caused by the presence of magnetic impurities (e.g. goethite). The wide-scan EPR spectra of the chalcedony samples, measured at microwave powers of ∼66.5 mW (Fig. 12), can be categorised into three groups based on their distinct magnetic backgrounds. Most of the spectra in Figs 12a and 13b can be modelled with a broad magnetic background, showing an effective g-factor of ∼2.0 and very broad linewidths (>300 mT). Additionally, the EPR spectra of the white chalcedony and lavender 2 chalcedony samples also feature extra broad signals at effective g-factor values of 3.6 and 4.9, respectively (Fig. 12b). Fig. 12c indicates that the EPR spectra of grey, red and lemon yellow chalcedony samples consist of at least two broad signals: one at an effective g-factor of ∼3.0 and another ranging from ∼2.1 to ∼1.7. Fig. 12d reveals that the EPR spectra of kaolinite, volcanic host rock and carbonate host rock samples are dominated by broad signals centred at an effective g-factor of ∼3.5, along with characteristic 55Mn2+ sextets showing hyperfine constants of ∼9 mT at the central magnetic field region.
Wide-scan powder EPR spectra of chalcedony samples from the Qazdez-Bahamarz area, measured at microwave powers of 66.5 mW, displaying strong magnetic backgrounds: (a) black, purple, green and blue chalcedony samples; (b) lavender, lavender 2 and white chalcedony samples; (c) grey, red and lemon yellow chalcedony samples; and (d) kaolinite, fresh andesite and carbonate samples. The spectrum of the quartz sample MN-07 from Cheung et al. (Reference Cheung, MacKay, Sykes and Pan2024) is included for comparison.

(a) Powder EPR spectra of grey and red chalcedony samples, measured at microwave powers of 2.1 mW within a magnetic field range of 320 – 380 mT, displaying silicon-vacancy hole centres with g-maximum values of ∼2.050, ∼2.035 and ∼2.018, g-intermediate values between ∼2.008 and ∼2.010 (indicated by a solid diamond) and g-minimum values of ∼2.003 (indicated by dashed lines). Note that the oxygen-vacancy electron centre E′1 (shown by an arrow) present in the spectrum of quartz MN-07 (Cheung et al., Reference Cheung, MacKay, Sykes and Pan2024) is notably absent in the spectra of grey and red chalcedony samples. (b) Powder EPR spectra of black, lemon yellow and blue chalcedony samples, measured at microwave powers of 2.1 mW, displaying two resonance signals at effective g-factor values of ∼2.012 and ∼2.0008 (indicated by dotted lines). (c) Powder EPR spectra of kaolinite, carbonate host rock and purple chalcedony, measured at microwave powers of 2.1 mW, displaying the 55Mn2+ sextet with characteristic A(55Mn) hyperfine splittings of ∼9 mT. The purple chalcedony sample also shows silicon-vacancy hole centres, indicated by an arrow at the g-minimum value of 2.003.

Powder EPR spectra measured at the central magnetic field region show various natural radiation-induced paramagnetic centres in some chalcedony samples (Fig. 12a,b). For instance, Fig. 13a demonstrates that the grey-dendritic and red chalcedony samples have well-resolved silicon-vacancy hole centres (such as pyroxy/superoxide and ozonide radicals), with distinct g-maximum values at ∼2.050, ∼2.035 and ∼2.018, but sharing similar g-intermediate and g-minimum values of ∼2.010–2.008 and ∼2.003, respectively. These silicon-vacancy hole centres in quartz are believed to result from alpha particles emitted during the decay of U, Th, and their unstable progeny (Pan et al., Reference Pan, Nilges and Mashkovtsev2008; Götze et al., Reference Götze, Pan and Müller2021; Cheung et al., Reference Cheung, MacKay, Sykes and Pan2024). Surprisingly, the EPR spectra of all chalcedony samples in this study lack the classic oxygen-vacancy electron centres, such as E′1 (Götze et al., Reference Götze, Pan and Müller2021) (Fig. 13a). The EPR spectra of black, lemon yellow and blue chalcedony samples exhibit two signals at effective g-factor values of ∼2.012 and ∼2.0008. Spectral simulations suggest these signals are probably due to uniaxial and isotropic sulfur-related radicals in calcite and gypsum (Lin et al., Reference Lin, Nilges, Wien, Chen, Wang and Pan2019).
Figure 13c shows the well-resolved 55Mn2+ sextets in the EPR spectra of kaolinite, carbonate host rock and purple chalcedony. Spectral simulations confirm that these EPR spectra can be reproduced using the spin Hamiltonian parameters of 55Mn2+ in kaolinite (Muller and Calas, Reference Muller and Calas1993) and calcite (Piligkos et al., Reference Piligkos, Laursen, Morgenstjerne and Weihe2007). Additionally, the EPR spectrum of the purple chalcedony sample contains both the 55Mn2+ sextet of calcite and silicon-vacancy hole centres.
Discussion
Anatomy of crystalline SiO2
The mineralogical and petrographic features of the Qazdez-Bahamarz chalcedony samples demonstrate their formation within a low-temperature, silica-rich hydrothermal system, characteristic of epithermal environments. Quartz in these deposits occurs predominantly in its microcrystalline and cryptocrystalline forms of chalcedony and moganite, which are indicative of rapid precipitation from silica-supersaturated fluids under low-temperature conditions (Randive et al., Reference Randive, Chaudhary, Dandekar, Deshmukh, Peshve, Dora and Belyatksi2019). The dominance of fibrous and grainy chalcedony textures, along with spherulitic moganite, particularly within veins, veinlets and vesicular fillings, supports a multistage silicification process, probably governed by episodic fluid influx along structurally controlled conduits.
The distribution of chalcedony within both epithermal-related vein systems and space-filling vesicles within volcanic rocks further corroborates their derivation from hydrothermal fluids migrating upward through fractures. These hydrothermal fluids, as they cooled and depressurised, deposited silica in colloform bands, which is a process also recognised in chalcedony systems hosted by volcanic rocks worldwide (Götze et al., Reference Götze, Möckel and Pan2020; Saunders, Reference Saunders1990).
Petrographic analysis further reveals the association of silica phases with secondary carbonate and clay minerals (e.g. calcite, aragonite, kaolinite), particularly in deeper sections of the hydrothermal system. This mineral zonation implies a thermal and chemical gradient, consistent with silica solubility behaviour in hydrothermal systems and the pH buffering effect of carbonate host rocks (Çalık and Arzoğulları, Reference Çalık and Arzoğulları2014). Moreover, the crosscutting nature of chalcedony veins through carbonate units suggests that the silica-saturated fluids were sufficiently aggressive to alter pre-existing lithologies, possibly due to mixing with meteoric waters or evolving fluid-rock interaction over time (Knauth, Reference Knauth1979; Tatzel et al., Reference Tatzel, Oelze, Frick, Di Rocco, Liesegang, Stuff and Wiedenbeck2024). Collectively, these textural, mineralogical and spatial patterns are consistent with models of chalcedony formation in sub-volcanic to near-surface environments, where cyclic fluid flow, silica polymerisation and host rock permeability dictate the localisation and morphology of siliceous bodies (Yasuhara et al., Reference Yasuhara, Kinoshita, Kurikami, Nakashima, Kishida, Shao and Burlion2013).
Distribution of trace elements
The trace-element geochemistry of agates and chalcedony samples from the Qazdez-Bahamarz district reveals a complex interplay of mineralising fluids, host-rock chemistry and hydrothermal alteration processes. Consistent enrichment of Al, Fe and Pb across multiple chalcedony types is indicative of hydrothermal fluid transport during silica precipitation phases (Götze et al., Reference Götze, Plötze, Graupner, Hallbauer and Bray2004). Notably, Fe enrichment aligns with the colouration trends observed in red, lemon yellow and grey chalcedony samples, reflecting the influence of Fe3⁺ and associated iron oxides such as hematite and goethite, which are well-documented chromophores in cryptocrystalline silica (Götze et al., Reference Götze, Tichomirowa, Fuchs, Pilot and Sharp2001).
Iron not only contributes to colouration but also affects the nanostructure and crystallisation behaviour of silica, as confirmed by spectroscopic studies in volcanic chalcedony systems (Götze, Reference Götze2009). Similarly, Mn enrichment in darker varieties, especially black, purple and blue chalcedony samples, further supports its role in imparting colour through dendritic oxide inclusions and potential Mn2⁺ substitution in the silica matrix. These observations are consistent with those from other low-temperature hydrothermal systems, where Mn is variably mobilised depending on redox and pH conditions (Liu et al., Reference Liu, Cui, Lu, Flynn and Catalano2025).
The unique geochemical signature of purple chalcedony samples, particularly their Ni enrichment, suggests possible Ni2⁺ substitution within the silica structure or association with kaolinite-bearing phases. Given the presence of Ni-bearing host rocks, it is likely that Ni was incorporated early during mineral formation, causing colouration in agate samples (e.g. Monico et al., Reference Monico, Cantaluppi, Diella, Gatta, Adamo, Fumagalli and Marinoni2024). Similarly, the Cr enrichment in green chalcedony samples supports its substitution as Cr3⁺ in fibrous chalcedony or incorporation within Cr-bearing minerals such as previously reported for volcanic-hosted agates from Eswatini (Monico et al., Reference Monico, Cantaluppi, Diella, Gatta, Adamo, Fumagalli and Marinoni2024). Trace elements such as Zn (in lavender chalcedony) and Pb (in grey chalcedony) also appear to reflect local fluid compositions and possible inclusion of accessory minerals. Their restricted distribution and minor abundance indicate sensitivity to fluid composition during silica crystallisation (Tandon et al., Reference Tandon, John, Heuss-Aßbichler and Schaller2018).
Comparative analysis between altered and unaltered host rocks further emphasises the complexity of the hydrothermal system. The altered host rocks, enriched in Fe, Zn, Cu and Cd, resemble propylitic alteration zones where metal-bearing fluids induce base -metal deposition and silicification (Xiao et al., Reference Xiao, Zhou, White, Wang, Liu and Li2025). The observed depletion of Al and Mn in these zones may reflect acid-leaching processes, which preferentially mobilise these elements (Xiao et al., Reference Xiao, Chen, Hollings, Wang, Yang and Wang2018). In contrast, carbonate-rich lithologies showing depletion in Zn, Pb and Ni are interpreted to have undergone acid leaching during silica deposition, a process common in carbonate-hosted hydrothermal systems (Guo et al., Reference Guo, Yang, Li, Shi, Peng, Sarkodie, Miao, Liu, Liu and Jiang2023).
Overall, the trace-element distribution in chalcedony samples from Qazdez-Bahamarz confirms that chalcedony colouration and texture are not solely governed by physical inclusions but are also chemically controlled. These variations capture the geochemical evolution of the system and reflect dynamic processes involving cyclic fluid influx, fluctuating redox states, and shifts in fluid temperature and pH. The integration of mineralogical, structural and geochemical evidence provides strong support for a multi-phase model of chalcedony formation, with early-stage trace-element incorporation followed by late-stage modification during prolonged fluid–rock interaction.
Oxygen and carbon compositions of silica and carbonate phases
The isotopic composition and temperature conditions of mineral-forming fluids are fundamental parameters for understanding the genesis and evolution of agate and chalcedony. Oxygen isotope fractionation is particularly sensitive to the temperature and composition of silica-precipitating fluids, with δ1⁸O values serving as useful indicators of formation conditions (Götze et al., Reference Götze, Möckel, Vennemann and Müller2016). In this study, δ1⁸O and δ13C values measured from carbonate and silica phases in the Qazdez-Bahamarz district were compared with global reference data, including those from agates hosted in both acidic volcanic and mafic rocks (Fig. 5). Microcrystalline quartz samples from this district exhibit slightly lower δ1⁸O values than their chalcedony counterparts, aligning with isotopic signatures typically associated with hydrothermal quartz derived from late-stage magmatic fluids (Götze et al., Reference Götze, Tichomirowa, Fuchs, Pilot and Sharp2001). These differences are consistent with theoretical and experimental observations that quartz–water isotope fractionation constants are weaker than those of tridymite- or cristobalite-water systems (Götze et al., Reference Götze, Tichomirowa, Fuchs, Pilot and Sharp2001). Consequently, under similar thermal regimes, macrocrystalline quartz tends to exhibit lower δ1⁸O values compared to cryptocrystalline or microcrystalline silica forms (Götze et al., Reference Götze2009).
Given the absence of direct fluid-inclusion data for cryptocrystalline quartz in these samples, isotope-derived formation temperatures were estimated using the model proposed by Matsuhisa et al. (Reference Matsuhisa, Goldsmith and Clayton1979), with assumptions of meteoric (−10‰), oceanic (0‰) and magmatic (+8‰) water compositions (e.g. Götze et al., Reference Götze, Tichomirowa, Fuchs, Pilot and Sharp2001). The resulting temperature range, from 21 to 230°C, suggests multiple stages of silica deposition from both low-temperature sedimentary environments and moderate- to high-temperature hydrothermal systems.
The narrow δ1⁸O range for carbonate phases further indicates that the mineralising fluids were isotopically homogeneous, consistent with well-mixed hydrothermal systems. The δ13C values of calcite samples, ranging from −5.7‰ to +0.7‰, are significantly higher than those typically associated with organic carbon in sedimentary environments (−23.53‰ to −21.12‰; Yadav et al., Reference Yadav, Pulhani and Kumar2025), suggesting an inorganic, probably magmatic, carbon source. This interpretation is in line with studies by Götze et al. (Reference Götze, Möckel and Pan2020), which link similar δ13C values in carbonates associated with agates to devolatilisation of CO₂ from deep magmatic reservoirs.
A δ13C vs. δ1⁸O diagram (Fig. 6) reveals clustering of most samples within the hydrothermal field, with minor deviations indicating localised input from meteoric fluids (e.g. red chalcedony) and marine carbonates (e.g. lemon yellow chalcedony). This supports the interpretation of a dominantly hydrothermal origin for the fluids, with subordinate influence from surface-derived waters during the late stages of mineralisation. The convergence of isotopic signatures between chalcedony and calcite phases across global and regional datasets reinforces the interpretation that silica precipitation in the Qazdez-Bahamarz district occurred under post-magmatic hydrothermal conditions. This aligns with recent models of chalcedony formation in volcanic terrains, where magmatic degassing and subsequent hydrothermal circulation through siliceous host rocks promote the deposition of cryptocrystalline silica (Götze et al., Reference Götze, Möckel and Pan2020).
SiO₂ polymorphs and mineral phases
Raman spectroscopy has proven invaluable in identifying mineral phases within cryptocrystalline silica, particularly for distinguishing between quartz and its lesser-known polymorph, moganite. The detection of moganite in agate and chalcedony samples from the Qazdez-Bahamarz district, especially through Raman shifts in the 499–503 cm–1 range, indicates rapid silica precipitation from supersaturated hydrothermal fluids. This condition favours the formation of moganite, a metastable monoclinic SiO₂ polymorph, due to insufficient time for complete crystallisation into stable α-quartz (Tatzel et al., Reference Tatzel, Oelze, Frick, Di Rocco, Liesegang, Stuff and Wiedenbeck2024; Powolny et al., Reference Powolny, Dumańska-Słowik, Asadi, Hosseinzadeh and Krzątała2025). The predominance of moganite in most coloured chalcedony, contrasted with its absence from white chalcedony, reflects either variations in the rate of silica deposition or post-depositional overprinting, including hydrothermal alteration and recrystallisation.
Moganite is not merely a mineralogical curiosity; it is key to understanding the diagenetic and environmental history of chalcedony formation (Powolny et al., Reference Powolny, Dumańska-Słowik, Asadi, Hosseinzadeh and Krzątała2025). Studies have shown that the presence of moganite serves as a palaeoenvironmental indicator, typically associated with arid, evaporative conditions conducive to rapid silica gel precipitation (Folk and Pittman, Reference Folk and Pittman1971; Götze et al., Reference Götze, Möckel and Pan2020). Conversely, the absence or transformation of moganite, e.g. in white chalcedony samples from Qazdez-Bahamarz, suggests prolonged exposure to recrystallising fluids or elevated temperatures, enabling its conversion into thermodynamically stable quartz (Rodgers and Cressey, Reference Rodgers and Cressey2001).
The instability of moganite makes it a time-sensitive proxy (Gíslason et al., Reference Gíslason, Heaney, Oelkers and Schott1997); thus, its presence can be used to constrain the relative timing of silica deposition and subsequent alteration events. Furthermore, its detection enhances understanding of the silica transport and precipitation dynamics in low-temperature hydrothermal systems, where disequilibrium crystallisation typically predominates (Alekseyev et al., Reference Alekseyev, Medvedeva, Kochnova and Tytyunnik2010; Powolny et al., Reference Powolny, Dumańska-Słowik, Szczerbowska-Boruchowska and Woszczyna2024).
Raman spectral data also substantiate the role of moganite as part of a complex mineralogical suite that includes iron oxides (hematite, goethite), carbonate phases (aragonite) and trace-element-bearing minerals, all contributing to the colour zoning and microstructure of chalcedony samples (Monico et al., Reference Monico, Cantaluppi, Diella, Gatta, Adamo, Fumagalli and Marinoni2024). Furthermore, illite is detected within blue and red chalcedony samples by Raman spectra in peaks at 350–360 cm–1 (Fig. 8b,i; Song et al., Reference Song, Chen, Zuo, Chen, Sui, Pu, Yang, Zhang and Liu2024). These combined observations confirm that moganite is a critical marker of physicochemical conditions during and after chalcedony formation, highlighting its use in reconstructing the thermal and fluid evolution of silica-rich systems (Shen et al., Reference Shen, Lu and He2022).
Microstructures of inclusions using SEM
The FE-SEM analysis of chalcedony samples from the Qazdez-Bahamarz district provides essential insights into their mineralisation environment, revealing a rich interplay between fluid dynamics, crystallisation textures and trace-element incorporation. The diverse surface morphologies, ranging from fibrous to granular and smooth textures, suggest varied growth conditions indicative of fluctuating hydrothermal regimes (Okamoto et al., Reference Okamoto, Saishu, Hirano and Tsuchiya2010). The fibrous texture, especially dominant in transparent chalcedony zones, reflects rapid precipitation from silica-rich hydrothermal fluids under high-temperature and supersaturated conditions, consistent with experimental studies on silica gel crystallisation (Heaney and Davis, Reference Heaney and Davis1995; Götze et al., Reference Götze, Möckel and Pan2020). In contrast, the granular morphology observed in white chalcedony suggests more disordered or retarded crystallisation, potentially triggered by episodic cooling or compositional shifts in the mineralising fluid (Li et al., Reference Li, Cao, Zhou, Liu, Jiang, Li, Cheng, Bai and Wu2023). The smooth surfaces of green super-transparent chalcedony, probably resulting from slow, diffusion-controlled growth in more thermally stable settings, support a deeper, possibly lower-energy hydrothermal origin. Zonation patterns observed in the FE-SEM images further highlight the role of chemical oscillations within the hydrothermal system (Dong et al., Reference Dong, Sun, Kendall, Izon, Cao, Li, Ma, Yin, Qiu, Zhu, Bekker and Poulton2022). These concentric bands, particularly in grey chalcedony, imply episodic changes in solute concentrations or pH, leading to rhythmically layered growth (Götze et al., Reference Götze, Möckel, Vennemann and Müller2016) Such textural variability supports models that attribute agate banding to cyclic fluid chemistry changes, possibly related to pulsating fluid influx or minor tectonic adjustments (Heaney and Davis, Reference Heaney and Davis1995; Götze et al., Reference Götze, Möckel and Pan2020). Additionally, significant variations in grain size across samples along with their corresponding textures point to temporal shifts in nucleation and growth rates, probably induced by local changes in pressure, temperature, or host-rock interaction. These shifts mirror the dynamic geochemical conditions reported from other agate-forming regions (Moxon and Ríos, Reference Moxon and Rios2004).
Trace-element distribution, revealed through SEM-EDS mapping, provides a valuable proxy for chalcedony colouration and mineral inclusion history (e.g. Powolny et al., Reference Powolny, Dumańska-Słowik, Asadi, Hosseinzadeh and Krzątała2025). The enrichment of Cr and Ni in black chalcedony samples aligns with known chromophore mechanisms where these elements substitute within the silica structure or are hosted in nanoscale oxide inclusions (e.g. Powolny et al., Reference Powolny, Dumańska-Słowik, Asadi, Hosseinzadeh and Krzątała2025). Fe, Al and K in lavender chalcedony suggest goethite or hematite microinclusions, well-documented agents of yellow–red colourations (Zhou et al., Reference Zhou, Liu, Zhao and Guo2022). Similarly, high Mn in white chalcedony suggest manganese oxides, which are known to modulate light absorption properties and result in colourful patterns (Powolny et al., Reference Powolny, Dumańska-Słowik, Sikorska-Jaworowska and Wójcik-Bania2019).
The green colouration of certain chalcedony samples is attributed to elevated Ti, Sn, Fe and Al levels, possibly indicative of chlorite or other Fe-rich phyllosilicates, corroborated by the presence of titanium dioxide observed in SEM images (Svetova and Svetov, Reference Svetova and Svetov2023). Studies in the Beihong region (Tian et al., Reference Tian, Chen, Zheng, Wu and Xu2023) reported that the Fe-content (goethite and hematite) in agates from the Beihong region can affect the lightness and the hue of the agate and chalcedony samples. Blue chalcedony samples, marked by Ni and Fe peaks, further validate the role of trace metal ions in hue development, potentially via fine-scale hematite or magnetite inclusions. Red chalcedony samples, with the highest Fe content, display Raman and EDS signatures consistent with hematite dominance, a characteristic of oxidation-driven iron mineralisation (Götze et al., Reference Götze, Möckel and Pan2020).
Collectively, the textural and chemical diversity among the Qazdez-Bahamarz chalcedony samples confirms a dynamic hydrothermal environment, where episodic shifts in fluid parameters led to distinct growth habits, compositional zoning and mineral inclusion histories. This investigation contributes to the understanding of chalcedony genesis in volcanic and subvolcanic systems, emphasising the sensitivity of silica precipitation processes to local geological and chemical variations.
Detection of the main micro- and crypto-crystalline phases using XRD
The crystallinity and structural characteristics of the various SiO2 phases identified in the Qazdez-Bahamarz district through X-ray diffraction (XRD) analysis provide valuable insights into the mineralogical composition and formation processes of chalcedony samples in this region. By comparing the XRD patterns of these samples with reference databases and published studies, it is possible to categorise the observed SiO2 phases into distinct microcrystalline and cryptocrystalline forms, such as moganite, chalcedony, opal-C and Opal-CT.
Moganite, a common microcrystalline phase found within agate and chalcedony, has been classified as a minor phase in the chalcedony matrix (Frondel, Reference Frondel1978). In the Qazdez-Bahamarz samples, the presence of moganite is confirmed through XRD analysis, with characteristic peaks that distinguish it from other SiO2 polymorphs. The presence of moganite, along with chalcedony, points to rapid silica precipitation, which is characteristic of hydrothermal environments, often linked to post-magmatic fluids (Gíslason et al., Reference Gíslason, Heaney, Oelkers and Schott1997; Powolny et al., Reference Powolny, Dumańska-Słowik, Szczerbowska-Boruchowska and Woszczyna2024). Moganite is known to form during rapid crystallisation under specific conditions such as those found in evaporative or hydrothermal systems, where supersaturation of silica occurs. The shift in the XRD peak positions for moganite (∼23° and 26°2θ) compared to quartz further supports this interpretation (Smith, Reference Smith1998; Moxon and Rison, Reference Moxon and Rios2004).
In addition to moganite and chalcedony, XRD patterns from the Qazdez-Bahamarz district also show evidence of opal-CT, an intermediate phase between amorphous opal and crystalline silica polymorphs such as cristobalite and tridymite. Opal-CT is identified by broad diffraction peaks at ∼20.5° and 44.0°2θ, characteristic of its poorly ordered structure (Sodo et al., Reference Sodo, Casanova, Barucca, Bellatreccia, Della Ventura, Butini and Ricci2016). This phase is significant in the context of chalcedony formation as it suggests a transitional stage in the crystallisation process, where the silica is in a partially ordered state before fully transitioning into crystalline forms such as quartz or moganite.
Opal-CT often forms in the presence of hydrothermal fluids (Popov et al., Reference Popov, Spikings and Razakamanana2022), and may indicate that the chalcedony samples from the Qazdez-Bahamarz district underwent a stage of relatively low-temperature formation.
The XRD data highlight important differences in crystallinity between the various silica phases identified in the chalcedony samples. Quartz, the most crystalline form of SiO2, exhibits sharp diffraction peaks that can be easily differentiated from the more diffuse peaks of cryptocrystalline phases such as chalcedony, moganite and opal-CT (Marinoni and Broekmans, Reference Marinoni and Broekmans2013). The sharp peaks of quartz, particularly those at 26.6°2θ, are indicative of its highly ordered crystal structure, which contrasts with the broader peaks of less crystalline phases such as chalcedony and moganite. This distinction in crystallinity is crucial for understanding the formation environment of the chalcedony samples, as more crystalline forms such as quartz typically form under higher-temperature conditions, whereas the less crystalline forms are more likely to form in lower temperature or more dynamic environments (Götze et al., Reference Götze, Pan and Müller2021).
The comparison of XRD patterns from the Qazdez-Bahamarz samples with those from other SiO2 phases helps to establish the role of crystallinity in the formation of chalcedony and related silica minerals. The transition from amorphous opal to more crystalline forms such as quartz is a well-documented process in the geological literature, and the data from this study support the hypothesis that chalcedony samples in this district probably formed in a dynamic hydrothermal environment where temperature fluctuations and varying chemical compositions influenced the crystallisation process (Götze et al., Reference Götze, Möckel and Pan2020).
Paramagnetic resonance properties
Magnetic properties can be discussed as follows: (1) The strong magnetic backgrounds observed in Fig. 13a can be linked to the presence of magnetic minerals such as magnetite, hematite and goethite, as identified through XRD and other methods. (2) The presence of silicon-vacancy hole centres and other radiation-induced defects shown in Fig. 13 can be compared to the U and Th concentrations in these samples (e.g. Götze et al., Reference Götze, Gaft and Möckel2015). (3) The sulfur-related radicals suggested in calcite or gypsum in Fig. 13b can be compared to the presence or absence of these minerals as impurities in specific chalcedony samples (black, lemon yellow and blue). (4) The Mn2+ spectra observed in kaolinite, carbonate and purple chalcedony can be related to their Mn concentrations. For example, the large Mn content in the carbonate host rock might lead to significant dipole-interaction-induced line broadening, as seen in Fig. 13c.
Conclusions
The present study presents mineralogical and geochemical data, including nano-scale analyses of inclusions and paramagnetic resonance, for the ten most common types of agate and chalcedony samples from the Qazdez-Bahamarz district. Field observations suggest that mineralisation occurred both in hydrothermal veins and veinlets and volcanic rock vesicles. The mineral assemblages in chalcedony samples include microcrystalline quartz, cryptocrystalline moganite and opal-CT, whereas quartz veins form interlayer bands within the chalcedony. Trace elements play a key role in the colouration of chalcedony samples in the Qazdez-Bahamarz district, with Mn causing black, Ni contributing to purple, Cr influencing green, Zn responsible for lavender and Fe for red colours. Additionally, the altered host rock is enriched with elements such as Fe, Cu, Zn and Cd, compared to the fresh host rock. Stable isotope analysis revealed smaller amounts of microcrystalline quartz compared to cryptocrystalline quartz. The limited variation in oxygen isotope values suggests a consistent source, probably from hydrothermal fluids, for chalcedony mineralisation in the region. The δ13C values indicate a carbonate phase with an inorganic source. Hydrothermal fluids, probably of slightly low temperature and meteoric origin, play a major role in the mineralisation process. The moganite phase is present in all chalcedony samples, ranging from low to high concentrations, indicating an evaporitic environment. Additionally, α-quartz, goethite and aragonite minerals have formed within the chalcedony phase. Nanostructures in the agate exhibit fibrous, granular and smooth surfaces, with several metal inclusions such as Fe, Cr, Ni, Ti and Sn. The XRD method revealed the presence of opal-C, opal-CT and moganite phases. Nearly all chalcedony samples contain magnetic impurities with a broad magnetic background. Silicon-vacancy hole centres in some samples suggest the presence of U and Th, along with their unstable progenies.
Acknowledgements
The authors are grateful to L.K.L. Chueng (University of Saskatchewan) for conducting the EPR analyses and to H. Norouzi (Mineral Expert at the Gozdaz Purple Chalcedony Mine) for coordinating the fieldwork. They also acknowledge the editor and two reviewers for their valuable and constructive feedback.
Funding
This research was supported by the University of Tabriz, Iran.
Competing interests
The authors declare none.