1. Introduction
For 20 years, whether there exist ‘pollution havens’ – the accumulation of pollution-intensive industries in areas with relatively lax environmental regulation – has been under scholarly debate. Profit-driven pollution-intensive firms seek comparative advantages that may consist of not only less expensive inputs and proximity to markets, but also substantial savings in pollution abatement costs associated with less stringent environmental regulation. The theory of pollution havens is straightforward; however, empirical evidence for their existence is mixed.
Tests of the existence of pollution havens have been conducted in both international and domestic contexts. Many earlier cross-country studies did not find strong evidence for the existence of global pollution havens (Mani and Wheeler, Reference Mani and Wheeler1998) except a few (Xing and Kolstad, Reference Xing and Kolstad1998). Since environmental regulatory stringency is generally more comparable across states or provinces within a country than across countries, and firm-level data and local demographic information for one country are more detailed, examining the existence of domestic pollution havens is a good alternative. Among numerous domestic studies, however, there has not been a consensus on the existence of domestic pollution havens. There have been only a couple of studies investigating developing countries. Mani et al. (Reference Mani, Pargal and Huq1996) provides counterintuitive estimates that environmental enforcement attracts investment in a study of new Indian manufacturing projects; and Dean et al. (2002, 2004, 2005) examined a sample of manufacturing equity joint ventures in China and found that high-polluting joint ventures with partners from Hong Kong, Macao, or Taiwan are deterred by stringent environmental regulation in China, while joint ventures with partners from OECD countries in China are attracted by stringent environmental regulation.
There are several explanations for the varied results of earlier pollution haven studies. Endogeneities may arise in a reduced form model because of unobserved firm or industry heterogeneities that are correlated with regulatory stringency and/or potential reverse causality of capital accumulation on regulatory stringency. Many earlier studies of regulatory impacts on manufacturing plant birth did not address either of these problems, largely due to the constraints of cross-sectional aggregated property flows or the counts data they used. In studies of FDI firms/projects’ location choices (Levinson, Reference Levinson1996; Dean et al., Reference Dean, Lovely and Wang2002, Reference Dean, Lovely and Wang2005), firm-level data are limited to property flow, industrial classification codes, and source countries. Smarzynska and Wei (Reference Smarzynska and Wei2001) examined additional firm-specific characteristics, such as firm size, R&D intensity, and regional experience, but their study provides very weak evidence for regulatory impacts. With better data, recent studies address endogeneity of regulatory stringency with fixed effects, 2SLS, or 3SLS models (Levinson and Taylor, Reference Levinson and Taylor2004; Ederington et al., Reference Ederington, Levinson and Minier2005), or relax distribution assumptions by propensity score matching methods (List et al., Reference List, Millimet, Fredriksson and McHone2003a and 2003b). These studies have found more evidence for deterrent effects of environmental regulation on international trade flows. Yet, there have been no studies on developing countries that provide sufficient support for regulatory impacts, even though developing countries host a fair amount of polluting activities.
Many scholars also attribute the lack of evidence for pollution havens to the relatively small role that pollution abatement costs have in firms’ location decisions. For most US manufacturers in the early 1990s, pollution abatement capital expenditures (PACE) were less than 5 per cent of total capital expenditures (Jaffe et al., Reference Jaffe, Peterson, Portney and Stavins1995). Multiple surveys of US manufacturing firms have suggested that environmental regulations ranked very low among factors influencing plant location (Levinson, Reference Levinson1996). Thus, even though regulation may have an impact, it is not easily discernible from the impact of other factors.
The third major confounding factor in finding evidence for the existence of a pollution haven is that large multinational corporations from developed countries are regarded as sources of advanced technologies and institutional innovations for host developing countries. Several case studies, such as Blackman and Wu's (Reference Blackman and Wu1999) survey of 20 FDI power plants, and Xian and Zhang's (Reference Xian and Zhang2000) survey of 40 European source Trans-National Corporations (TNC's), exalted the potential positive environmental spillover effects for China from foreign investment. They argued that ‘the reasons for these potentials not being fully realized are institutional barriers’ in China. Though insightful, none of these case studies has portrayed the majority of FDI firms. In China, over 95 per cent of FDI firms are small-scale firms.Footnote 1
Huang (Reference Huang2003) argued that the surge of FDI to China was indeed the consequence of the lack of competitiveness and financial capital of small domestic Chinese private firms. Most FDI firms are as small as their Chinese competitors and seek to expand markets by taking advantage of the low prices of inputs and natural resources. Unlike large publicized multinational corporations that consider environmental performance one of their image-building strategies, small firms may not bring advanced, environmentally friendly technologies or managerial expertise to host countries and have little impact on local environmental awareness there (Zarsky, Reference Zarsky1999; Zhang, Reference Zhang2000). A test of the existence of pollution havens shall not exclude these small FDI firms.
China has had the second highest FDI inflow in the world since 1993 (except that China had the largest FDI inflows in 2002). New foreign investment in China provides a good case for testing the existence of domestic pollution havens, and the analysis of FDI can possibly facilitate the understanding of location choices for other types of mobile capital investment in China's pollution-intensive industries. Domestic Chinese firms, especially those local government-owned firms, are not free to move across jurisdictions. But these domestic firms are now getting more and more mobile as economic reform proceeds. They may adopt a location pattern that is similar to foreign-owned firms.
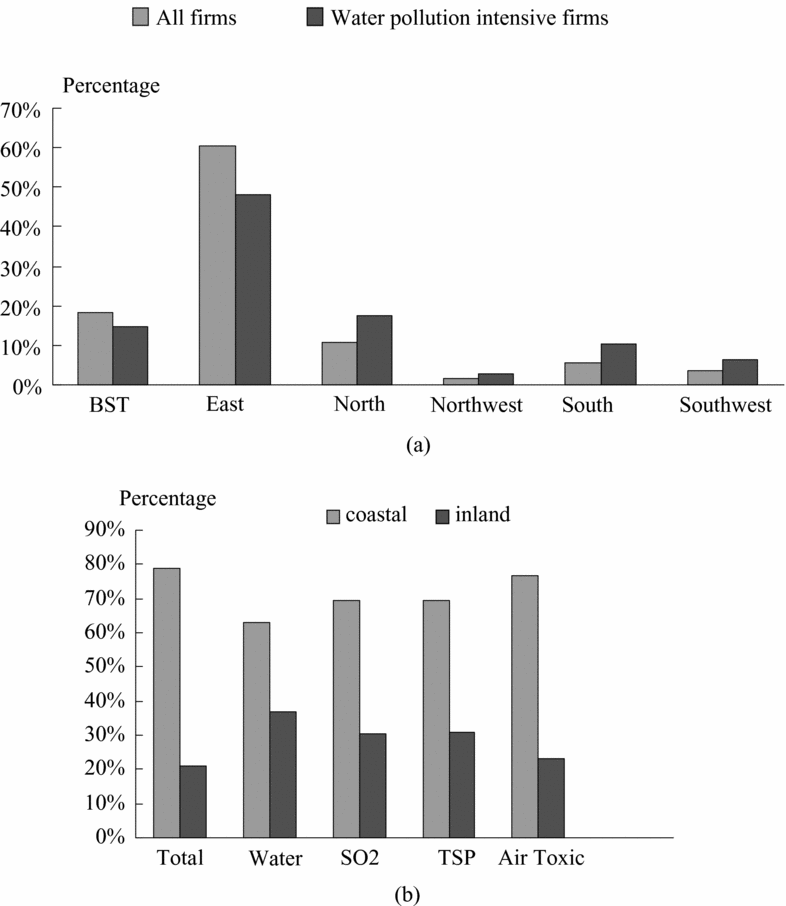
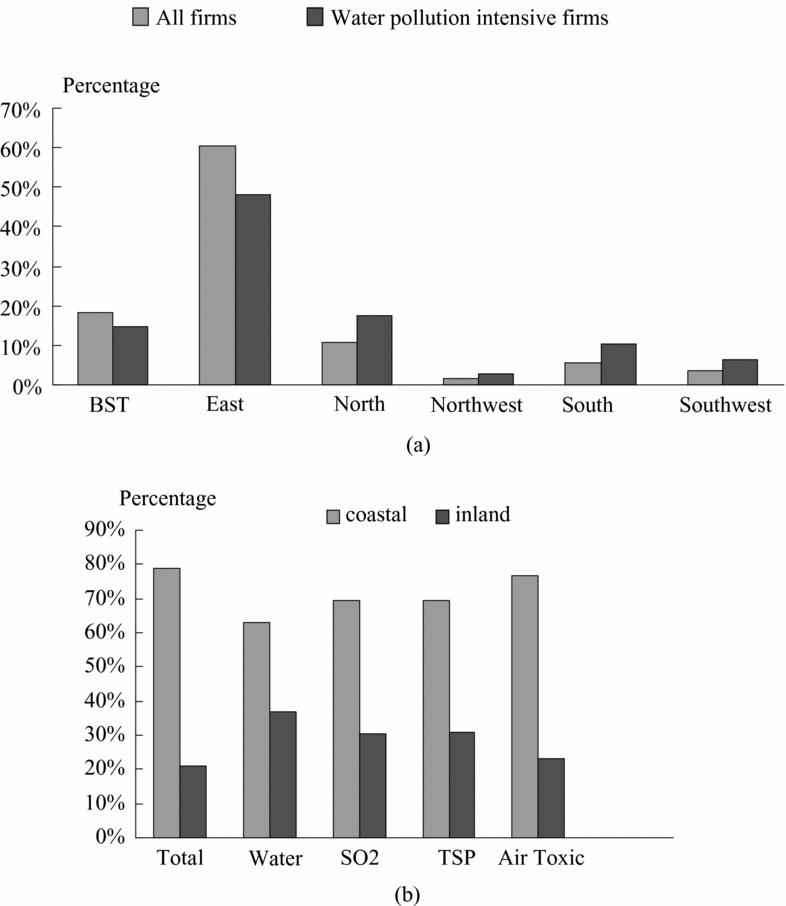
China has 32 provinces that belong to six regions: the East, the North, the South, the Northwest, the Southwest, and BST (including the three provincial-level municipalities, Beijing, Shanghai, and Tianjin).Footnote 2 Most FDI accumulates in the coastal areas – the east region and the three provincial-level municipalities (BST) (figure 1). These regions are economically much more developed than the inland area because they have enjoyed more open policies since the beginning of economic reform in the late 1970s. The inland area (including the North, South, Northwest, and Southwest regions) receives a very small amount of FDI. The darker bars in figure 1(a) indicate the amount of water pollution-intensive FDI firms distributed across regions. The shares of these dirtier FDI firms in all four inland regions are higher than their shares of total FDI. The first pair of bars of figure 1(b) is the share of total FDI between the coast and inland. The rest of the four pairs of bars are the shares of pollution-intensive FDI between the two areas in terms of different types of pollution: water pollution, sulfur dioxide, particulates, and air toxins. As the charts show, coastal regions attract the majority of total FDI, but relatively small shares of polluting FDI. Whether this is partly due to environmental regulatory differences among the provinces requires further investigation.
Comparison of FDI distribution patterns among regions and between areas.
Unlike studies assuming that foreign investors from similar source countries or similar industrial sectors are identical (Levinson, Reference Levinson1996; Dean et al., Reference Dean, Lovely and Wang2002, Reference Dean, Lovely and Wang2004, Reference Dean, Lovely and Wang2005), I calculate potential pollution cost savings and incorporate ownership structure of individual polluting FDI firms to investigate their effects on firms’ location decisions. In the estimation, I relax the assumption of Independence of Irrelevant Alternatives (IIA), and use a nested logit model to examine firms’ two-level choices: first between coastal areas and inland areas, then among provinces in China. Whereas most tests for the existence of domestic pollution havens have focused on US manufacturers, this study employs a unique data set of all FDI manufacturing firms established during 1992–1995 in China, which contributes to the debate from the perspective of a developing country.
Section 2 of this paper presents a model of FDI location that incorporates individual firm characteristics and nests the choices of location. Section 3 lays out the econometric framework by describing the sources of data, construction of variables, and hypothesized effects. Section 4 discusses the estimates from the nested logit model, and compares them with the results from other specifications. Section 5 summarizes and concludes.
2. The model of FDI location
In order to test the existence of pollution havens, we need to examine whether capital providers take into account environmental regulation compliance costs, along with other factors that typically explain location choices when choosing where to locate.
For an FDI firm i faced with J choices of location, suppose that the profit from production at j is given by πij = Zijβ + ɛij, where Zij is a vector of factors that affect firm i’s decision, β is a vector of estimated parameters, and ɛij is the random disturbance. A firm chooses j if locating there yields the maximum profits among the J options. McFadden (Reference McFadden and Zarembka1973) has shown that if the J disturbances are independently and identically distributed with type I extreme value distribution, the probability of firm i choosing location j is 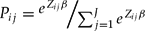 . This leads to the conditional logit model, the most common approach to understanding location choices.
Incorporation of firm characteristics
While location attributes play an important role in attracting FDI, firm characteristics are also essential in the location decision and may correlate with environmental aspects. For example, pollution abatement costs vary substantially among firms with different scales or productivities. High-cost firms may stay away from highly regulated regions and are more sensitive to regulation than low-cost firms. Foreign investor's managerial control in a firm and relationship with Chinese government may affect the bargaining power of the firm with local regulatory agencies, which influences location decision.
In the above model, the profit πij is a function of Zij, which is a vector of features of the location and of individual firms. Let

where X1i is a vector of characteristics of individual firm i, Wi is a vector of attributes of the jth location choice, and X2ij is a vector of attributes of location j that influence the location decision for specific firms. Since one firm's characteristics remain the same for all choices, if directly incorporated in the conditional logit model, they fall out of the likelihood function. In order to identify firm characteristics, one method is to incorporate interactions of choice dummies and the common X1i. For example, List and Co (Reference List and Co2000) incorporated interaction between aggregated industrial pollution intensity and US state dummies when testing environmental regulatory impacts on FDI inflows. This allows the identification of regulatory impacts (measured by industrial pollution intensity) that vary across states. Although a valid approach, incorporating interaction terms of firm characteristics with location dummies becomes impractical for large choice set and multiple firm characteristics.
In this study, incorporating the interaction of 29 provincial dummies with multiple firm characteristics leads to substantial loss in degrees of freedom, and requires the interpretation of coefficients as the impacts of every variable for each province, which is a cumbersome procedure. In order to employ firm-level information, I instead incorporate the interaction terms of firm characteristics with provincial attributes that are continuous variables. This allows for the impact of firm characteristics to be dependent on the variables with which they interact. For example, firm pollution behavior is interacted with the stringency of local regulation. The estimates on this interaction term would suggest how the impact of the pollution behavior on firm's location choice differs with different levels of regulatory stringency in Chinese provinces. Smarzynska and Wei (Reference Smarzynska and Wei2001) take a similar approach by incorporating the product of environmental regime of a country and firm's pollution intensity to identify the ‘composite’ effects. This study incorporates interaction of firm characteristics with not only measures of provincial environmental regulatory stringency but also provincial development status, industrial composition, and ownership structure.
Nesting the location choices
One critical assumption about the conditional logit model is the ‘independence of irrelevant alternatives’. But this assumption usually does not hold. As discussed earlier, China's coastal area and municipalities under direct control of the central government have attracted much more FDI than inland areas. Provinces within the same area may not be perceived to be very different from each other by foreign investors. This suggests the violation of the IIA assumption – the likelihood ratio of choosing one province over another may depend on whether or not other provinces or municipalities in the same area are available. Earlier studies dealt with this by simply incorporating regional dummies or by controlling for the factors that contribute to agglomeration (Levinson, Reference Levinson1996; Dean et al., Reference Dean, Lovely and Wang2002). But these variables only pick up the differential impacts of different regions or particular agglomeration factors, and do not actually address the variance of disturbance. To partly mitigate this problem, I use a nested logit model. Firms’ location decision consists of two levels. First, the firm chooses either coastal open areas or inland areas, and then it chooses one province in the selected area. If k indicates the areas and j indicates the provinces for each individual firm i, the probability of investing in province j is the product of the probability of choosing j, given the choice of area k and the probability of choosing area k

where Zik is a vector of attributes of areas, Iik is the inclusive value, or the measure of the average utility of the alternatives within the subgroup of provinces in the area k, that is
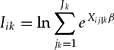
The parameters τk on the inclusive value are allowed to vary, so the heteroskedasticity of the disturbances is partly incorporated. The disturbance variance is allowed to differ across areas but not within an area. Comparing with other unordered discrete choice models that relax the IIA assumption, the nested logit is the most tractable one for problems with a large number of choices.Footnote 3 The feasibility of a nested logit model relies on the availability of regressors that explain choice of area but not the choice of province within an area (Brunnermeier and Levinson, Reference Brunnermeier and Levinson2004). The FDI census dataset contains variables such as firm equity structure, export orientation, and source countries, and these variables can be used to explain choice between coastal and inland areas rather than choice among provinces. Dean et al. (Reference Dean, Lovely and Wang2005) also adopt a nested logit model in their study of joint ventures’ location choices. They use regional averages of per capita consumption, population, and annual real growth to explain FDI joint ventures’ choices among four regions before the firms chose the province in which to locate in China.
3. Econometric specifications
Data description
The data for this analysis mainly come from two sources. The firm-level data are constructed from the Third Industrial Census conducted in 1996 by the State Statistical Bureau of China. The provincial-level socio-economic and environmental data are constructed from China Urban Statistics Yearbooks, China Statistical Yearbooks, and China Environment Yearbooks.
The Third Industrial Census is the most recent industrial census available. It covers the whole population of FDI firms operating in China as of 31 December 1995. The data contain six-digit geographical location codes, four-digit Standard Industrial Classification codes, establishment dates, initial registered capital, size, assets, sales revenue, and exports of the firms. They also contain the administrative characteristics of the Chinese shareholders of the joint ventures. I combine the firm data with environmental regulation and socio-economic conditions of the host province at the establishment year. This study examines only new manufacturing FDI firms established during 1992–1995.Footnote 4
Since many previous studies suggest that only firms in polluting sectors will take into account the pollution abatement costs or environmental regulation when making location decisions, I focus on four industries. Two of the industries, chemical and chemical products (with Chinese SIC code 26, 28, and 30) and pulp and paper (with Chinese SIC code 22), are pollution intensive. Two other industries, measurement or control equipment (with Chinese SIC code 42) and electric equipment (with Chinese SIC code 40), are not pollution intensive.
The pollution-intensive industries are among the top polluting industries in terms of the lower-bound estimate of pollution intensity of air toxic pollutants or conventional water pollutants.Footnote 5 For example, the lower-bound air toxic pollution intensity for the manufacturer of basic industrial chemicals except fertilizer is 845,718 kilograms per thousand employees, and the lower-bound air toxic pollution intensity of the other subsector of chemical and chemical products, the sector of manufacturer of synthetic resins, plastic, and fibers is 681,168 kilograms per thousand employees. They have the highest air toxic pollution intensities among all manufacturing sectors. The water pollution intensity of the pulp and paper industry is 6,585,007 kilograms per thousand employees, which ranks second to the iron and steel industry. Polluting sectors that also rank high in terms of these pollutants or in sulfur dioxide or Total Suspended Particulates (TSP), such as coking and refining, iron and steel, and non-ferrous metals, are highly regulated by the Chinese government. Even though foreign firms invest partly in the establishments, they do not have much freedom to choose where they locate and are therefore not appropriate for this study. The two non-polluting industries were chosen because they are roughly of the same scale as the pulp and paper industry. The sample sizes of pulp and paper, measurement and control equipment, and electronic equipment industries are not as large as chemical and chemical products, but they are on average larger than many other manufacturing industries.
FDI locations
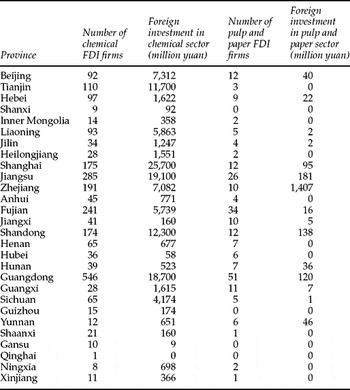
From the geographical identification codes, I construct dummies for the provincial location of the FDI firms. The volume of foreign capital is also available at the firm level and can be used in linear regressions. Table 1 lists the total number of FDI firms and gross flows in each province for the two pollution-intensive sectors. A dummy variable COAST indicates whether the firm locates in coastal provinces or inland provinces.
Provincial inflows of FDI

Provincial environmental regulatory stringency
China has a nationwide pollution levy system with fixed levy rates. Pollution levies are per-unit charges for pollution in excess of the standard. For new polluters that cannot meet the standards and existing pollution sources that cannot meet the standards within a certain period, the unit charge will be higher (Di, Reference Di2000). Following Wang and Wheeler (Reference Wang and Wheeler1996, Reference Wang and Wheeler2005), I use the ‘effective levy rates’ of each province (LEVY) to measure provincial environmental regulatory stringency. The ‘effective water pollution levy’ (LEVYW) for each province is calculated by dividing the levies actually collected on water pollution by the amount of effluent discharges that are not compliant with effluent standards. If the levies were uniformly enforced, we would expect ‘effective levy rates’ to vary little across provinces. However, this is not the case, which suggests that regulatory stringency varies and the ‘effective levy rates’ are a reasonable measure for it.
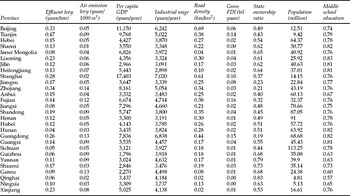
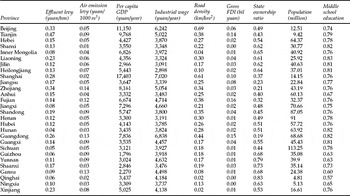
For air pollution, since data on compliance are not available, I calculate the ‘air pollution levy’ (LEVYA) by simply dividing the total air pollution levies by the total emissions of air pollution. This measure does not reflect the policy incentives as accurately as the ‘effective water pollution levy’, because the denominator is not the emissions exceeding the standard (the basis for levy charges) but total emissions; nevertheless, it provides a satisfactory measure for relative stringency of provincial-level air pollution regulation because standards are usually set low in China and non-compliant emissions account for a significant part of total emissions (Di, Reference Di2000). The level of effective water pollution levy rates and air pollution levy rates for each province are listed in the first two columns of table 2.
Selected attributes of Chinese provinces in 1995
The environmental federalism literature has suggested that decentralized local governments tend to set environmental standards lower or implement environmental regulation less strictly to attract mobile capital to local jurisdiction. The possible reverse causality poses questions about the exogeneity assumption behind the reduced form model. However, a recent study using panel data on Chinese municipalities (Di, Reference Di2004) did not find evidence for the ‘race to the bottom’ of environmental regulation driven by the competition for FDI. The interpretation of the lack of systematic influence on regulatory stringency by mobile capital flows is that a large majority of enterprises in China are still not free to move because they are owned by local governments. Although local development necessities in terms of providing basic education, food supply, and social stability may compromise local government's goal of protecting the environment, attracting capital inflows was not yet on the priority list during the earlier stage of reform. I thus still assume full exogeneity of provincial-level regulation and industrial composition in the FDI location model.
As economic reform proceeds with firms becoming more mobile, the exogeneity assumption may not hold any more. Then we will need panel data with time variation in stringency to identify regulatory impacts and instrumental variables to isolate the effects of regulation on capital flows. Nevertheless, when simultaneity exists, it will only bias downward the estimates of deterrent regulatory impacts (Brunnermeier and Levinson, Reference Brunnermeier and Levinson2004). As long as the coefficient estimates of regulatory stringency are negative in the reduced form model, they still suggest the existence of pollution havens.
Other provincial attributes
Seeking large markets and low-cost inputs are found to be two main reasons for FDI firms to establish plants in a particular location (Shatz and Venables, Reference Shatz and Venables2000). ‘Market-oriented’ FDI firms serve mainly local markets in host countries, and would choose their locations based on factors such as market size, distance to markets, or transportation costs to markets, whereas ‘cost-oriented’ FDI firms are looking for raw materials, cheap labor adjusted for quality, or lower regulatory costs (Lim, Reference Lim2001). Since both types of firms are driven by profit maximization motives, there is no clear boundary between the two. I incorporate provincial road density (ROAD), population (POP), and middle school education (EDU) in 1990 to control for transportation convenience, market size, and quality of human capital respectively. The summary statistics are also listed in table 2.
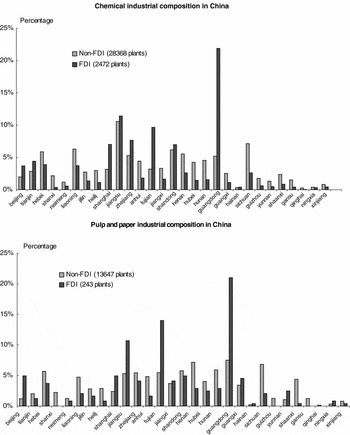
The agglomeration literature has suggested that firms tend to avoid uncertainty by investing in areas with successful earlier entrants. They are likely to cluster in a location with more suppliers, high-quality infrastructure, and favorable fiscal incentives. However, environmental problems may be more prominent and regulation may be more stringent in provinces that are already heavily polluted or clustered with a large number of polluting firms. It is possible that polluting FDI firms may avoid locating in these provinces that have low environmental absorptive capacity. The distribution of FDI established during 1992–1995 and non-FDI plants in 1995 for the two polluting industries is provided in figure 2. New FDI plants are less evenly distributed than non-FDI plants among provinces. Without controlling for other influential factors, there is no obvious similarity in the distribution pattern of the two types of plants. In order to test whether the FDI firms tend to cluster, and whether environmental capacity has a role, it is necessary to incorporate the industrial compositionsFootnote 6 (COMP) as a control variable, despite its indeterminate direction of impacts.
Industrial composition of FDI and non-FDI plants in China.

Another proxy for local environmental capacity is air pollution density (ADENS), which is the ratio of the total amount of air pollution divided by the area of the province. A higher air pollution density implies lower environmental absorptive capacity.
It has been argued that residents in wealthy areas care more about environmental degradation. They may exert pressures for cleaner practice of foreign firms as well. A contradictory argument is that wealthy areas have better infrastructure. They can attract higher quality human capital and therefore absorb more foreign investment, including pollution-intensive investments. In order to isolate the environmental aspects from other agglomeration effects related to development status, I incorporate the variable, per capita GDP (PCGDP), and interact it with firm pollution characteristics in the regressions. Reliable wage data are not available, and government statistics from the yearbooks show high correlation between the wage and per capita GDP. Therefore, I only incorporate per capita GDP and let its direction be determined by empirical tests.
Firm characteristics
In this study, I calculate total pollution abatement costs for each firm by multiplying pollution abatement costs per unit of pollution by employment-based pollution intensity then by number of employees.Footnote 7 I use these costs as a proxy for potential cost savings for FDI firms, because these abatement costs would not have to occur for foreign firms that locate in China and represent the amount those firms may potentially save.
I divide pollution abatement cost savings by sales revenues of the firms to create the abatement cost savings weight (ACSW), which indicates the potential importance of pollution abatement cost in a firm's decision. Then, for firms with the same pollution intensity, the variation in potential abatement cost savings will be exclusively due to the variation in the ratio of their labor input to revenues. This indicator of labor productivity is typically lower for dirtier industries, because dirtier industries are usually more capital intensive and less labor intensive; however, within an industry, firms with lower labor productivity would also be less efficient. They generate more pollution per unit of inputs and have higher potential abatement cost savings. I also create a dummy variable, high abatement cost savings weight (HACSW), by assigning a value of one for those firms with calculated ACSW greater than the median, and zero otherwise. This dummy variable is preferable because ACSW is widely dispersed with extremely small and large values.
FDI inflows to China are mostly from OECD countries or from the three ethnically Chinese economies: Hong Kong, Taiwan, and Macao. Pollution intensity data of source OECD countries are not complete, so I calculate the pollution cost the same way for all firms by assuming that the US estimates are broadly representative at the sectoral level, i.e. the average pollution abatement costs of facilities established by investors from all foreign countries are the same as those by US investors. For OECD countries, regulatory stringency is similar, but for Hong Kong, Taiwan, and Macao, there is not much evidence supporting this assumption. I thus incorporate a dummy variable, HTM, to indicate firms from the three ethnically Chinese economies, by assuming that these economies are similar to each other in terms of environmental regulatory stringency relative to the US.
Every Chinese firm is owned by some level of government or an individual. In the census database, a typical FDI firm is a joint venture of a foreign investor and its Chinese partner. Even a wholly owned foreign firm is still administered by a certain level of the Chinese government. Therefore each FDI firm is associated with one of the seven categories of government affiliation, according to the level of its Chinese partner (indicated by a variable GOV): central government, provinces, prefectures/municipalities, counties, districts, townships, villages, and ‘others’. Following Huang's (2003) identification, ‘others’ refers to the partnership with a private firm. This government affiliation of the Chinese partners of FDI firms may influence the behavior of the FDI firm in many ways. The FDI approval authority is highly decentralized from the central to local governments. When foreign firms start to invest in China, they are cautious about the risk of seeking business partners. There is a trade-off between the autonomy and flexibility of private ownership and the support of government agencies and fiscal favors by state ownership. This political hierarchy may also affect the bargaining power of the FDI firms. Local environmental regulation may have limited influence on firms with strong connections to the government.
Interaction of provincial attributes with firm characteristics
As discussed in section 2, individual firm characteristics have to be interacted with provincial attributes in order to be identified in a nested logit model.
Although Chinese law requires that foreign investors must abide by Chinese environmental laws and regulations,Footnote 8 to what extent the cost savings are realized still depends on the variation in local environmental regulation among provinces. One meaningful interaction would be dividing the potential firm pollution cost savings by the effective levy rates. Other things equal, firms with higher adjusted weight of potential cost savings would choose to locate in a province with more lax environmental regulation.
Similarly, potential firm pollution abatement cost savings are also interacted with industrial composition and development status, so as to isolate the cost saving impacts from agglomeration of industries and allow the estimates of cost-saving impacts to vary with environmental capacity and the demand for environmental quality.
In order to test how the firm affiliation with local government influences the location choice, I multiply the level of Chinese venture partner affiliation with government (GOV) by the percentage of state-owned enterprise output in the total outputs of that province (STATE). Being affiliated with higher level government, FDI joint ventures may obtain more administrative support. The effectiveness of the affiliation depends on whether local governments intervene in business in that province. Government interference is measured by provincial-level state-owned output share. A positive coefficient on the interaction term implies that the propensity of locating in a particular province increases as the firm has a higher government affiliation. Since the advantages of maintaining a good relationship with local government may include better enforcement of business contracts, short government approval process, and lenient regulation, this variable is not necessarily specific to pollution-intensive firms.
Interaction of regional dummy variable and firm characteristics
Several firm characteristics are interacted with region dummies, in order to explain the choice between the two areas (or the nests) rather than the choice among the provinces. Firms with higher foreign equity share (FES) and export orientation (indicated by export share in total revenues, EXSHR) may tend to locate in coastal areas to be close to other countries or ports. Investors from Hong Kong, Taiwan, or Macao (HTM) may choose a location closer to their homes.
Empirical model
The empirical model takes the following form. The probability of choosing to locate in one province given the choice of coastal or inland area is

The probability of choosing between coastal or inland area is

where ICOAST and IINLAND are the inclusive values for each area. The probability of the ultimate choice of a certain province is the product of the two probabilities described above

The coefficients are estimated by maximizing the full log-likelihood for the nested logit model.
4. Results and discussion
Estimates of nested logit model
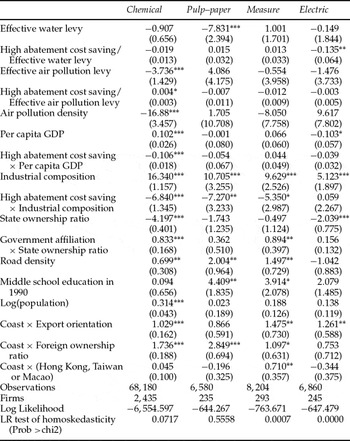
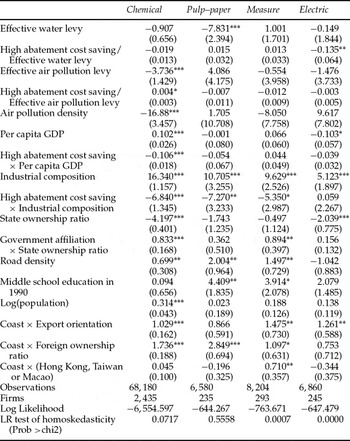
Table 3 presents the nested logit regression results of the four chosen sectors, using high abatement cost savings weight (HACSW) as one of the explanatory variables.
Estimates of nested logit models
Notes: Standard errors in parentheses.
* significant at 10%; ** significant at 5%; *** significant at 1%.
The coefficient estimates only indicate the statistical importance of the variables in the location decision, and not the magnitude of marginal effects. One way to interpret the size of the coefficients is to compare the elasticity of the propensity with respect to the change in certain variables.Footnote 9 The elasticity can be computed by averaging the individual sample values. The elasticity is associated with each province for each explanatory variable. In this particular study, since the elasticity is associated with interactions or ratios of variables (with different standard deviations), they are not comparable across models. Therefore, the elasticity of selected variables were computed but are not reported here. The following discussion will still be focused on the coefficient estimates. Only the question of whether the domestic pollution haven exists is attempted, no inferences can be drawn beyond the statistical significance.
As shown in table 3, the location choices of FDI firms in the chemical industry, which ranks the highest in terms of air toxic pollution, are responsive to the air pollution levy rates. The location choices of FDI firms in the pulp and paper industry, which ranks amongst the highest in terms of conventional water pollution, are quite responsive to the effective water pollution levy rates. Chemical plants also create water pollution, but the coefficient is not statistically significant, although it has the expected sign.
The coefficient on high abatement cost savings weight adjusted by air pollution levies (HACSW/LEVY) is positive and statistically significant as expected for the chemical and chemical products industry, which suggests that location of chemical firms depends on the realized pollution abatement costs. For FDI firms in the pulp and paper industry, the coefficient on the interaction term is not significantly different from zero, which implies that the effective water pollution levy has an overall deterrent impact on the pulp and paper industry, but the impact is not firm specific.
Neither the pollution levies nor their interaction with firms’ potential abatement cost savings have significant deterrent effects on non-polluting electric equipment firms or measurement and control equipment firms. The interaction of water levy and high abatement cost saving has a significant negative impact on the location of electric firms (fourth row in column five of table 3). Since the measure of potential abatement cost savings within one industry is an indicator of labor productivity, the estimate indicates that the negative effects of low productivities on location of an electric firm are larger in a province with more stringent environmental regulation. This may be due to the positive correlation of environmental regulatory stringency with regulations that encourage competition among foreign firms in the electric equipment industry. An inefficient firm may be more sensitive to competition. This suggests that potential pollution cost saving is not necessarily a specific measure for environmental costs, even though it correlates with resource use efficiency and pollution generation of a firm.
Controlling for per capita GDP, the coefficient on its interaction with high abatement cost savings weight (HACSW) is negative and statistically significant for the chemical and chemical products industry, which suggests that among the chemical firms, relatively dirtier ones tend to locate in less developed provinces. For pulp and paper industry, the coefficient on per capita GDP interacted with high abatement cost savings weight (HACSW) has the expected sign, but it is not significantly different from zero.
The interaction of industrial composition and high abatement cost savings weight (HACSW) is negative and statistically significant for both chemical and paper industries, which implies that firms that are more concerned with pollution abatement costs avoid locating in a province with many firms in similar industries. Its coefficient for the measurement and control equipment sector is also negative. Again the explanation could be that low productivity measurement and control equipment firms tend to avoid competition with a lot of similar firms.
The interaction term of government affiliation and ownership is positive and statistically significant for both the chemical and measure and control equipment industries, which suggests that the higher the bargaining power, the more likely a firm will choose to locate. Seeking government support may be associated with advantages other than regulatory leniency, and therefore not necessarily specific for pollution-intensive industries.
Overall, the estimates for chemical and chemical products industries have borne out the hypotheses about pollution havens. The pulp and paper industry responds to effective water levy, but the effect does not vary significantly across different development status. Since there are many fewer pulp and paper FDI firms (2,435) than chemical and chemical products FDI firms (235), the difference in sample size may explain the difference in the precision of the estimates for these two pollution-intensive sectors. The two non-polluting sectors do not respond to environmental regulation according to the estimates.
Test of IIA assumption
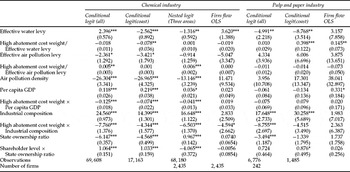
Table A1 in the Appendix is the comparison of results from different estimation methods for the two pollution-intensive sectors. Most of the conditional logit estimates have the same signs as those of the nested logit estimates, except for the coefficient on effective water levy for chemical FDI – it is negative and significant for the sample of the coastal provinces (column three, table A1); however, it is positive and significant for the whole sample (column two, table 3). The difference in the magnitude of these two sets of estimates also suggests the possible violation of the IIA assumption.
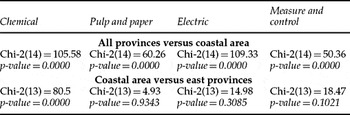
Table 4 reports the results of McFadden–Hausman IIA specification tests. The null hypothesis for the test is that the conditional logit estimates are not different with or without including the inland provinces. The small p-values indicate that between coastal open provinces and the inland provinces, the IIA assumption is weak for all four manufacturing sectors. It is therefore necessary to use a nested logit model to partly incorporate the heteroscedasticity of the disturbances. In the post-regression tests of heteroscedasticity, the probability of the critical value from chi-squared distribution being larger than the likelihood ratio statistics for nesting are very small except for the pulp and paper industry. This suggests that for chemical and chemical products, measurement and control equipment, and electric equipment sectors, the null hypothesis of homoscedasticity is rejected.
Results for McFadden-Hausman IIA specification tests

Since the municipalities administered directly under the central government are similar to each other but may differ from other coastal provinces, I did another set of IIA specification tests within the nest of coastal area. The p-values are large at conventional levels for paper, electric equipment and measurement and control equipment industries (results are also reported in table 4). It is therefore not necessary to do a three-level nested logit model for those industries. However, the chemical industry is an exception. Since there are not appropriate variables available to explain the difference between BST and the rest of the coastal area for the chemical industry, I ran a nested logit model that contains three regions in the second level: BST, coastal provinces, and inland provinces. The estimates are listed in column four of table A1. They are similar to the estimates with two regions in terms of statistical significance.
Comparison with other approaches of estimation
Since the values of capital investment of FDI firms are also available, it is possible to implement methods used in other literature to estimate regulatory impacts on FDI firms’ location choices. The estimates by OLS regressions of foreign investment at firm level are reported in table A1 along with the conditional logit estimates. As shown in the fifth column and eighth column of table A1, individual firm flows are not deterred by higher pollution levies; only water abatement cost saving weight adjusted by levy rate has a significant positive sign for the pulp and paper industry. Compared with nested logit model, FDI firms seem to be more responsive to environmental regulation when choosing whether to locate than when choosing how much to invest.
Not unlike previous studies of OLS estimates of FDI flows aggregated at the state or provincial level, the estimates based on aggregate foreign investment at provincial level did not provide any evidence for pollution levy impacts. Poisson regression using aggregated counts at provincial level suggest expected deterrent impacts of pollution levies on FDI firm location, but the coefficient estimates of other variables are counterintuitive. These estimations using aggregate data at provincial level are obviously inferior to analyses incorporating firm characteristics. The results are therefore not reported but available upon request.
Among all these empirical approaches, the nested logit model is preferable. It not only incorporates provincial as well as firm information, but also accommodates the deficiency of the conditional logit model and addresses location decisions directly with the discrete choice model.
5. Conclusions
Numerous studies have tried to estimate the environmental regulatory impacts on industrial location, internationally or domestically. The picture has become clear in recent years. Stringent environmental regulations are found to have deterrent effects on the location or growth of polluting industries (Jeppessen et al., Reference Jeppessen, List and Folmer2002; Keller and Levinson, Reference Keller and Levinson2002; Brunnermeier and Levinson, Reference Brunnermeier and Levinson2004).
Most of the empirical tests use US data. Studies on developing countries have provided counterintuitive or mixed results (Mani et al., Reference Mani, Pargal and Huq1996; Dean et al., Reference Dean, Lovely and Wang2002, Reference Dean, Lovely and Wang2004, Reference Dean, Lovely and Wang2005), while this study attempts to provide some evidence of influences of institutional and regulatory factors by exploring FDI firm locations among China's provinces. I use a nested logit model partly to accommodate the dependence among different alternatives in the firm's choice set. In the analysis, I incorporate FDI firms’ characteristics, including their pollution behavior and their bargaining power with the local government. The individual firms are thus allowed to differ from each other, and are not considered identical even if they are in the same sector or from similar resource countries as assumed in empirical tests of the existence of pollution havens using similar approaches (see Levinson, Reference Levinson1996; Dean et al., Reference Dean, Lovely and Wang2002, Reference Dean, Lovely and Wang2004, Reference Dean, Lovely and Wang2005).
The results show that pollution-intensive FDI firms are responsive to higher pollution levy charges, while non-polluting FDI firms are not. Less developed provinces and provinces with a lower concentration of the same polluting industries attract the relatively dirtier firms. FDI firms tend to locate in provinces where they can have more bargaining power with local governments. These all suggest the existence of domestic pollution havens in China.
It would be useful to summarize the caveats of this study to promote further investigation. As in many other empirical studies of developing countries, firm-level pollution abatement cost data in this analysis are computed based on a crude approximation using US manufacturer's pollution abatement costs and averaged pollution intensities from many countries. Although the variables are constructed only as proxies for the potential abatement cost savings, the validity hinges on the strong assumption of the proportional relation between the foreign firms’ pollution across industrial sectors inside and outside China. Ideally, analyses would employ firm pollution and abatement cost information directly from the country being studied.
As for the empirical approach, although the nested logit model has advantages over other specifications in analyzing the location choices, the interpretation of coefficient estimates or elasticities cannot provide magnitudes of the regulatory impacts comparable with other studies. In addition, like many previous pollution haven empirical studies, this paper is still based on cross-sectional data. For each firm, the location decision typically takes place only once. Although the analysis incorporates firm characteristics missing in most previous studies, some heterogeneity may still be left out. For example, the source country information is not complete, and it is not clear whether a firm is a subsidiary of a parent corporation. The characteristics of the parent corporation may affect the location decision and may correlate with pollution behavior. A fixed-effects model would be ideal if longitudinal disaggregate flow data are available, and if there is sufficient variation in regulatory stringency over time. The estimation of government support is also subject to scrutiny. Based on this analysis, it is not possible to distinguish whether firms seek bargaining power so that they do not need to comply with environmental regulation or they want to gain other favors. If a firm bargains for lenient regulation, the individual behavior might affect the overall provincial regulatory stringency. As a majority of capital in China becomes mobile, decentralized government may have the tendency to relax regulatory stringency to attract capital. The potential endogeneity may mask the existence of even more significant deterrent regulatory impacts. It is not a concern in this study because the focus here is not the magnitude of the impacts, but it will be an issue for future investigation when better data are available.
Despite its potential limitations, this study has important policy implications. First, FDI host countries may want to be more critical about the nature of foreign investment, and strengthen relevant environmental regulations on FDI. Pollution-intensive FDI can possibly stimulate local economic growth, but it may also lead to deterioration of environmental quality. Although there are sound economic reasons for the existence of pollution havens, policy makers can only make appropriate decisions when they are aware of both the benefits and costs associated with foreign investments. Uninformed and inefficient trade of environmental quality for capital inflows may be due to an incorrect valuation of environmental damages. The group of people who benefit from capital inflows may not be the same group of people who suffer from environmental degradation, and a compensation system is not yet established. As a consequence, the policy being implemented may not correctly reflect residents’ preferences in host countries of FDI.
Moreover, for any country with diverse regulatory stringency and development status among different regions, it is possible that domestic mobile investment adopts a location pattern similar to that of foreign firms. China's government is currently promoting the ‘Developing the West’ strategy, which encourages investment in the inland and western provinces. As domestic polluting industries are tempted by the new incentives and become more mobile, they will possibly move from coastal areas with more stringent regulation to the vast western regions. The potential consequences of the exacerbation of regional disparity and social instability due to pollution activities warrant further attention of policy makers.
I am grateful for thoughtful comments by the Editors and anonymous reviewers. I would also like to thank Yasheng Huang for generously sharing the data, and Robert Stavins, Dale Jorgenson, Anthony Saich, Euel Elliott, Le Wang, participants of seminars of the Environmental Economics Program at Harvard University (EEPHU) and University of Texas at Dallas for helpful feedback for earlier versions of this paper.
Appendix
Comparison of various models of FDI locations
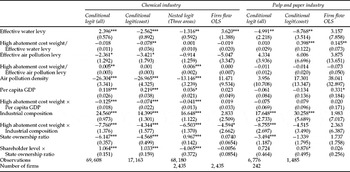
Notes: Standard errors in parentheses.
*significant at 10%; **significant at 5%; ***significant at 1%.