Introduction
Selective government intervention in favour of enterprises can seriously undermine the maintenance of the Single Market project in the European Union (EU), as it may cause distortions that lead to subsidy races, resulting in a waste of public funds. Several Commissioners for Competition, from Mario Monti to Joaquín Almunia to Neelie Kroes, have all underlined how public resources are “wasted by selfish governments making ‘gifts’ to particular firms, interest groups or sectors” (Mause and Gröteke Reference Mause and Gröteke2017). Flagship air carriers such as Iberia (Spain) and Alitalia (Italy) have been recapitalised through public funds multiple times; in the banking sector, Credit Lyonnais in France and the Landesbanken in Germany benefited from government assistance; car manufacturers, steel plants, railways are all recipients of governmental funds, to the detriment of competitors in the same industry. This creates a puzzling situation whereby, despite widespread acknowledgement of the dangers of selective subsidisation, State aid remains common practice.Footnote 1
Governments may disburse aid to encourage economic activity in a region, slow the rate of decline of an industry, maintain the incomes of producers, correct market failures or enhance employment (OECD 2001, 7). Not all governments, though, support business to the same extent. For instance, Germany consistently gives more aid than Britain as a percentage of GDP, and Ireland supports its industries more than Austria does (Chari Reference Chari, Hofmann and Micheau2016). This article investigates variation in the disbursement of State aid among EU Member States to answer the following question: knowing the dangers of selective subsidisation, why do some national governments grant more State aid than others? Answering this question is important because subsidies raise fundamental questions about the effective functioning of the economy and of the Single Market, and because they are a significant – albeit contentious – tool that can be used to achieve policy goals and translate economic support into political support (Zahariadis Reference Zahariadis2002). A better understanding of State aid politics can shed light on several domains such as the retreat of the interventionist state in Europe (Zohlnhöfer et al. Reference Zohlnhöfer, Engler and Dümig2018), the tensions at the heart of the integration process (Smith Reference Smith1998) or the importance of the configuration of the domestic political system in influencing the direction of economic policy (Hall Reference Hall1986; Franzese Reference Franzese2002).
Implicit in the question is the role of political institutions in accounting for different patterns of spending. As Hall (Reference Hall1986, 259) reminds us, economic problems are always political problems, and we must consider the political dimension of economic management to understand why countries pursue certain economic policies. Political actors’ incentives depend on the broad configuration of domestic and international political-economic institutions and structures, which interact to shape economic outcomes (Franzese Reference Franzese2002). Thus, the political-institutional setting in a country may push the government to favour one type of subsidy over the others or may offer politicians even more incentives to engage in wasteful spending.Footnote 2
Further, this question touches upon the two more general topics of responsiveness and accountability. With the former, I want to highlight the use of subsidies as a governmental instrument for the pursuit of a policy goal such as those mentioned above, and the degree to which these goals reflect voter preferences (Break Reference Break1972, 2; Golden and Min Reference Golden and Min2013). As Powell (Reference Powell2004, 91) puts it, democratic responsiveness is what occurs “when the democratic process induces the government to form and implement policies the citizens want.” Responsiveness therefore pays attention to how outcomes affect equity and inequality, that is, when policies and allocations are welfare-maximising, since these are likely to be preferred by the general public (Golden and Min Reference Golden and Min2013). By the latter term, accountability, I mean the possibility for the voters to identify who is responsible for policy decisions and to oust office-holders whose performance they find unsatisfactory (Persson and Tabellini Reference Persson and Tabellini2003, 12). The need for politicians to secure re-election incentivises strategic policy-makers to use policies such as subsidies that can bring large and clear net benefits to voters, thus improving their electoral fortunes (Franzese Reference Franzese2002, 260).
This article has two points of departure. The first one is Herwig Hofmann’s claim that governments give State aid because they are concerned about attaining certain “policy goals” or objectives; because they are electorally pragmatic; and because increasing Europeanisation has curtailed the room of manoeuvre of national governments when intervening in the economy (Hofmann Reference Hofmann, In Hofmann and Micheau2016, 3–4). However, Hofmann does not test these claims, nor has the literature so far attempted to provide an account for how these claims collectively influence aid allocations. Thus, and secondly, this article contextualises State aid within the broader literature on distributive politics and follows the research agenda set by Golden and Min (Reference Golden and Min2013) to attempt a more complete account of distributive politics by joining the two perspectives of responsiveness and accountability. In so doing, it provides a contextual framework within which Hofmann’s three claims can be tested.
My argument is that effective supply of aid allocation depends on how the political-institutional environment affects the responsiveness of government and creates incentives to incumbents for political survival through its electoral institutions. The findings of this article point to incumbents striving to ensure their re-election by engaging in allocative spending, though knowingly constrained by the institutional environment, more than they use subsidies as a means to achieve policy goals. This study offers two main contributions to the literatures on economic policy-making and the determinant of government spending, distributive politics and European integration. First, it tests new hypotheses on how policy-makers’ incentives interact with the domestic and international institutions and structures to shape economic outcomes, as suggested by Franzese (Reference Franzese2002).Footnote 3 Secondly, the article represents one of the first attempts to join the perspectives of responsiveness and accountability to provide a more complete understanding of aid allocation and of distributive politics in a multilevel polity such as the EU.
State aid in the EU
In the EU, State aid refers to “an advantage in any form whatsoever conferred on a selective basis to undertakings by national public authorities” (European Commission 2018b). To qualify as State aid, the measure needs to satisfy four criteria: cost to public resources, economic advantage, selectivity, and effect on competition and trade (Buigues and Sekkat Reference Buigues and Sekkat2011, 11). State aid therefore represents a distributive policy insofar as it involves decisions about allocations of government goods and services to identifiable localities or groups (Golden and Min Reference Golden and Min2013, 74). Such measures concentrate the benefits to narrow recipients while spreading their costs across all constituencies through generalised taxation (Weingast et al. Reference Weingast, Shepsle and Johnsen1981, 643).
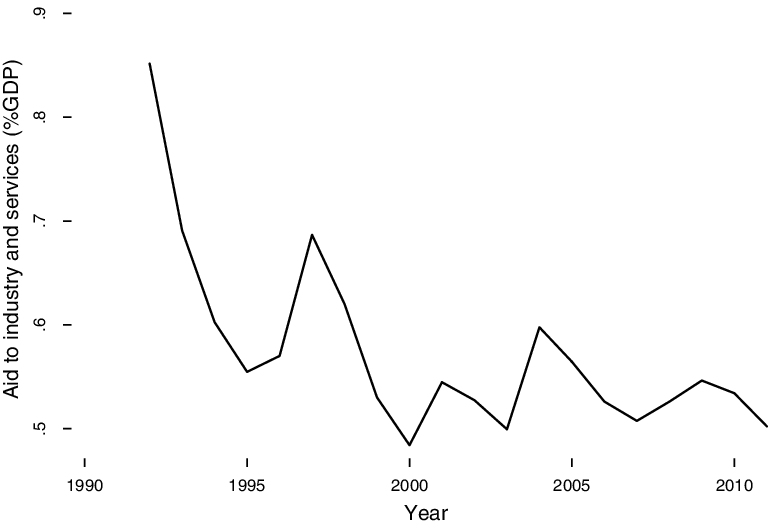
Because of the acknowledged dangers of selective subsidisation to competition in the Single Market, the European Commission’s Directorate General for Competition (DG COMP) is in charge of ensuring Member States rein in aid expenditures. Nonetheless, DG COMP acknowledges that in particular circumstances subsidies may be warranted in order to correct market failures or achieve policy objectives, usually in line with the European agenda (Ferruz and Nicolaides Reference Ferruz and Nicolaides2013). Hence, the Treaties do no abolish all State aid – rather, they provide a framework for the “development of a system for the evaluation of the compatibility of each individual aid scheme” (Lavdas and Mendrinou Reference Lavdas and Mendrinou1999, 50). By means of an economic cost-benefit analysis that weighs the positive social welfare effects of the aid against its negative repercussions (see Coppi Reference Coppi and Szyszczak2011), the Commission can assess the necessity of the measure, investigate allegedly unlawful aid and even require national governments to seek recovery of the monies. This approach has strongly influenced the Member States’ fiscal policies and the room of manoeuvre national governments have at their disposal when allocating subsidies. As an example, aid to the automotive industry declined from ECU 29bn in 1977–1987 to just €1.3bnFootnote 4 in the 2007–2014 period (European Commission 1990, 2014). This trend is reflected in Figure 1, which shows how, between 1992 and 2011, aid to industry and services in the EU-27 was almost halved.
State aid over time in the EU-27 (1992–2011).
Source: DG COMP.

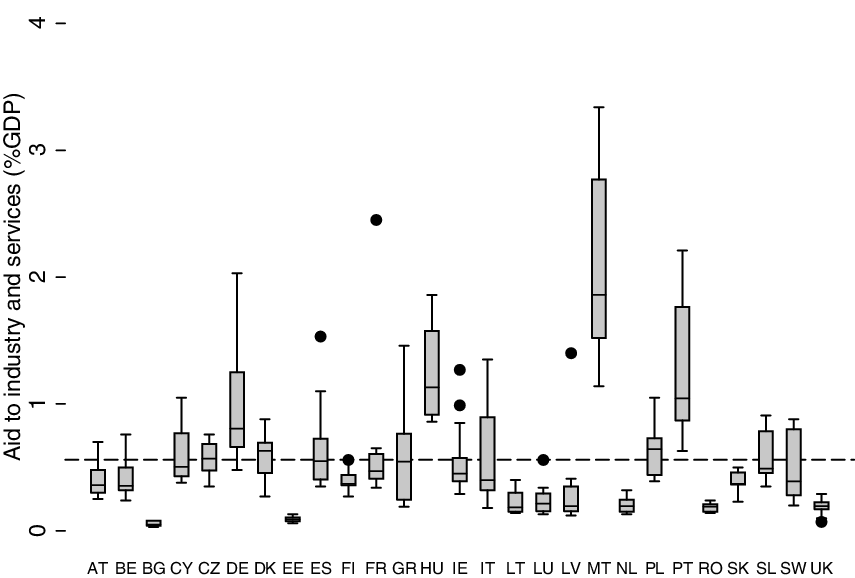
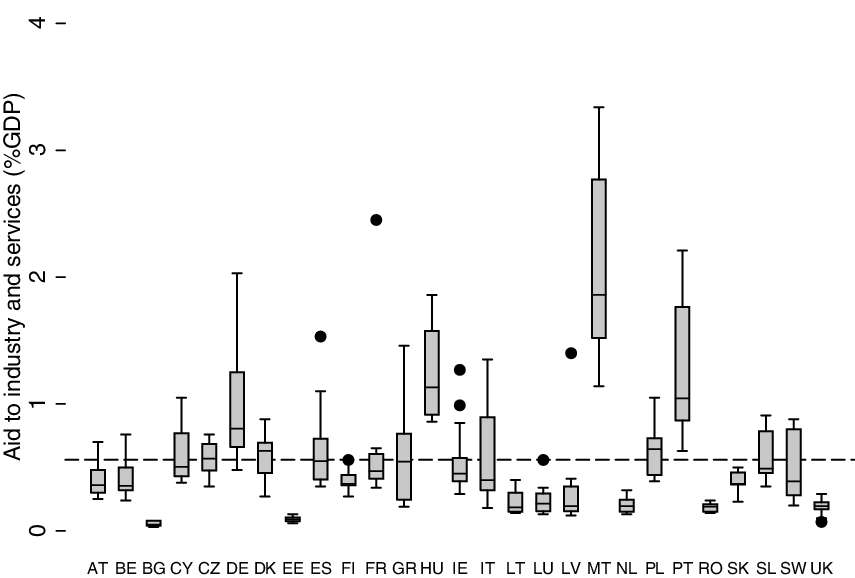
Figure 2, instead, shows variation in aid allocation aid by Member State. In some countries, such as the Netherlands, Estonia and Britain, subsidisation is very low, whereas others like Hungary, Malta and Portugal give on average more than 1% of their GDP in aid. Therefore in some cases, and despite the strict control regime, some national governments in the EU provide sizeable subsidies to companies. The dashed line is the average for all countries over time and sits at about 0.56% of a country’s GDP. Despite an overall downward trend in aid allocation, cross-country variations persist, suggesting that governments do not face similar challenges and pressures, such as globalisation and Europeanisation, in the same way.
State aid by country in the EU-27 (1992–2011).
Source: DG COMP.
In this article, I propose a three-pronged account of State aid politics in which motivations for giving aid are driven by the attainment of policy goals, electoral pragmatism, and domestic and international commitments as suggested by Hofmann (Reference Hofmann, In Hofmann and Micheau2016, 3–4). Following Golden and Min (Reference Golden and Min2013), these claims are tested by putting the concepts of responsiveness and accountability at the core, thus exploring the effect of political motivations on the economic policy output of interest. Such an account should provide a more complete picture of aid allocations. It can help understand whether policy is responsive to the preferences of voters, and under which circumstances the provision of support to specific constituencies is due to electoral considerations that may be independent of considerations of economic efficiency. Further, it shows when domestic (e.g. veto players) and international (e.g. the European Commission) agents have the necessary clout to shape domestic policy-making and the very policy objectives of the government.
Literature review
Governments in the postwar era committed themselves, to varying degrees, to the management of the macroeconomy (Franzese Reference Franzese2002). This involved economic policy agendas including provisions of social insurance for disability, old age or unemployment; provision of public goods and services; and management of the macroeconomy through fiscal and monetary policies. Since the 1980s, however, developed democracies have experienced a retreat of this “entrepreneurial State” (Schuster et al. Reference Schuster, Schmitt and Traub2013; Zohlnhöfer et al. Reference Zohlnhöfer, Engler and Dümig2018; Engler and Zohlnhöfer Reference Engler and Zohlnhöfer2019). Factors like globalisation and Europeanisation pushed interventionist policies like tariffs out of fashion, and deprived national governments of direct control over some economic policies, such as monetary policy in the Euro area. This restricts the room of manoeuvre national governments have at their disposal and forces them to be “creative” to continue supporting national industries (Clift Reference Clift2013). To borrow from Hall (Reference Hall1986), “governing the economy” has become increasingly difficult for national governments. In such a changed environment, where spending is curtailed, political leaders may want to prioritise cost-effective forms of “fiscal protection,” such as subsidies rather than social insurance programmes (Rickard Reference Rickard2012c, 1172). Nevertheless, there is little agreement in the literature over the factors that explain this type of distributive allocation.
Scholars conducting quantitative studies explain variation in aid allocation looking mostly at three variables: globalisation (Zahariadis Reference Zahariadis2001, Reference Zahariadis2008; Aydin Reference Aydin2007; Rickard Reference Rickard2012c); partisanship (Neven Reference Neven1994; Zahariadis Reference Zahariadis2002, Reference Zahariadis2010b; Engler and Zohlnhöfer Reference Engler and Zohlnhöfer2019) or an interaction between the two (Garrett Reference Garrett1998; Cao et al. Reference Cao, Prakash and Ward2007; Hwang and Lee Reference Hwang and Lee2014); and electoral competition (Verdier Reference Verdier1995; Zahariadis Reference Zahariadis2005; Rickard Reference Rickard2012a, Reference Rickard2012b. A fourth variable, Europeanisation, is mostly used in qualitative works to study case-specific interactions between the Commission and the Member States (Smith Reference Smith and Nugent2000, Reference Smith2001a, Reference Smith2001b; Featherstone and Papadimitriou Reference Featherstone and Papadimitriou2007; Zahariadis Reference Zahariadis2010a being an exception). These studies offer different political-economic facets of the puzzle. Significant findings in one area do not invalidate those in another area. Nevertheless, these works fail to offer a comprehensive account of the politics of subsidisation.
Studies on globalisation stress the usefulness of subsidies as a strategic trade policy tool differently. While some scholars support the compensation hypothesis (subsidies as a safety net for the losers of globalisation: Zahariadis Reference Zahariadis2001, Reference Zahariadis2008; Rickard Reference Rickard2012c; Hwang and Lee Reference Hwang and Lee2014; Schmitt and Zohlnhöfer Reference Schmitt and Zohlnhöfer2019), others find evidence in favour of the efficiency hypothesis (increased trade openness pushes governments to find other means to compete internationally: Zahariadis Reference Zahariadis1997; Aydin Reference Aydin2007). In the context of the EU, however, viewing subsidies exclusively as a trade policy tool may be misleading, as they are historically more tied to industrial policy (Hall Reference Hall1986; Amyot Reference Amyot2004). Thus, the subsidies-as-trade-tool argument may be less relevant in the EU context. In other words, studies on globalisation have mostly failed to properly account for the traditional role of the interventionist states within their models of international economic competition.
The “parties-do-matter” hypothesis as formulated by Hibbs (Reference Hibbs1977), instead, has so far found questionable evidence in the State aid literature. Some scholars contend that an interventionist policy like subsidisation, which involves market interference and reallocation of financial resources, should be more common in the presence of leftist parties (Blais Reference Blais1986; Zahariadis Reference Zahariadis1997; Garrett Reference Garrett1998). Engler and Zohlnhöfer (Reference Engler and Zohlnhöfer2019) recently showed that this is true only if subsidies favour the working-class part of the leftist electorate, rather than the middle class, since the former is more affected by the negative consequences of neoliberal policies than middle-class voters are. Others assert that, since subsidies favour producers rather than consumers, they are more likely to be allocated by governments more in line with business interests, usually right-wing ones (Neven Reference Neven1994; Zahariadis Reference Zahariadis2010b; Rickard Reference Rickard2012b). For instance, as Hall (Reference Hall1986, 189, 194–195) shows, France hiked up expenditures on industrial policy under the centre-right Barre government (1976–1981), much of which was aid to specific sectors. Under the leftist Mauroy (1981–1984), instead, interventionist measures took the form of direct welfare to the unemployed, family allowances and health insurance benefits. Nevertheless, several other studies also find a nonsignificant effect for government ideology (e.g. Rickard Reference Rickard2012c; Franchino and Mainenti Reference Franchino and Mainenti2013; Schmitt Reference Schmitt2016), which seems to suggest that governments of either inclination may be interested in using subsidies as a way to achieve policy goals. This article argues that a more promising strategy of looking at responsiveness is not to use partisan theory as a proxy, but rather to be explicit about a government’s willingness to engage in distributive measures.
Finally, the literature finds State aid allocations to be influenced by the incentives that a country’s electoral system offers to incumbents (Aydin Reference Aydin2006; Rickard Reference Rickard2012a, Reference Rickard2018; Franchino and Mainenti Reference Franchino and Mainenti2013). As Verdier (Reference Verdier1995, 3) argues, “politicians maximise their chances of staying in power through deliberate use of subsidies.” There is agreement among scholars in support of the “protectionist bias” of majoritarian politics (Grossman and Helpman Reference Grossman and Helpman2005b): plurality systems, characterised by smaller districts and stronger links between the politician and the constituents (Lancaster Reference Lancaster1986; Persson and Tabellini Reference Persson and Tabellini2000), tend to have higher levels of distributive measures, as politicians can better deliver special benefit programmes, and it is easier for voters to identify who is responsible for these decisions. On a different note, Rogowski and Kayser (Reference Rogowski and Kayser2002) contend that politicians in proportional systems can better deliver such benefits because fewer votes are “wasted”.Footnote 5 Rickard (Reference Rickard2018) tries to reconcile these views by showing that under some conditions, proportional systems may also cater to narrow interests, though her analysis is limited in scope since only subsidies to manufacturing are considered. However, the way these expectations are tested differs widely: from a dichotomous distinction between proportional and plurality systems to the use of institutional differences among electoral systems. The present article looks more explicitly at the electoral rules of the country and particularly the difference in expectations between party- and candidate-centred systems.
In sum, not only are the politics of State intervention important to our understanding of the management of the economy, but a plethora of alternative explanations have been advanced to explain subsidisation. Nonetheless, much of the variation in the results comes down to the samples analysed, which differ starkly in the time frame, number and type of countries, and the dependent variable used. If globalisation- and partisanship-focused studies stress politicians’ responsiveness to societal demands, studies that accentuate the electorally relevant aspect of resource distribution offer an accountability perspective: politicians protect themselves from the consequences of government termination by targeting electorally relevant groups or districts. However, studying accountability before responsiveness is like “putting the cart before the horse” (Golden and Min Reference Golden and Min2013, 75). The desire to retain political office cannot abstract from the issue of whether allocations reflect the interests of voters. At the same time, responsiveness can only go so far, since institutions and the capacities of governments “determine to what extent socio-economic factors exert an influence on the policy output” (Hartmann Reference Hartmann2014, 21). In reality, accountability and responsiveness are two sides of the same coin. As Hall (Reference Hall1986, 271) puts it, “the nature of electoral competition renders the government more or less responsive to certain economic demands.”
This article addresses this shortcoming in the literature by proposing a more complete account of the politics of State aid, based on the democratic policy-making process model by Persson and Tabellini (Reference Persson and Tabellini2003). I put to test and expand Hofmann’s (Reference Hofmann, In Hofmann and Micheau2016) three claims and contextualise them within the domains of responsiveness and accountability, as suggested by Golden and Min (Reference Golden and Min2013). The first claim is that States give aid because they are concerned about attaining “policy goals”, and that these consist of the policies governments pursue and for which they use public resources (Break Reference Break1972). I focus on correction of market failures, for which State aid is particularly suited. A responsiveness perspective investigates the benefits to voters of the aid rather than electoral return, and in particular whether the allocation is preferred by the median voter (Golden and Min Reference Golden and Min2013, 74). This idea follows from the Commission’s own economic approach, whose investigations assess the degree to which subsidies bear positive welfare effects. Absent welfare maximisation in the allocations, Grossman and Helpman (Reference Grossman and Helpman1996) suggest that political capture by special interests, such as industry lobbies, exists. Though this is certainly a possibility, it would be difficult to infer from the present analysis alone that it is the only alternative outcome.
The second claim is that incumbents may be guided by a “desire to improve their chances of re-election by signalling their commitment to supplying public goods” (Dewatripont and Seabright Reference Dewatripont and Seabright2006, 514). Subsidies are one such economic policy that can be employed as a means to political survival for office-seeking politicians (Verdier Reference Verdier1995). The last claim is that the Europeanisation of domestic policy-making has decreased the room of manoeuvre of national governments (Ladrech Reference Ladrech1994; Schmidt Reference Schmidt2002; Featherstone and Radaelli Reference Featherstone and Radaelli2003). Governments steered from direct public intervention to the use of incentives as a tool for regulatory policies, thus making subsidies the most important remaining form of State intervention (Clift Reference Clift2013; see also Lavdas and Mendrinou Reference Lavdas and Mendrinou1999, 122). Hence, the degree to which governments are able to attain certain policy goals such as market failure correction would be conditional upon international commitments. The next section lays down an account of the policy process involving State aid politics.
An account of distributive politics for State aid in the EU
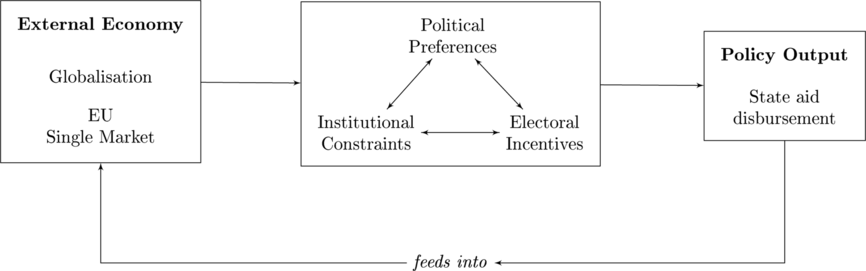
Figure 3 builds on Persson and Tabellini’s (Reference Persson and Tabellini2003, 3) model of democratic policy-making to propose a more comprehensive account of State aid politics. In the figure, the winner(s) of the electoral competition want(s) to implement the preferred policies and may use State aid to achieve particular policy goals. If, for instance, the external economy creates particular economic outcomes that alter the allocation of resources, subsidies are a tool that governments can use to redress the situation. The government will act accordingly to its preferred policy positions (the “political preferences” in the figure), but will be constrained both domestically (i.e. coalition partners and veto players) and internationally (e.g. State aid control) when enacting the preferred measures (the “institutional constraints”). The degree to which the pursuit of these policy goals is able to reflect the interest of voters (particularly the median voter) determines the level of responsiveness of the government (Golden and Min Reference Golden and Min2013).
An account of distributive politics: State aid in the European Union.
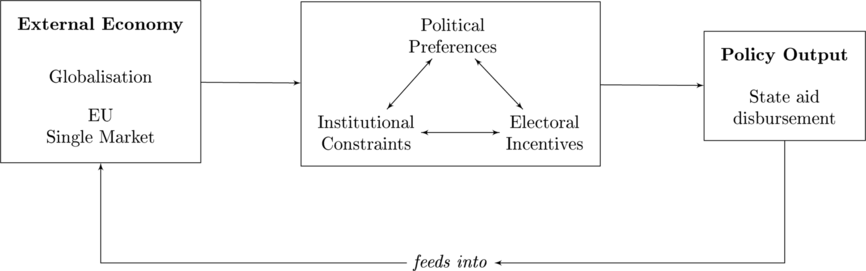
Once we see whether policy is responsive to voters’ preferences, we can ask how politicians benefit electorally from their distributional strategies. In face of government termination, strategic policy-makers will use electioneering, including subsidy spending, to ensure their political survival. Since the support of legislators is essential for the party or coalition of parties in power (Franchino and Mainenti Reference Franchino and Mainenti2016, 414),Footnote 6 different electoral systems may be conducive to different distributional strategies (the “electoral incentives”). Finally, the eventual policy output (the level of subsidies) feeds back into the market by affecting the allocation of resources, thus creating new economic outcomes and demands. In the remainder of this section, I develop four hypotheses generated from the account. The first three address the set of the literature that deals with the responsiveness (or lack thereof) of governments to voters’ preferences, given domestic and international constraints. The fourth hypothesis is based on the literature on electoral competition and explores politicians’ accountability to voters and how they can use subsidies to retain power.
Responsiveness
Following Grossman and Helpman (Reference Grossman and Helpman2005a), I assume that political parties are differentiated by policy goals, which are presented in the electoral competition stage. Here, parties offer a limited set of “ideological packages” from which voters must choose in order to express their views in the political arena (Hall Reference Hall1986, 272). In the realm of economic policy, these “packages” are different insofar as parties have different ideas about how the economy works. The literature identifies parties’ preferences over their goals with partisanship. However, as Rickard (Reference Rickard2018, 53–54) notes, not only do scholars not properly justify how partisanship would affect particularistic economic policies, but also since all governments face demands for subsidies, both left- and right-wing parties may be willing to engage in spending. To overcome this issue, first I focus on one particular policy goal, correction of market failures; and second, I understand these preferences to be about a government’s willingness to disburse aid to address these failures, regardless of the broader partisan standing. This strategy brings two advantages. First, it allows to properly ask whether the subsidy is welfare-maximising, as suggested by Golden and Min (Reference Golden and Min2013), and therefore whether the policy is responsive to voters’ preferences. Secondly, in so doing, responsiveness with respect to correction of market failures is independent of other general goals of the parties in government and can be analytically distinguished in presence of the so-called “overlap issues” (Chari and Cavatorta Reference Chari and Cavatorta2002) – that is, when aid disbursement is conditional to other measures such as mergers or privatisation, which is rather common in the EU context.
Democratic responsiveness requires a positive association between public support for a policy and the likelihood of the policy being adopted (Gilens, Reference Gilens2012, 70). As Thomson et al. (Reference Thomson, Royed, Naurin, Artés, Costello, Ennser-Jedenastik, Ferguson, Kostadinova, Moury and Pétry2017) put it, “if parties channel societal demands into government policies effectively, there should be a substantial level of congruence between the policy content of their election programmes or manifestos and subsequent government policies.” In this case, the policy goals, the intended recipients and the actual recipients of public allocations should align, and the enacted policies can be said to be preferred by the median voter (Golden and Min Reference Golden and Min2013, 74, 87). This suggests that, regardless of the electoral rules, during the electoral competition there exists a link between the committed ideological position of the parties (i.e. the alternatives they offer) and the median voter (Huber and Powell Reference Huber and Powell1994; Kang and Powell Reference Kang and Powell2010).
In a majoritarian system, a simple Downsian model of electoral competition suffices. In such a model, two political parties compete and “formulate policy in order to win the election, rather than win elections in order to formulate policy” (Downs Reference Downs1957, 28). In their quest to gain the highest number of votes, electoral competition will lead to the expectation that the party closest to the median voter will receive a parliamentary majority (Kang and Powell Reference Kang and Powell2010). In a multiparty system, things get more complicated. A variety of alternatives is offered so that all voters can find compatible parties. Parties, however, will converge towards the centre only if voters are located very close to it (Huber and Powell Reference Huber and Powell1994, 299). Multiparty systems seldom offer a clear winner in the electoral competition, meaning that coalition bargaining at the government formation stage becomes necessary, but also that coalitions will likely integrate the party closest to the median position (Blais and Bodet Reference Blais and Bodet2006, 1245).Footnote 7
Despite its simplistic assumptions and shortcomings,Footnote 8 the Downsian model of electoral competition forces us to consider cases when policies are “patently at odds with the preferences of the median voter” (Golden and Min Reference Golden and Min2013, 87). Since the median voter’s income is below average (Meltzer and Richard Reference Meltzer and Richard1981; Franzese Reference Franzese2002), such policies should favour below-average incomes (Golden and Min Reference Golden and Min2013, 90). When the policy goal is to correct market failures due to the outcomes of the external economy, which induce redistribution in resource allocation, subsidies are a good indicator of government responsiveness and of whether they are welfare-maximising. As van Buiren et al. (Reference van Buiren, in ‘t Veld and van der Voort2019) show, in the presence of market failures, using subsidies may be more appropriate than generally considered because of State aid’s welfare-improving capacity. The median voter theorem offers a “natural benchmark” against which to assess policy distortion of allocative measures. If this is the case, then the government would be said to be responsive, at least with respect to correction of market failures. Hence, it would be in the interest of the governing parties that their election promises be translated into policy outputs.
H1: State aid is higher when the political preferences of a domestic government signal its willingness to undertake distributive measures.
The voters, however, recognise that while the campaign promises may influence the subsequent legislative deliberations, they do not fully bind the actions of the elected politicians (Grossman and Helpman Reference Grossman and Helpman2005b, 1240). Domestic and international institutional factors can affect a government’s ability to undertake the preferred policies. Particularly, in systems where coalition bargaining is a necessity and parties are forced to compromise, the policy sets that the parties presented before the election will ultimately not govern the voters (Hartmann Reference Hartmann2014, 47). The presence of multiple parties in coalition governments and of veto players whose agreement is necessary for the policy to be finalised can dilute a government’s partisan influence on public policy (Tsebelis Reference Tsebelis2002; Franzese Reference Franzese2010; Hartmann Reference Hartmann2014). For instance, in the presence of coalition governments, the partners “must be able to overcome the inherent tension between their collective interest in mutual accommodation and their individual incentives to pursue their particular policy objectives” (Martin and Vanberg Reference Martin and Vanberg2011, 4, emphasis in original). Coalitions also create a “common pool resource” problem in budgeting the fact that parties in a coalition government can be held separately accountable provides “reasons for each to push for spending on priorities that its constituents favour” (Martin and Vanberg Reference Martin and Vanberg2013, 953). The severity of these common-pool problems further increases the number of effective policy-makers, as more voters must divide credit for delivering benefits (Franzese Reference Franzese2010, 348).Footnote 9
The presence of veto players, instead, constrains the leeway of governments to implement their desired policies due to the need to compromise with other actors (Hartmann Reference Hartmann2014, 78). The basic premise is that governments as agenda setters strive to implement their favoured policies, but that they need to deal with veto players, since they are by definition actors “whose agreement is required for a change of the status quo” (Tsebelis Reference Tsebelis2002, 17). All veto players generated by the constitution are considered to be institutional veto players, while partisan veto players are generated by the political game (i.e. coalition partners). While veto player theory does not make any predictions regarding the levels of policy output (but rather only the probability, pace and magnitude of policy change), it allows to test for the potential for policy gridlock (Franzese Reference Franzese2010, 344). Theory suggests that in the presence of many veto players, governments adjust less swiftly to economic shocks (Franzese Reference Franzese2002, 268), which might indirectly affect the level of allocations that a government is able to carry out due to the reduced policy-making manoeuvrability. The veto player function is calculated looking at the number of veto players, their maximum ideological distance and the coherence of individual veto players (Tsebelis Reference Tsebelis2002; Jahn Reference Jahn, König, Tsebelis and Debus2011). A high number of ideologically distant veto players may prove detrimental to the success of a policy.
A final constraint to the responsiveness of governments is their responsibility towards international commitments (Rose Reference Rose2014). The effective control that governments have in determining the fate of the political community is “circumscribed by a wider context of interdependence” (Kassim and Lyons Reference Kassim and Lyons2013, 16). In particular, the literature on Europeanisation shows how this process re-orients the political and economic dynamics of the EU so that they become part of the organisational logic of national politics and policy-making (Ladrech Reference Ladrech1994, 69). Decision-making at the EU level and its outcomes generate “the economic, institutional, and ideational forces for change in Member States’ policies, practices, and politics” (Schmidt Reference Schmidt2002, 42). The basic idea, therefore, is that the room of manoeuvre for national governments declines the more a policy area becomes “Europeanised”. Since subsidy spending in the EU falls within the area of competition policy, the “first supranational policy in the EU” (McGowan and Wilks Reference McGowan and Wilks1995), government responsiveness may be strongly conditional upon the degree of institutionalisation of the policy. In State aid policy, the Commission “hardened” its regulatory approach since the late 1990s, to the point where it now affects both the total level of disbursement and which type of aid is allocated (Cini Reference Cini2001; Blauberger Reference Blauberger2009).
While the literature (e.g. Neven Reference Neven1994; Obinger and Zohlnhöfer Reference Obinger and Zohlnhöfer2007; Rickard Reference Rickard2012a, Reference Rickard2012b; Franchino and Mainenti Reference Franchino and Mainenti2013) has included these variables as controls when testing for partisan or electoral effects, Hartmann (Reference Hartmann2014) contends that they condition the content of the policy. This prediction, however, has not been tested for the policy output.Footnote 10
H2a: The political preferences of a domestic government on distributive measures are less impactful the greater the number of effective partners in government. This leads to lower State aid.
H2b: The political preferences of a domestic government on distributive measures are less impactful the more numerous and ideologically distant partisan and institutional veto players are. This leads to lower State aid.
H3: The political preferences of a domestic government on distributive measures are less impactful the more the policy area is Europeanised. This leads to lower State aid.
Accountability
After considering whether policy is responsive to voters’ preferences, the account must turn to the question of how politicians benefit electorally from their distributional strategies (Golden and Min Reference Golden and Min2013, 96). In a democratic system, citizens can hold governments accountable for the country’s economic performance. Facing government termination, incumbents will use all available policies to obtain their desired electioneering surges (Franzese Reference Franzese2002, 260). The incentives and capacity for electioneering should vary depending on a country’s electoral rules. Different electoral institutions, such as district magnitude, which determines the number of legislators acquiring a seat in a voting district (Persson and Tabellini Reference Persson and Tabellini2003, 16), create different incentives for politicians to allocate resources. Larger voting districts diffuse electoral competition and induce candidates to seek support from broad coalitions in the population, whereas smaller districts can steer electoral competition towards narrower, geographical constituencies (Persson Reference Persson2002, 887). This is because lower district magnitudes imply fewer votes-to-seats translations, and therefore a more direct tie of the incumbent’s identity to the territorial base (Lancaster Reference Lancaster1986). Smaller districts provide politicians with more incentives to enact distributive measures, since they also foster greater accountability – it is easier to understand who is responsible for what compared to larger multi-member districts, where multiple candidates (possibly from different parties) are elected (Persson and Tabellini Reference Persson and Tabellini2000, Reference Persson and Tabellini2003).
As Carey and Shugart (Reference Carey and Shugart1995) argue, however, district magnitude is only one of several electoral rules. Other key features include the extent to which electoral systems “create incentives for legislators to cast personal votes” (Edwards and Thames Reference Edwards and Thames2007, 340). If such incentives exist, the system is candidate-centred, and incumbents pander to their own constituents; if they do not, the system is party-centred, and candidates curry favours with party leadership in order to obtain a higher place on the party’s list (Rickard Reference Rickard2018, 124). Therefore, in those countries where the electoral system pushes candidates to cultivate a personal vote, the government, whose survival depends on the support of legislators whose incentives may not be aligned with the collective vote of the governing party, may be forced to cater to narrow and geographically targeted interests (Franchino and Mainenti Reference Franchino and Mainenti2016, 414). For instance, analysing subsidies to the French wine sector, Rickard (Reference Rickard2018) finds that individual legislators from a few constituencies were able to successfully lobby the government to support winemakers in their regions, as the French electoral system was conducive to the cultivation of a legislator’s personal reputation, thus catering government goods to narrow geographical interests. Likewise, Golden and Picci (Reference Golden and Picci2008) show how the open-list system in postwar Italy (1953–1994) allowed legislators to channel infrastructure investment to the preferred constituencies.
The literature has found wide support for the importance of cultivating a personal reputation in affecting economic policy outcomes (e.g. Hallerberg and Marier Reference Hallerberg and Marier2004; Edwards and Thames Reference Edwards and Thames2007; Park and Jensen Reference Park and Jensen2007; Crisp et al. Reference Crisp, Jensen, Rosas and Zeitzoff2010; Franchino and Mainenti Reference Franchino and Mainenti2013; Rickard Reference Rickard2018), yet few combine its effects with those of other electoral institutions, namely district magnitude (Edwards and Thames Reference Edwards and Thames2007; Franchino and Mainenti Reference Franchino and Mainenti2013).Footnote 11 When the system is candidate-centred, voters elect directly the person (re-)running for office, and a high degree of accountability between the incumbent and her constituency exists. Incentives to cultivate a personal reputation, therefore, are all the more important when the incumbent needs to distinguish herself from other candidates (Carey and Shugart Reference Carey and Shugart1995, 430). Hence, the more candidates there are (i.e. the higher the district magnitude), the more it becomes important to cultivate a personal reputation. Likewise, incumbents will be more motivated to cultivate a personal reputation when the system shifts from party- to candidate-centred. The effect will be more pronounced for higher levels of district magnitude, as intra-party competition becomes more intense. The impact of district magnitude on aid allocation should therefore be conditioned by incentives to cultivate personal votes and vice-versa.
H4: State aid is positively related to incentives to cultivate personal votes as district magnitude increases, but negatively when district magnitude decreases. Likewise, State aid is positively related to increases in district magnitude when the electoral system is candidate-centred, but negatively when the electoral system is party-centred.
Research design
The hypotheses are tested by means of time-series cross-section regression analysis. The dataset includes 27 EU Member States from 1992 (or date of accession) to 2011, for a total of 381 observations. The dependent variable is State aid to industry and services, operationalised as a percentage of the country’s GDP to take into account the different economic size of the Member States. I use official data from the Commission State aid Scoreboard, which includes all “aid measures to manufacturing industries, services… agriculture, fisheries and transport for which the Commission adopted a formal decision or received an information fiche from the Member States” (European Commission 2018a). Compared to other measures of subsidy spending, such as those of the International Monetary Fund (IMF), World Trade Organisation (WTO) or the Organisation for Economic Co-operation and Development (OECD), the Scoreboard offers three advantages. Firstly, it provides the most encompassing definition, covering multiple kinds of transactions in all economic sectors, whereas the IMF and OECD definitions only cover manufacturing. Secondly, since transfers from the Community budget are excluded in the Scoreboard (unlike in the WTO), issues of endogeneity are avoided. Finally, the EU, compared to other jurisdictions, has a very strict supranational State aid control, managed by DG COMP, which should lower the expectations regarding the influence of domestic factors in subsidisation. As a result, finding evidence of the validity of the politics of State aid policy-making adds theoretical weight to the argument (e.g. Zahariadis Reference Zahariadis2010b, 437). There are two downsides to using the Scoreboard.Footnote 12 First, the data are narrow in geographical scope, which poses limits in terms of generalisability of the findings. Second, since the Scoreboard only includes aid that has been approved by the Commission, the effective allocative values may be higher than what the Scoreboard data suggest. For this reason, I include a robustness check with a different operationalisation of the dependent variable, using OECD data from the REST database.Footnote 13
Policy preferences and domestic institutions
Policy preference is understood as being a government’s willingness to undertake distributive measures to address market failures. These policy goals can be extracted by looking at data from estimated party positions during electoral competition. This choice echoes Persson and Tabellini (Reference Persson and Tabellini2003, 17), whereby economic policy outcomes are determined by the parties’ commitment to their platform, which in turn should reflect voters’ preferences, as argued by Thomson et al. (Reference Thomson, Royed, Naurin, Artés, Costello, Ennser-Jedenastik, Ferguson, Kostadinova, Moury and Pétry2017). Data are taken from the Comparative Manifesto Project (CMP, Volkens et al. Reference Volkens, Lehman, Matthieß, Merz, Regel and Weßels2017), which analyses parties’ election manifestos in order to study their policy preferences. The indicator used here is per402, on “positive attitude to incentives”.Footnote 14 This variable is operationalised as an average government position weighted by the number of cabinet seats each party has, and by the number of months in office of the government for each year.Footnote 15 Higher values suggest more willingness by the government to engage in distributive measures.
I follow Franzese (Reference Franzese2010) and Hartmann (Reference Hartmann2014) in operationalising domestic institutions. Coalition shows the effective number of parties in government, which reflects the common-pool problem coalitions face. Following Jahn (Reference Jahn, König, Tsebelis and Debus2011), Veto players measures the ideological range between relevant political actors on the Left-Right spectrum. Veto players are coalition governments, second chambers and Presidents. It is calculated by looking at which of the three actors are relevant, and what the position on the spectrum is (most extreme positions for coalition partners and median position for second chambers). For instance, in the UK in 2002, the only relevant veto player would be a coalition partner (no President, and upper house not relevant); however, since the Labour governed alone, the score is 0. In the same year, in Portugal, where the President is a relevant policy-maker, but the system is unicameral, there was a coalition government, hence there are only two relevant actors. The range of veto player is found by calculating the difference between their most extreme positions.
Europeanisation
The impact of the EU on national policies is captured by the Regulation variable. Following Zahariadis (Reference Zahariadis2010a), this is a count variable that measures the number of years since Council Regulation 659/1999/EC has been in force. This indicator measures an increase in Commission discretion owing to the Regulation, thus suggesting that the measure has long-term effects (the longer the force, the stronger the discretion, see Zahariadis Reference Zahariadis2010a, 962).Footnote 16 This regulation was the first to codify the State aid procedures and, according to Micheau (Reference Micheau, Hofmann and Micheau2016, 28), it marked “a turning point in the introduction of hard law in the State aid area.” Following the Regulation, average State aid levels in the EU noticeably fell and stabilised around 0.56% of the Member States’ GDP.
Electoral institutions
I use a measure of average District Magnitude for the lowest tier, which is the district or constituency level. In line with theory, it should better capture the accountability link between incumbent(s) and voters. It ranges from 1 to 150 and is therefore logged to minimise the impact of outliers. The Personal Vote index echoes that developed by Carey and Shugart (Reference Carey and Shugart1995), made of three indicators, each taking the values of 0, 1 or 2: ballot (whether party leaders control ballots and ranks); pool (whether votes are pooled across the whole party); and vote (whether votes are cast for a single party). The personal vote index is an average score of these three indicators, following Edwards and Thames (Reference Edwards and Thames2007). The higher the average score, the more candidate-centred the system. A drawback of this operationalisation is that it is impossible to distinguish the individual effect of the ballot (which should have a reversing effect on district magnitude) from pool and vote (which should not). Nevertheless, as Franchino and Mainenti (Reference Franchino and Mainenti2013, 509) note, the three have a tendency to go hand in hand, so what matters to the purposes of hypothesis testing is not so much the value of each, but how much the system is party- or candidate-centred.Footnote 17
Control variables
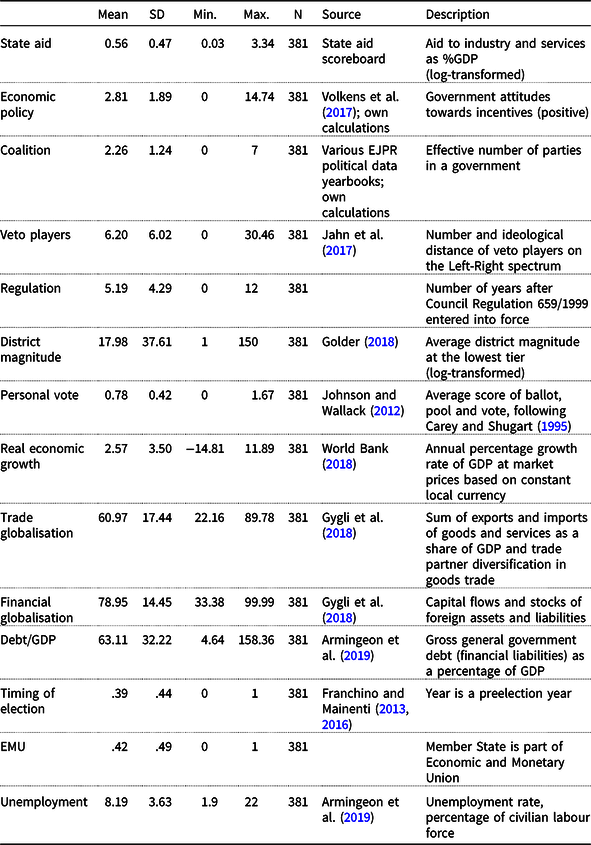
Since State aid has effects on competition and trade in the Single Market and uses public resources, and since subsidisation might be a byproduct of the outcomes of the external economy, I control for socio-economic factors: Real economic growth, Debt/GDP, Unemployment, and Trade and Financial globalisation.Footnote 18 I also control for the Timing of Election, following Franzese (Reference Franzese2002),Footnote 19 since it might affect electoral incentives to disburse aid, as suggested by the Political Business Cycle (PBC) theory (Nordhaus Reference Nordhaus1975). The literature, however, is sceptical about the validity of the PBC on distributive measures and has found little evidence in its support (Neven Reference Neven1994; Zahariadis Reference Zahariadis1997; Aydin Reference Aydin2007; Franchino and Mainenti Reference Franchino and Mainenti2013). Finally, international agreements in particular membership to Economic Monetary Union (EMU) may put further constraints on the ability of countries to engage in distributive measures due to the Maastricht criteria, meaning it might be an ideal indicator to capture a government’s responsibility towards important international commitments. Table 1 shows the descriptive statistics for the variables. Because of the budgetary nature of State aid, political and socio-economic variables are lagged by one year.
Descriptive statistics

Results
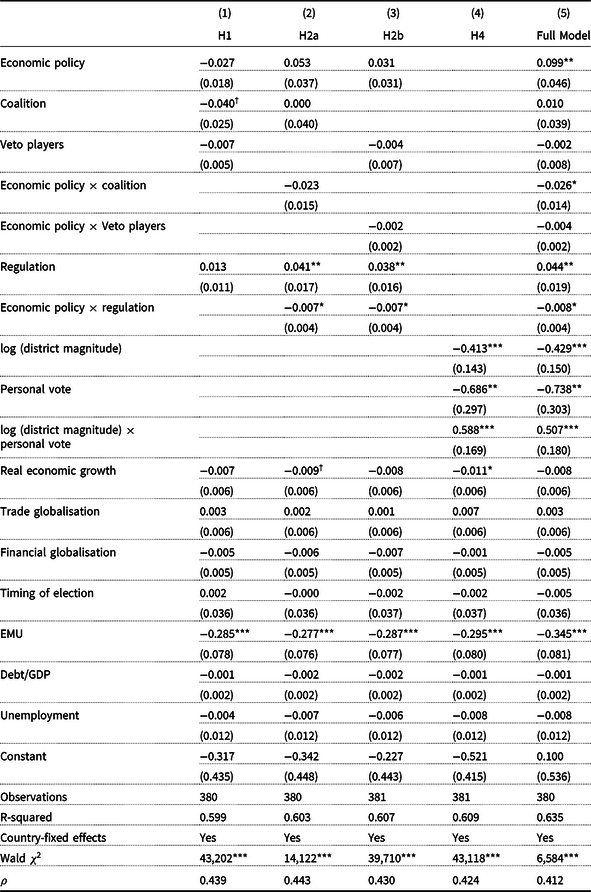
Table 2 presents the results of five regression models. The first three include the responsiveness side of the account. They ask whether allocations reflect voters’ preferences (H1) and whether these are conditional upon domestic (H2a and H2b) and international constraints (H3). The fourth model presents the accountability side by analysing how different electoral institutions can provide varying incentives for policy-makers to use subsidies in an electorally pragmatic way (H4). The last model joins both sides to provide a more complete account of State aid politics. All models include a set of controls as discussed in the previous section. Further, following Brambor et al. (Reference Brambor, Clark and Golder2006) and Berry et al. (Reference Berry, Golder and Milton2012), Figures 4–6 show how the marginal effects for the significant variables in Table 2 change. A more extensive analysis of all interaction effects is available in Online Appendix B.
State aid in the EU27 (1992–2011)
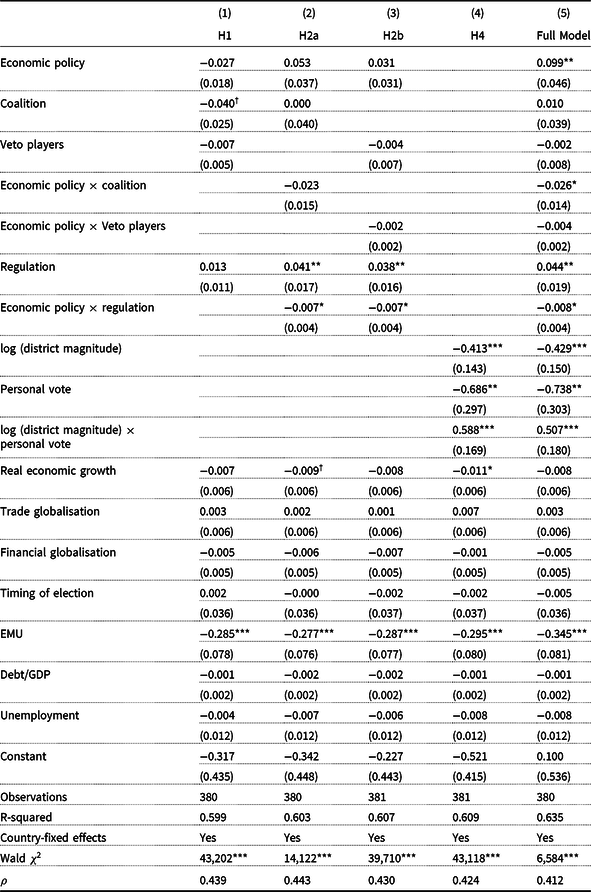
Note: Prais–Winsten regressions with PCSE and pairwise selection; PCSE in parentheses.
***p < 0.01, **p < 0.05, *p < 0.1.
† p = 0.11.
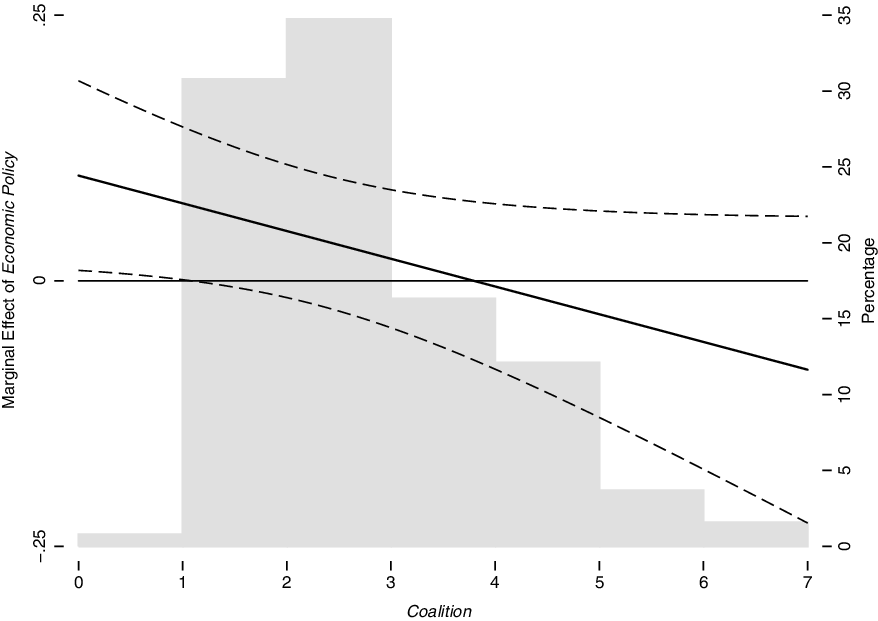
Marginal effect plots for H2a variables on State aid allocation.

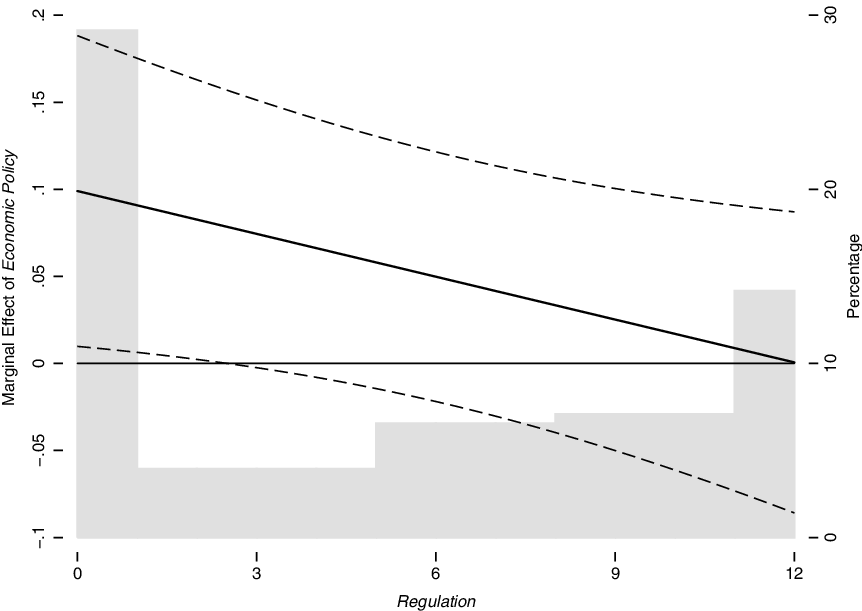
Marginal effect plots for H3 variables on State aid allocation.

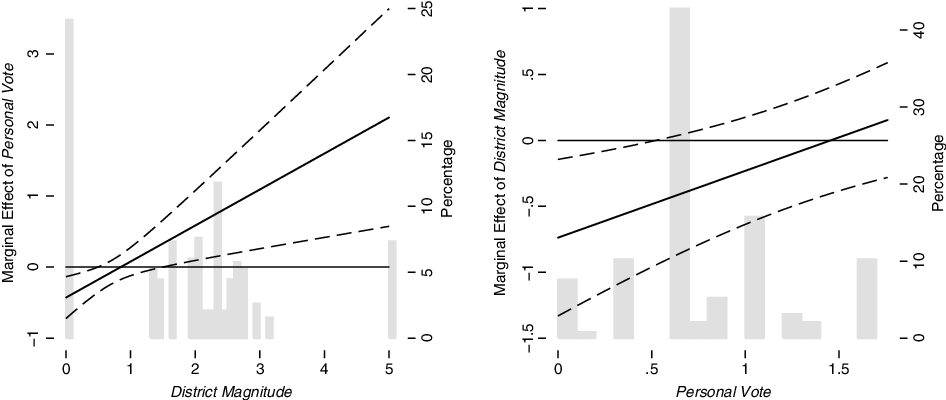
Marginal effect plots for H4 variables on State aid allocation.

The first hypothesis, on the responsiveness of the government to voters’ preferences (H1) is tested separately because it does not assume higher-order coefficients.Footnote 20 Likewise, H2a and H2b, on the effect of coalition partners and veto players, respectively, are tested individually to assess the validity of common-pool problems for collective action against veto player theory, whereas H4 is tested without including variables associated with responsiveness. Following King and Roberts (Reference King and Roberts2015), the dependent variable is log-transformed because of its high skewness.Footnote 21 While this transformation generates a normal distribution curve of the dependent variable, diagnostics of the OLS model still show the presence of heteroscedasticity and autocorrelation. I employ a Prais–Winsten transformation to model autocorrelation and panel-corrected standard errors (PCSE), as per Beck and Katz (Reference Beck and Katz1995), which perform well when the number of years and panels are similar. Further diagnostics reveal that a country-fixed effect model may be preferred over a random effect model due to the potentially high heterogeneity between 27 different political systems, which also raises the bar for confirming the theory (Wilson and Butler Reference Wilson and Butler2007, 106).
The table shows that the full model provides the most promising results, suggesting that an account of State aid politics should indeed look at both sides of the coin. The first model finds no evidence for the responsiveness hypothesis. Parties in government do not seem to act out their policy programmes with regard to correction of market failures. If State aid is granted, it does not, on average, benefit the median voter. While Grossman and Helpman (Reference Grossman and Helpman1996) might suggest that the lack of responsiveness may be due to capture by special interest groups, no such claim can be inferred from this analysis. Another possibility is that polarisation leads to a government composition that does not reflect the median voter (Powell Reference Powell2009), which also highlights the limitation of the median voter theorem.Footnote 22
The table, however, also suggests that this responsiveness may be conditional on the institutional environment in which policy-makers act. H2a, on the conditional effect of coalition partners on policy preferences, gives weight to the common-pool problem coalitions face (at least in the full model).Footnote 23 This impinges not only on the partisan strength of the content of the policies as Hartmann (Reference Hartmann2014) contends, but also on their output. However, less support in this sense is found for H2b, veto player theory (p ≈ 0.13). In other words, the element that matters most is not so much the possibility of deadlock, but the necessity to compromise given limited resources. A higher number of effective coalition partners leads to a decline in the marginal effect of the preferred economic policy on subsidisation by approximately 2.6% for each additional coalition partner.
Figure 4 shows a positive marginal effect of Economic Policy for all values of Coalition until 3.8 (roughly four effective coalition partners), after which the effect becomes negative. However, the effect is significantly different from zero only for values of Coalition up to 1, which represent technical and single-party governments.Footnote 24 This suggests, in line with theory, that single-party governments can better act out their policy programmes as there is no need for compromise with coalition partners.
In terms of international constraints, H3 tests the conditional effect of the impact of Europeanisation on a government’s willingness to engage in distributive measures. For each year since the Council Regulation 659/1999 came into force, the marginal effect of the government’s policy goal in tackling market failures decreases by approximately 0.8%. The effect is rather small and the hypothesis has little generalisability beyond the EU setting. Nonetheless, its general premise that international commitments can change the behaviour of responsive governments holds. This can also be seen in the strong impact of the control variable EMU. Having to comply with the Maastricht criteria on debt and deficit control reduces State aid allocation by almost 35% in the full model.
Figure 5 shows the interaction between Economic Policy and Regulation. The marginal effect of Economic Policy is always positive, though significantly different from zero only for the years where the Regulation is either absent (the 1990s) or still fairly new, for a total of 37% of the observations. The marginal effect of Economic Policy is strongest when there is a low level of regulation, suggesting that State aid control does have a negative effect on the policy goals of governments.Footnote 25 The majority of the observations, however, fall within a nonsignificant confidence interval, which impinges on the strength of the results as presented in the regression table.
Finally, strong substantive correlation in H4, on the effect of electoral institutions, gives much weight to the accountability side of the coin. When district magnitude increases, the marginal effect of casting personal votes on aid allocations becomes positive, as there are more incentives for the incumbent to distinguish herself from competitors and therefore engage in particularistic spending. Likewise, politicians in bigger district will disburse more aid as the system shifts from party- to candidate-centred, since there is a need for the incumbent to distinguish herself from competitors. This effect also seems to be strong: in the full model, the presence of incentives to cultivate a personal vote (higher district magnitude) leads to an increase in the marginal effect of district magnitude (personal reputation) on aid allocation by 51%. The finding is in line with the literature (Edwards and Thames Reference Edwards and Thames2007; Franchino and Mainenti Reference Franchino and Mainenti2013) and provides strong evidence that aid allocation may be driven by electoral pragmatism. However, no support is found regarding the existence of a PBC: politicians do not necessarily engage in subsidy spending to show commitment to their constituency in order to obtain pre-electoral surges.Footnote 26
Figure 6 shows the marginal effects of Personal vote when District Magnitude changes and vice versa. As districts become bigger, if there are incentives to cultivate a personal reputation, this effect leads to more spending in State aid. The effect becomes positive only for multi-member districts, as single-member districts, stacked on the value of 0, are by definition candidate-centred, and the effect is therefore negative. The marginal effect is also significantly different from zero for all values that District Magnitude can assume, providing strong support to the second half of H4. Likewise, when systems shift from party- to candidate-centred, for higher levels of district magnitude, State aid is likely to be higher as politicians will have to distinguish themselves from other candidates. The effect, however, is only statistically significant for low values of Personal Vote – roughly 23% of the observations. For high values of Personal Vote, the marginal effect of District Magnitude cannot likely be differentiated from zero. We can have higher confidence that in party-centred system the marginal effect of District Magnitude will be negative than we could in the positive marginal effect of District Magnitude for candidate-centred systems. Hence, although the regression table shows significant effects in the interaction terms, the plots reveal a more ambiguous account than theory suggests.
Many of the results in Table 2 are confirmed by the robustness checks, more fully discussed in Online Appendix A in the Supplementary Material. Tables A1 to A6 in the Supplementary Material show six alternative dynamic specifications to the models in Table 2 to ensure that the results are not driven by model specification. Table A1 in the Supplementary Material employs a panel-specific first-order autocorrelation coefficient, since the autoregressive process may differ across countries. Results are largely the same and only H2a loses in significance in the full model.Footnote 27 Table A2 in the Supplementary Material retains the Table 2 specification, but lags the dependent variable, which may be warranted if one assumes that the current values of the dependent variable are a function of its prior values. Table A3 in the Supplementary Material adds year-fixed effects to Table 2, which allow for the identification of variation across countries while holding time-variant effects constant. This captures differences in national and international conditions during the sample period (Rickard Reference Rickard2012b, 781). Table A4 in the Supplementary Material includes both year-fixed effects and a lagged dependent variable (LDV), whereas Tables A5 and A6 in the Supplementary Material rerun Table A1 to test for the effect of the LDV without and with year-fixed effects, respectively.
H1, like in Table 2, is never found to be significant. Findings for H3 and H4, instead, hold throughout in the full models. H2a is supported if a LDV is included in Tables A2 and A4 in the Supplementary Material, which speaks to the importance of considering the effect of independent variables over time, as Beck and Katz (Reference Beck and Katz2011, 336) suggest. Interestingly, in Tables A2–A6, H2b is significant, though the effect is always rather small - less than 1%. As expected, the inclusion of a LDV in Tables A2 and A4 in the Supplementary Material provides important explanatory power, but contrary to Achen (Reference Achen2000), it does not suppress that of the independent variables. Rather, as Wilkins (Reference Wilkins2018) argues, the inclusion of the LDV offers an important addition to the data-generating process and increases the confidence in the findings. Tables A5 and A6 in the Supplementary Material bear largely similar results as those presented in Tables A2 and A4 in the Supplementary Material. The only variable that fails to reach statistical significance in the full model is the interaction term for H2a. This suggests that there is likely not much difference between the common and panel-specific autocorrelation specifications. Finally, in most cases, the effect of socio-economic factors fails to reach the standard level of significance and the direction of the effect remains ambiguous.
These results largely support the idea that in a highly interdependent economic environment, institutions matter, as they “refract the effects of world markets and may insulate governments from constituent demands for more public aid” (Zahariadis Reference Zahariadis2013, 149). At the same time, governments seem to value electoral pragmatism and EU rules more than the attainment of policy goals when choosing how to allocate aid. State aid may indeed be a story of pork barrel politics rather than welfare maximisation. Like many other distributive policies, resources are allocated to specific and concentrated interests tied to a constituency, though questions remain to what degree politicians are responsive to special interests more than the median voter specifically.
Table A7 in the Supplementary Material, instead, reruns the Table 2 models with an alternative operationalisation for State aid using OECD data. Since the State aid Scoreboard only includes measures approved by the Commission or for which the Commission has received an information fiche, the effective amount of State aid might be underestimated. These data are far from an effective replacement for the Scoreboard, since they only measure aid to manufacturing (services are excluded) and only include 14 Member States. Notwithstanding these shortcomings, they may still offer useful insights. In Table A7 in the Supplementary Material, only H4 presents results consistent with the main regression, though its effect has largely diminished. H2b, instead, becomes significant, but displays the opposite sign as hypothesised. This suggests that different sectors of the economy may go through different channels of government support. Further, what constitutes an incentive or subsidy as per the CMP seems to be more in line with what the Commission sees as State aid than the OECD definition. It is therefore important to recognise the limitations of the study by being clear about the contextual nature of the analysis and what the dependent variable is actually measuring.
Conclusion
The goal of this article was to provide a more comprehensive account of State aid politics in the EU, by looking in particular at the political-institutional context of the Member States. The starting point of the article was twofold. First, Hofmann’s (Reference Hofmann, In Hofmann and Micheau2016) claim that aid disbursement depends on the government’s ability to achieve policy objectives, on politicians’ electoral pragmatism, and how the EU constrains profligacy in public spending. The second starting point was Golden and Min’s (Reference Golden and Min2013) assertion that a better understanding of allocations requires attention to both the accountability and responsiveness aspects. This allowed for the development of a more complete account of distributive politics for State aid in the EU, through which I could put to test Hofmann’s claims to explain this variation. Overall, the findings support Golden and Min’s claim that it is important to look at both the accountability and responsiveness aspects when studying allocations. The responsiveness framework suggests that governments do not appear to be particularly responsive to the median voter with regard to correction of market failures. However, nothing can be inferred, from this analysis alone, about the relationship between the State and special interests as suggested by Grossman and Helpman (Reference Grossman and Helpman1996). More interestingly, these findings support Thomson et al.’s (Reference Thomson, Royed, Naurin, Artés, Costello, Ennser-Jedenastik, Ferguson, Kostadinova, Moury and Pétry2017) account on pledge fulfilment, whereby the degree to which government policies reflect their commitment to their platform depends on the power-sharing arrangements in place.
The accountability framework, instead, suggests that a country’s electoral rules are key determinants in State aid politics and may be part of the reason why allocations are not welfare-maximising. Questions of accountability can only arise when policy is not responsive to voters. Politicians’ distributional strategies focus on narrow geographical recipients because this would seem to be the winning strategies for allocations. The relative robustness of the findings in this highly institutionalised environment of subsidy control may translate well to other jurisdictions, which is something future research should attempt to investigate. In so doing, however, scholars should be wary of issues of international comparison of subsidies and properly contextualise the findings. Further, the marginal effects plots lead to the interpretation that the regression results may be more ambiguous than the analysis suggests. Hence, it would be good practice to complement these findings with comparative case studies to better understand the politics of public spending (Zohlnhöfer et al. Reference Zohlnhöfer, Engler and Dümig2018). Future research should investigate the causal mechanisms behind politicians’ decisionmaking process when these kinds of distributive measures are concerned. For instance, the hypotheses could be tested for the different sectors of the economy, along the lines of previous studies in competition policy (e.g. Chari Reference Chari2015; Thatcher Reference Thatcher2014); by controlling for the geographical dispersion of businesses (e.g. Rickard Reference Rickard2012a, Reference Rickard2018); or by engaging in in-depth case studies to better explore State–business relations in State aid politics.
Supplementary material
To view supplementary material for this article, please visit https://doi.org/10.1017/S0143814X2000001X
Acknowledgements
I would like to thank Gizem Arikan, Adriana Bunea, Raj Chari, Emanuel Coman, Michele Crepaz, Eleonora La Spada, as well as three anonymous reviewers and the editors of the journal for their constructive comments. My thanks also go to the participants of the Trinity Friday Seminar Series, from whom I received further useful feedback. Previous versions of the article have been presented at the 2018 PSAI Conference in Limerick, Ireland, and the 2019 EPSA Conference in Belfast, UK. I also acknowledge the support of the Irish Research Council, which funded this project.
Data availability statement
Replication materials are available in the Journal of Public Policy Dataverse at https://doi.org/10.7910/DVN/LETUUY