

People do not have the time or capacity to develop expertise on most public policy issues (Sloman & Fernbach, Reference Sloman and Fernbach2017). Yet, their opinions influence decision making in a democracy, indirectly when politicians monitor polling data and more directly when people vote on candidates or ballot initiatives. What can be done to empower people with more informed opinions?
One potential solution is to estimate what public opinion would be if there were mass expertise on a topic by running a deliberative democratic process in miniature (Fishkin, Reference Fishkin2018). A random, representative sample of citizens are brought together. They are polled on their initial opinion on an issue. And then, over the course of hours or days, they are educated on the nuances and evidence behind the policy debate. They read carefully balanced briefing materials. They engage competing experts. They ask questions, discuss, and debate as a group. They are given, in effect, a crash course on the details of a policy debate. Afterward, they are polled again on their opinion. The difference between the final and the initial poll is interpreted as the impact of heightened understanding – of a more informed opinion – and the final poll is a sample of what public opinion would look like if the entire population had been so extensively briefed. Such an ideal method has been explored under many guises: for instance, as consensus conferences (Einsiedel & Eastlick, Reference Einsiedel and Eastlick2000); citizen juries (Street et al., Reference Street, Duszynski, Krawczyk and Braunack-Mayer2014; Jefferson Center, 2019); mini-publics (Niemeyer, Reference Niemeyer2011); citizens’ assemblies (Renwick et al., Reference Renwick, Allan, Jennings, McKee, Russell and Smith2017; Involve, 2018). The concept has received considerable media attention (Fishkin, Reference Fishkin2018).
To illustrate, the ‘America in One Room’ project brought 500 American voters together for 3 days inside the Gaylord Texan Resort in Dallas to receive briefings and debate issues of prevalence in the upcoming 2020 election, such as immigration and health care (Fishkin et al., Reference Fishkin, Siu, Diamond and Bradburn2019). Opinions shifted meaningfully. For example, support for ‘reducing the number of refugees allowed to resettle in the US’ dropped from 37% to 22%. Opinions shifted for people of all political affiliations: proposals that were farther on the right typically lost support from Republicans, similarly for proposals on the left and Democrats. With more informed opinions came more political agreement.
Not all voters can participate in such a process; consensus conferences cannot be run at scale. It is prohibitively expensive and time-consuming to bring together a substantial percentage of the electorate to learn about and discuss even a small number of issues. And who would pay anyway? If the organizers have any interest in the outcome, the impartiality of the conference would be questionable. But few neutral parties have the incentive, time, and funds to involve a substantial part of a reasonably sized electorate (though monetary costs could be reduced nowadays by running the conference online). And why should voters want to spend time learning about issues that they do not have a direct interest in? Learning about one issue is time-consuming and effortful. Learning about a large number is prohibitive. Policies are extraordinarily – perhaps infinitely – complicated (Sloman & Fernbach, Reference Sloman and Fernbach2017).
To use consensus conferences to inform the electorate, therefore, it is necessary that people who were not at the conference are influenced by conference results. Warren & Gastil (Reference Warren and Gastil2015) argue that people should be influenced because the opinions coming out of consensus conferences have the key ingredients of trust: The representativeness of the community sample makes it impartial and the training makes the sample competent. Indeed, there is evidence that citizens are influenced by learning the results of a conference. Gastil et al. (Reference Gastil, Knobloch, Reedy, Henkels and Cramer2018) found that reading a Citizens Statement about sentencing policy influenced Oregon voters’ values trade-offs, issue knowledge, vote intentions, and actual choices.
It is not easy to shift public opinion. Public debates have little impact on citizens (e.g., Hagner & Rieselbach, Reference Hagner, Rieselbach, Bishop, Meadow and Jackson-Beeck1978; cf., Yawn et al., Reference Yawn, Ellsworth, Beatty and Kahn1998; Chinni, Reference Chinni2016), although attitudes may be influenced by some politicians’ debating style rather than the substantive content they communicate (Lanoue & Schroff, Reference Lanoue and Schroff1989). But watching a debate (and news more generally) takes more time than many citizens are willing to invest (Mindich, Reference Mindich2005). Political advertisements also tend to have minimal impact (West, Reference West1993; Nkana, Reference Nkana2015), although more among citizens who are less politically aware (Valentino et al., Reference Valentino, Hutchings and Williams2004). These methods of persuasion can have negative consequences because the frequent negativity contained within them breeds cynicism and apathy (Patterson, Reference Patterson1994; Ansolabehere & Iyengar, Reference Ansolabehere and Iyengar1995; Cappella & Jamieson, Reference Cappella and Jamieson1997; cf., Freedman & Goldstein, Reference Freedman and Goldstein1999). We set out to see if we could sway public opinion without these negative consequences in a way that appeals to evidence and deliberation.
Our experiments set out to measure if people will use (or ignore) the knowledge of only consensus conference results about an issue – in the absence of information about the content of the issue – to inform their own public policy opinions. A key impediment to consumption of news and policy information is that many citizens simply lack the time (e.g., Mindich, Reference Mindich2005). Thus, if mere awareness of a consensus result (the absence of any time-consuming substantive information about it) is sufficient to shift opinion, we would have a way to break through this barrier to informed decision making. We predict that people will be swayed because people tend to outsource their beliefs and attitudes. People do not think through most issues on their own, but let others in their community do it for them (Lippmann, Reference Lippmann1922; Arendt, Reference Arendt1963; Zaller, Reference Zaller1992; Sloman & Fernbach, Reference Sloman and Fernbach2017). Most of us outsource our religious views to our family; we outsource many of our positions on appropriate behavior to our friends (as teenagers but also as adults; e.g., Pinquart & Silbereisen, Reference Pinquart and Silbereisen2004; Hugh-Jones & Ooi, Reference Hugh-Jones and Ooi2017); we outsource some of our moral judgments to lawmakers (Amit et al., Reference Amit, Han, Posten and Sloman2021); and we let our political parties determine many of our political positions (e.g., Cohen, Reference Cohen2003; Bullock, Reference Bullock2011). We take advantage of knowledge and values held by experts and by others whom we trust.
Evidence for the ubiquity of outsourcing is itself ubiquitous. Cialdini (Reference Cialdini1984) makes a strong case that human behavior is frequently guided by the actions of others (social proof). Even our sense of understanding is contagious: It is increased through discovery that others feel they understand (Sloman & Rabb, Reference Sloman and Rabb2016; Boulianne, Reference Boulianne2018; Rabb et al., Reference Rabb, Han and Sloman2020) or by knowing we have access to knowledge on the Internet (Ward, Reference Ward2013; Fisher et al., Reference Fisher, Goddu and Keil2015). We appeal to the status quo presumably because it represents social knowledge (Johnson & Goldstein, Reference Johnson and Goldstein2003). We accept words or phrases as explanations or as acceptable medical diagnoses just because others use them, even when they demonstrably carry no new information (Hemmatian & Sloman, Reference Hemmatian and Sloman2018). The study of social anthropology is replete with examples of cultures whose knowledge is distributed throughout a group (Henrich, Reference Henrich2016). We should be able to harness this tendency to rely on others in order to encourage people to allow others to guide them in ways that maximize the use of evidence. We hypothesize that learning about the results of a consensus conference on a target policy will change people's attitudes in the direction of those results, even in the absence of any new information about that policy.
Previous work is encouraging. Boulianne (Reference Boulianne2018) examined the impact of a qualitative description of the results of a mini public on a random sample of the general public in Alberta, Canada. The mini public generated recommendations on several policies concerning energy and energy efficiency. Informing participants of the mini-public consensus made a difference relative to a group not informed of the results for some policies but not others. One limitation of this study is that there tended to be a large amount of agreement with the policies even in the uninformed control group, raising the question whether people are likely to be swayed by consensus conference results only when they are already predisposed to agree with those results. Moreover, it is possible that the lack of persuasion on several of the issues resulted from a ceiling effect due to particularly strong a priori agreement. Ingham & Levin (Reference Ingham and Levin2018) swayed respondents’ attitudes regarding a policy concerning requirements for legislative approval for one policy issue – tax increases – by reporting that participants in a consensus conference mostly approved of it. They found that telling respondents about mini publics or party preferences had similar effects, consistent with the idea that people are willing to outsource their position to one group or another. These studies provide initial mixed support for our hypothesis. We further investigate the question using a wider variety of issues, a different consensus conference, and a different (American) participant population. Perhaps the most relevant feature of our studies is that, rather than giving only general information about the consensus polled at the conference, we report changes in the percentage of attendees that support each issue as a result of the conference, revealing to our participants what the actual effect of the conference was on its participants. Moreover, in Study 2, we examine the impact of this change information alone, to distill its unique persuasive impact. In Studies 3–5, we also compare the influence of a consensus conference to that of credentialed experts.
Studies
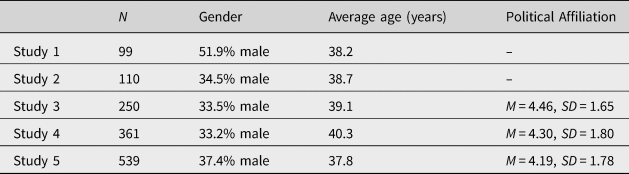
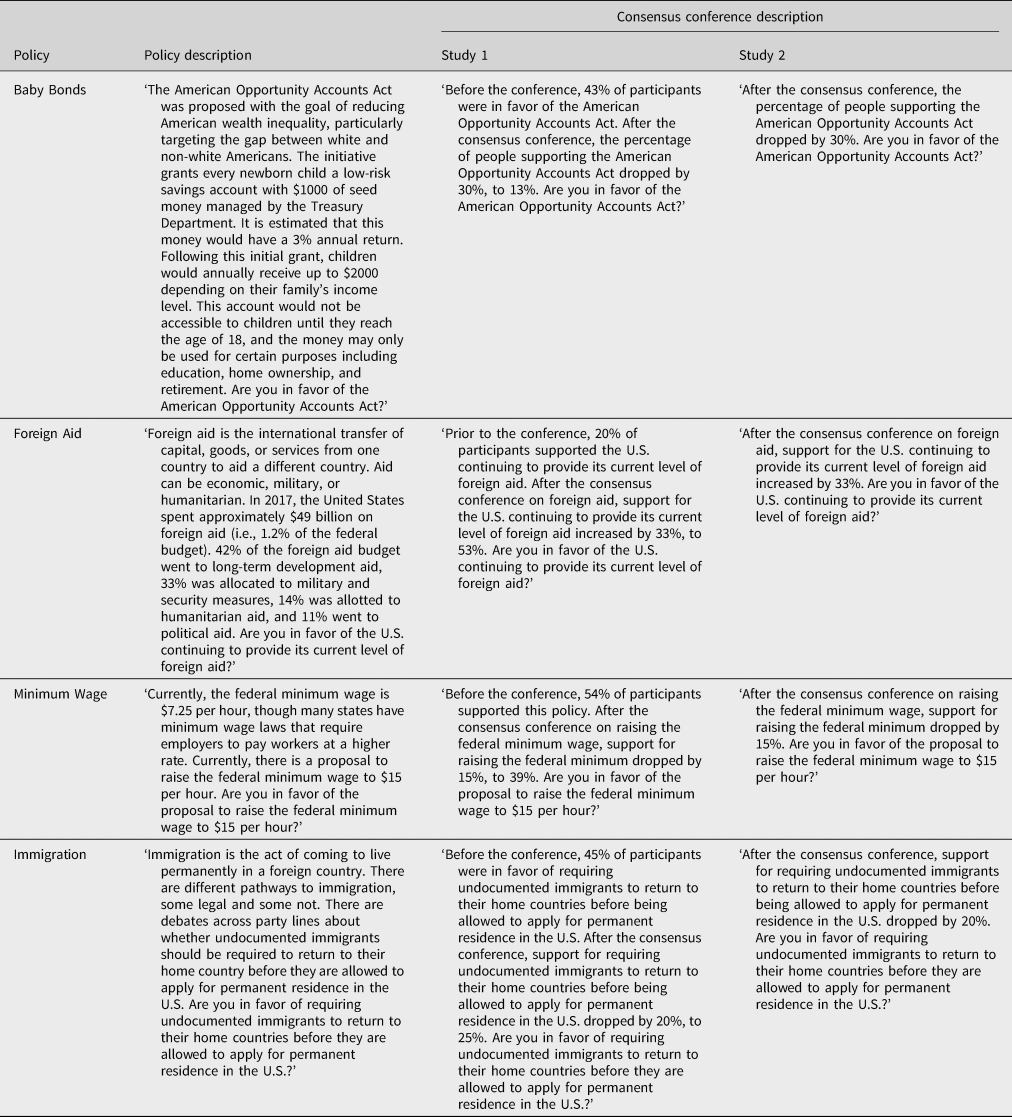
To examine whether people are willing to outsource their opinions to consensus conferences, we ran five studies with 1359 participants (see Table 1 for demographics). Methods were similar across studies. Participants with a 98% approval rating were recruited from Amazon Mechanical Turk to complete a ‘brief survey about your attitudes’, and were each compensated with 40 cents. Participants spent approximately 3–4 minutes on the studies. Everyone read descriptions of several policy issues under active debate in the fall of 2019 (see Table 2 for sample policy vignettes) and rated their support for each on a 7-point Likert scale, with 1 being the least support (definitely not) and 7 the most (definitely yes).
Studies 1–5 demographics. Political affiliation was measures on a 1 (conservative) to 7 (liberal) scale.

Sample policy vignettes used in Studies 1–2.

Notes. See Web Appendix B for the vignettes used in the remaining studies.
The experimental manipulation was whether participants did or did not receive a description of how a consensus conference works (see below) and the results from such a conference on each policy issue in question. Studies 1 and 2 used a within-subjects design, with the effect measured as the difference in participants’ opinion before and after reading the conference results. Studies 3–5 used a between-subjects design, with an opinion about each issue elicited either with or without the description of the consensus conference. Studies 4 and 5 also introduced an additional experimental condition to compare the relative impact of showing consensus conference results with showing results from a poll of subject matter experts. We deliberately selected a diversity of policies, to include cases where deliberation bolstered support for a Democratic position as well as cases where deliberation bolstered support for a Republication position.
The following language was used to describe a consensus conference:
-
A consensus conference is a gathering of citizens who fully represent a country's population of voters. In each consensus conference, all ages, genders, races and ethnicities, census regions, population densities, education levels, and political parties are equally represented.
-
The conference has three stages. First, the citizens are polled about their attitudes regarding a certain topic. After this poll, everyone gathers for 3 days to discuss that topic. Each citizen reads a set of balanced briefing materials developed by an impartial advisory group so that he or she is well educated on the issue prior to discussion. After reading all of the materials, participants engage in dialogue with each other and with competing experts. These discussions are all facilitated by trained moderators to ensure that every conference attendee is able to share their opinion. After three days, participants emerge with a thorough understanding of the topic, and they are all polled again to see if their opinions have changed.
-
Consensus conferences have been run on each of the topics that you previously read about.
Study 1
Methods
Study 1 was a pilot experiment wherein participants read each of the four policy vignettes (Table 2) and rated their support for each policy both before and after reading about the consensus conference. See Web Appendix A for details about exclusions in Study 1 and each of the subsequent studies.
Results
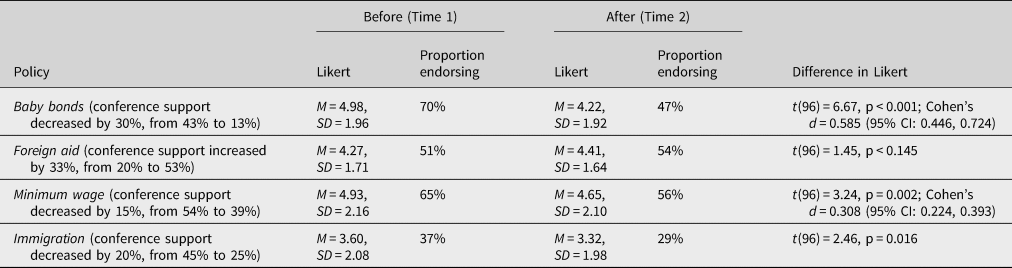
The consensus conference information shifted participants’ opinions. For example, we informed participants that, in a consensus conference about the baby bonds proposal, conference attendee's support decreased by 30%, from 43% to 13%. When participants learned this fact, their mean rating of support dropped from 5.0 to 4.2 (see Table 3 for all means, SDs, and statistical tests). Proportions above and below 3.5 on the 7-point Likert rating imply endorsement decreased by 23%, from 70% to 47%. Statistically significant changes in support were also observed for two of the other policies.
Study 1 results.

Note. There was no systematic effect of the conference results on the variance in attitude ratings.
Responses for the foreign aid proposal – the only consensus conference for which attendee support increased rather than decreased for a proposal – were reverse-scored, so that a shift down indicates a shift in the same direction as conference attendees. A paired t-test on this index revealed that awareness of the conference results significantly shifted participants’ opinion in the direction of the conference participants’ opinion shift (M Time 1 = 4.46, SD Time 1 = 1.05; M Time 2 = 3.95, SD Time 2 = 0.94; t(98) = 5.21, p < 0.001). Learning how the consensus conference changed participants’ attitudes also changed the attitudes of online participants for three of the four issues we tested.
Study 2
Study 2 replicated and extended the results of Study 1. The methods were identical with one exception: rather than viewing how conference attendees polled both before and after the conference, participants were shown only the change in opinion that resulted from participation. Does the form of conference attendees’ poll numbers matter? Is information about change sufficient to influence observers’ attitudes?
Results
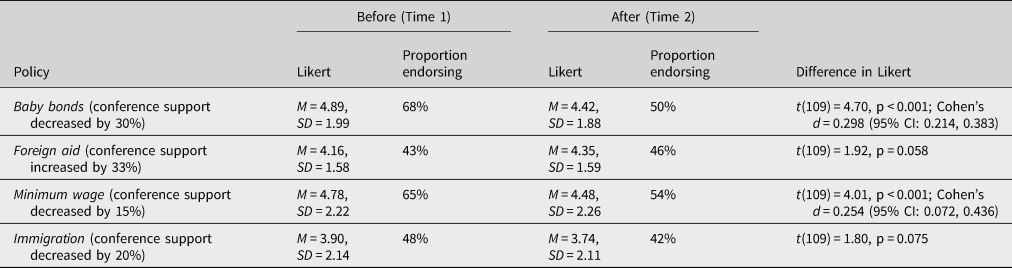
The overall pattern of results replicated Study 1. Learning the consensus conference results changed participants’ attitudes, significantly for two policy issues and marginally for the other two (Table 4). An analysis on the composite index (computed as in Study 1) revealed that awareness of the conference results significantly shifted participants’ opinions in the direction of the conference participants’ opinion shift (M Time 1 = 4.35, SD Time 1 = 0.98; M Time 2 = 4.07, SD Time 2 = 0.96; t(109) = 5.66, p < 0.001; Cohen's d = 0.536, 95% CI: 0.433, 0.638). People's willingness to outsource to consensus conferences does not depend narrowly on how the results of the conference are described.
Study 2 results.

Note. There was no systematic effect of the conference results on the variance in attitude ratings.
Study 3
Studies 1 and 2 found that people update their opinions upon learning the results of a consensus conference. But our within-subjects design is not externally valid. On a ballot, for example, people express their preference once; there is no vote, followed by conveyance of information, followed by a second vote. Perhaps the updating is conditional upon first thinking about an opinion, which can then be updated. Internal validity may also be at risk. Our results could reflect an experimental demand effect: the subject may infer that we, the researchers, expect a reasonable person to update their beliefs after learning about consensus conferences, and so they act accordingly to fit the bill. Study 3 deploys a between-subjects design to rule out these concerns.
A second question addressed by Study 3 is whether the presentation of the effect of the consensus conference on citizen-participants is any more influential than the presentation of attitudes from credentialed experts. People might be swayed by consensus conferences because they provide insight into the attitudes of a representative sample of the community, people who in that sense represent the respondent and, on average, share their values. But people might be swayed by the fact that conference attendees’ final poll results reflect the attitudes of an informed group regardless of their values, a group educated by the consensus conference itself. To adjudicate between these two possibilities, in Study 3, we compare polling results with those obtained with known experts. Are people more or less willing to outsource to consensus conference participants or to experts? Hints from marketing strategy go both ways. On the one hand, some marketing campaigns appeal to expert knowledge (four out of five dentists surveyed). On the other hand, many campaigns appeal to peers (e.g., beer and other cold drink commercials). To make the comparison fair, we had to foster the impression that there was a reasonable amount of expert consensus on each issue. Hence, we made up expert polling data that suggested that the great majority of experts either favored the policy (when the consensus conference created support) or disfavored it (when the conference reduced support). As before, the conference polling data came from actual, published sources. In addition, Study 3 obtained measures of political affiliation to see if they moderated people's willingness to outsource.
Methods
The methods in Study 3 were similar to those employed in Study 2, but employed a between-participant design as well as a condition in which participants viewed expert information. Each participant rated their attitudes toward each policy once; we varied between conditions the information that participants viewed prior to rating their attitudes: Specifically, participants in the Baseline condition viewed information about each of the same four policies examined in the previous studies and indicated their attitudes toward them. Participants randomly assigned to the Conference condition viewed all of the same information as did participants in the Baseline condition, and additionally viewed information about the conference results for each issue, as in Study 1. Participants in the Expert condition viewed all of the same information as did participants in the Baseline condition, but these participants viewed (fabricated) expert opinions about these topics (see Web Appendix B). For example, the expert opinions relevant to the baby bond proposal noted that 13% of financial experts support the American Opportunity Accounts Act.
Results
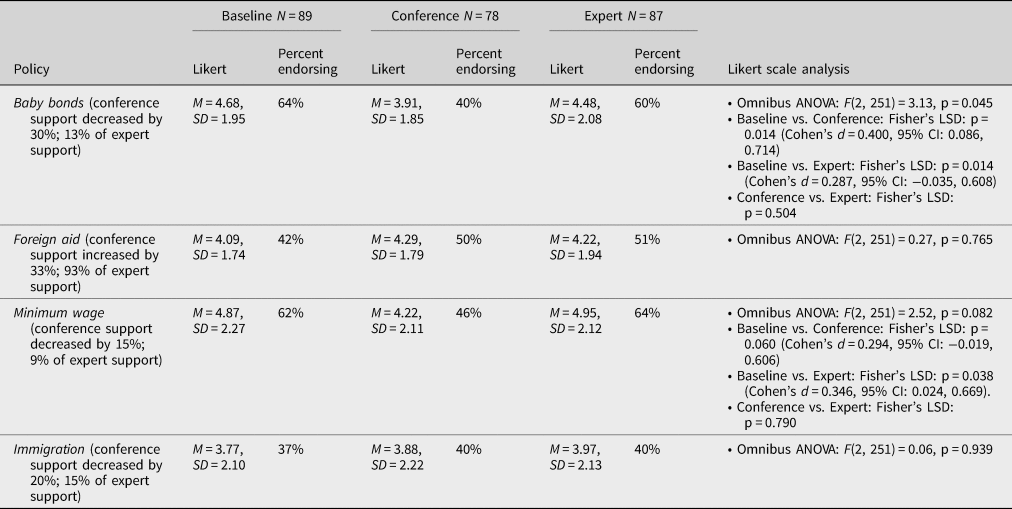
An ANOVA of condition on the composite index (computed via the same procedures as in the prior studies) revealed a marginal effect, F(2, 251) = 2.97, p = 0.053: Participants in the Conference condition (M = 3.95, SD = 1.07) showed less support for the policies than participants in the Baseline condition (M = 4.31, SD = 0.94; Fisher's LSD: p = 0.024; Cohen's d = 0.357, 95% CI: 0.044, 0.671) and in the Expert condition (M = 4.28, SD = 0.99; Fisher's LSD: p = 0.044; Cohen's d = 0.318, 95% CI: 0.000, 0.640). The Baseline and Expert conditions did not differ (Fisher's LSD: p = 0.836). See Table 5 for the same analysis for each issue. The variances in the various conditions were similar.
Study 3 results.

On average, our participants rated their affiliation more liberal than conservative (M = 4.46, SD = 1.65, on our 1–7 – conservative to liberal – scale), significantly above the scale midpoint of 4 (t(253) = 4.42, p < 0.001). To examine the effect of political affiliation, we conducted an ANOVA including condition (dummy coded, such that the Conference condition dummy code received a one for the conference condition and a zero for the other two conditions, and the Expert condition dummy code received a one for the Expert condition and a zero for the other two conditions), political affiliation, and all possible interactions entered as the independent variables. This analysis revealed no significant interaction between political affiliation and the conference condition on the composite index (F(2, 248) = 1.56, p = 0.213), baby bond data (F(2, 248) = 0.35, p = 0.555), the minimum wage data (F(2, 248) = 2.12, p = 0.147), the immigration data (F(2, 248) = 0.04, p = 0.846), or the foreign aid data (F(2, 248) = 0.18, p = 0.668). Similarly, these analyses revealed no significant interaction between political affiliation and the expert condition on the composite index (F(2, 248) = 0.01, p = 0.915), baby bond data (F(2, 248) = 0.55, p = 0.459), the minimum wage data (F(2, 248) = 0.02, p = 0.876), the immigration data (F(2, 248) = 0.86, p = 0.355), or the foreign aid data (F(2, 248) = 0.01, p = 0.937).
Participants were influenced more by conference participants than by experts. These effects occurred regardless of subjects’ political affiliation. The results were driven by only two policies: baby bonds and minimum wage.
Study 4
The presence of hard-to-interpret numbers in the description of the foreign aid policy might have affected participants’ confidence in responding to other scenarios. Study 4, therefore, attempted to replicate Study 3 while dropping the foreign aid scenario.
Results
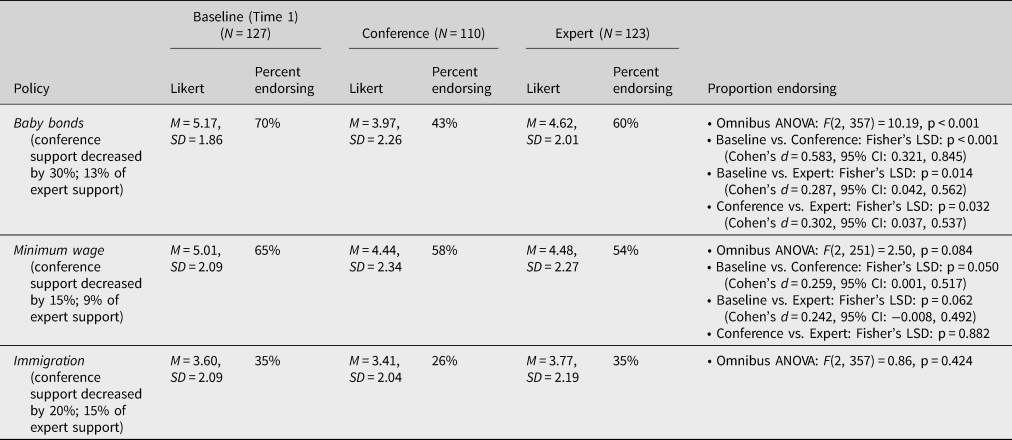
An ANOVA of condition on the composite index (computed via the same procedures as in the prior studies) revealed a significant effect, F(2, 357) = 9.16, p < 0.001: Participants in the After condition (M = 3.94, SD = 1.32) on average showed less support for the policies than participants in the Before condition (M = 4.59, SD = 1.01; Fisher's LSD: p < 0.001; Cohen's d = 0.564, 95% CI: 0.301, 0.824) and less than in the Expert condition (M = 4.29, SD = 1.19; Fisher's LSD: p = 0.042; Cohen's d = 0.279, 95% CI: 0.020, 0.539). This time, the latter two conditions also differed (Fisher's LSD: p = 0.032; Cohen's d = 0.275, 95% CI: 0.025, 0.526). See Table 6 for the same analysis for each issue. As in previous studies, variances were similar in the three conditions.
Study 4 results.

To examine the effect of political affiliation, we conducted an ANOVA on condition (dummy coded as in the previous experiment), political affiliation, and all possible interactions entered as the independent variables. This analysis revealed that the significant difference in attitudes on the composite index between the Baseline condition versus the Conference condition persisted when controlling for political affiliation (F(2, 345) = 4.38, p = 0.037), and the difference in attitudes between the Baseline condition versus the Expert condition remained insignificant when controlling for political affiliation (F(2, 345) = 2.25, p = 0.135). This analysis further revealed no significant interaction between political affiliation and the conference condition dummy (F(2, 345) = 0.24, p = 0.622), baby bond data (F(2, 345) = 0.26, p = 0.610), and no significant interaction between political affiliation and the expert condition dummy code (F(2, 345) = 0.73, p = 0.394). The data-replicated Study 3, although, was carried in large part by a single issue, baby bonds.
Study 5
Study 5 expanded the set of issues that we examined, adding five new ones to the three tested in Study 4. We also measured a number of potential mediators of our effects. One possibility is that participants are influenced by conference and expert opinion only to the extent they do not have a sense of understanding of the issue, know that they do not know, and are, therefore, willing to let more informed others influence them. We, therefore, asked people to rate their understanding of each issue. Relatedly, people might be more willing to outsource attitudes of issues they are less familiar with. Hence, we obtained ratings of familiarity for each issue. Issues may differ in the basis people have for their attitudes. Some bases, like protected or sacred values, may be less amenable to revision than other consequentialist bases (Baron & Spranca, Reference Baron and Spranca1997; Tetlock, Reference Tetlock2003). Therefore, we asked participants to rate the extent to which their attitude was fixed. Finally, participants might differ in their perceptions of whether the source of the attitude shared their interests. For instance, maybe they do not trust experts because they think they have an ulterior motive. For this reason, we asked participants whether each attitude source (conference participants or experts) had the same incentives as they did.
Methods
The methodology employed in Study 5 was the same as that employed in Study 4 with four exceptions. First, participants were randomly assigned to rate their opinions about one of eight issues (a proposal to create baby bonds, a proposal to raise sales taxes, a proposal to raise the minimum wage, a proposal to raise income taxes, a proposal to require undocumented immigrants to return to their home country before they are allowed to apply for permanent residence in the USA, a debate regarding whether parental involvement is the most important factor in improving education, a debate about whether the US government should protect weaker nations against aggression from foreign powers, and a debate about whether the US government should focus on fixing problems inside the USA before spending resources on ending world hunger; see Web Appendix A). Second, participants in Study 5 were assigned to one of two conditions. In both conditions, participants rated their attitudes toward a policy issue both before and after receiving additional information about it; this information detailed either expert opinions (in the Expert condition) or the percentage of people who changed their opinion as a result of the consensus conference (in the Conference condition). Third, a filler task (rating liking of six different pictures) separated participants’ first and second rating of their attitudes. Fourth, after rating their attitudes the second time, participants completed four additional measures: They rated their understanding of the focal issue (1: Not at all; 7: Very much); their familiarity with the details about the issue (1: Not familiar at all; 7: Very familiar); whether their attitudes about the issue were fixed (1: Definitely not; 7: Definitely yes); whether the attitude source (i.e., the conference participants or the expert) had the same incentives as they did (1: Definitely not; 7: Definitely yes).
Results
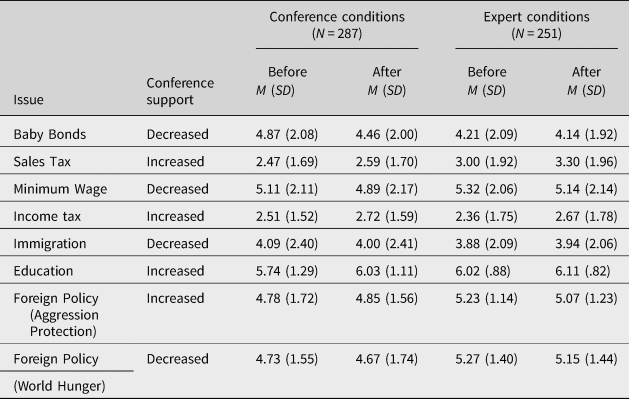
First, we computed a composite index of all of the attitudes data (see Table 7) by reverse-coding the attitudes data for the policy issues in which the conference heightened support. Next, we conducted a mixed-effect regression controlling for participant random effects: Attitudes data were entered as the dependent variable, and condition, policy topic (dummy coded), rating time, and all possible interactions as independent variables. This analysis revealed a significant main effect of rating time: Between the first time that participants rated their attitudes (M = 4.32, SD = 2.12) and the second time that participants rated their attitudes (M = 4.16, SD = 2.09), their attitudes significantly shifted in the direction of experts’ and conference participants’ opinions (b = 0.34, SE = 0.10, t = 3.35, p < 0.001). This analysis revealed no main effect of Conference versus Expert (b = 0.45, SE = 0.46, t = 0.99, p = 0.32) and no interaction between Conference versus Expert and rating time (b = 0.20, SE = 0.15, t = 1.30, p = 0.194). In this experiment, the attitudes of those told about Conference participants (M Time 1 = 4.45, SD Time 1 = 2.13; M Time 2 = 4.23, SD Time 2 = 2.11) and those told about Expert opinion (M Time 1 = 4.18, SD Time 1 = 2.12; M Time 2 = 4.08, SD Time 2 = 2.07) underwent the same magnitude of change between the two time points. Variances in the various conditions were almost identical.
Mean ratings for each issue in Study 5.

Note. The conference support column denotes whether the survey materials noted that the conference produced increased or decreased support for each respective issue. In the descriptive statistics detailed in this table, no ratings are reverse-coded. Because a relatively small number of participants viewed each particular issue, there is insufficient power to report meaningful statistical tests for the specific issues. Proportions above and below 3.5 on the 7-point Likert rating across conditions are detailed in Web Appendix C.
Next, we examined whether political affiliation moderated the results. To this end, we entered political affiliation (as well as all possible interactions) into the analysis detailed above. This analysis revealed that the main effect of the interventions persisted – after participants received the expert or conference information, participants’ attitudes significantly shifted in the direction of experts’ and conference participants’ opinions (b = 0.36, SE = 0.13, t = 2.73, p = 0.006). The analysis revealed no main effect of political affiliation (b = 0.08, SE = 0.06, t = 1.27, p = 0.204), no interaction between political affiliation and condition (b = 0.01, SE = 0.09, t = 0.06, p = 0.953), and no three-way interaction (between political affiliation, condition, and rating time; b = 0.02, SE = 0.03, t = 0.59, p = 0.557).
We designed this study to examine the impact of conference and expert information on average across policies. Although the number of participants who encountered each specific policy issue was relatively small, we conducted exploratory analyses examining each policy separately. These analyses revealed a significant effect of rating time on five of the eight issues, a main effect of condition on zero issues, and an interaction between condition and rating time on zero issues (see Web Appendix B).
Finally, we examined the potential relationship between attitude change with a perceived understanding of the focal issue, felt familiarity with the focal issue, perceived attitude fixedness toward the focal issue, and the perceived alignment between the information source's and the self's incentives. To this end, we evaluated a mixed model in which each of these four measures was entered as independent variables, policy issue was entered as a random effect, and attitude change was entered as the dependent variable. In the Expert condition, this analysis did not detect a significant relationship between attitude change and perceived familiarity (b = −0.01, SE = 0.03, t = −0.31, p = 0.759), perceived fixedness (b = −0.00, SE = 0.02, t = −0.19, p = 0.850), perceived understanding (b = 0.00, SE = 0.03, t = 0.08, p = 0.933), or perceived incentive alignment (b = 0.04, SE = 0.02, t = 1.46, p = 0.145).
In the Conference condition, this analysis did not detect a significant relationship between attitude change and perceived fixedness (b = 0.00, SE = 0.02, t = 0.22, p = 0.830), perceived understanding (b = 0.00, SE = 0.04, t = 0.01, p = 0.994), or perceived incentive alignment (b = −0.03, SE = 0.02, t = −1.39, p = 0.167). However, a marginal relationship between attitude change and perceived familiarity emerged (b = 0.06, SE = 0.03, t = 1.95, p = 0.052), such that participants revised their attitudes to a marginally greater degree when they perceived themselves to be more familiar with the corresponding topic. This is the opposite of our expectation that people would be more willing to outsource their opinion on those issues they are less familiar with. The reason this occurred does not seem to be an unwillingness to express a position on unfamiliar issues. Although people's attitudes were less extreme for unfamiliar issues (r = 0.199, p < 0.001) in the conference condition, we saw the same relation between familiarity and attitude extremity in the expert condition (r = 0.203, p < 0.001), yet familiarity did not predict outsourcing in the expert condition.
Study 5 shows a small but consistent tendency to outsource consensus conference results. It also suggests that issue familiarity may play a role in determining the size of these effects. We saw a hint that people are more willing to appeal to conference participants’ reasoning for more familiar issues.
Discussion and Conclusion
Our results are encouraging in that it is possible to inform the electorate in a way that does not involve lecturing, infantilizing, or lying. Five studies provide solid evidence that communicating the results of consensus conferences can influence people's attitudes regarding some issues. We consistently found that this information influenced attitudes toward a baby bonds policy and for a minimum wage policy. We consistently found that conference information did not influence attitudes toward a foreign aid policy. In four out of five studies, this information changed attitudes toward an immigration policy in the expected direction. Study 5 found consistent but small effects for a number of other policies as well. The fact that conference information produced overall effects on attitudes suggests that it provides fertile soil to scale up consensus conferences as a means to bring evidence to bear on policy attitudes for average citizens through outsourcing.
People can outsource to different degrees. At one extreme, one can let someone else make a decision in its entirety; at the other, one can get advice from others that makes some limited contribution to one's reasoning. In our experiments, participants received no information from the consensus conference on the substantive policy issues other than to learn how opinions changed. Participants did not get advice that furthered their understanding of the policies. The fact that they were influenced anyway suggests that our effects reflect some willingness to let attitudes be shaped directly by others, outsourcing one's reasoning about the specifics of a policy.
Many more parameters could be varied to get a more complete picture of how people outsource. The effects we documented are relatively small, and there may be ways to strengthen these effects. For instance, we made no effort to optimize what we told subjects about the consensus conferences to increase interest or credibility, we did not choose sample populations that optimally reflected the distribution of the conferences we appealed to, we did not make any special effort to cast conference attendees as impartial or competent, and we did not choose participants who had an intrinsic interest in the target policies. Indeed, our manipulations were strikingly minimal. Other parameters would have unknown effects. For example, the within-subjects designs employed by most of our studies are likely to lack ecological validity. Increasing the similarity between what we did and what happens in some real-world context could make our effects either bigger or smaller.
What makes people willing to outsource some policies but not others? At the conclusion of each experiment, we included an open response box in which participants could express any questions, doubts, comments, and any other type of feedback. These comments were not very revealing: Six participants expressed a desire to learn more about the substantive content that the conference participants viewed about the focal issues, and five participants expressed a desire to learn more about the political implications of the focal issues more generally. The literature provides limited guidance on this issue. In a preliminary study, Gastil et al. (Reference Gastil, Bacci and Dollinger2010) found that conferences move toward more cosmopolitan, egalitarian, and collectivist value orientations (in ways that defy traditional liberal vs. conservative distinctions). In our data, the baby bonds issue showed consistently large effects, larger than in any study we have seen on this issue. Why it does remains a mystery to us. The one policy that consistently showed little movement was foreign aid. This could be due to some distinct, intrinsic property of the issue. For instance, the description of this policy was unique in its reference to many numbers that may not have much meaning for most people. Alternatively, in final polling, only about half of conference participants favored it. Perhaps the mixed opinion that attendees had of it after the conference caused our participants to rely on their initial attitudes to judge it. People were also not consistently willing to outsource the immigration issue. The foreign aid and immigration policies were the only policies whose support changed in a liberal direction as a result of the consensus conference. Perhaps informed opinion is less likely to have an effect when the new information supports liberal causes, though, like Gastil et al., we found similar effects for liberals and conservatives. Boulianne (Reference Boulianne2018) also found effects for some issues but not others but was unable to determine the reason for the differences (she ruled out degree of ambiguity and contentiousness). The question remains wide open.
Overall, learning about expert opinion also influenced attitudes, but the results of consensus conferences influenced them even more in Studies 3 and 4 despite the fact that experts were presented as agreeing with one another more than conference participants. We did not see this advantage over experts in Study 5. Which of the two has a greater effect seems to vary by issue, although we do not have enough data to precisely determine the effect sizes on specific issues. The finding that people are at least as willing to outsource to conference participants than to experts is important in the current political environment in which certain segments of the American population will not reliably trust experts.
Consensus conferences themselves are expensive, in money and time, but propagating the results of a conference to the electorate is relatively cheap and thus a cost-effective way to bring evidence and deliberative argument to bear on popular opinion on policy. One rough estimate has put the cost of a consensus conference at about $110,000 in 2010 (Fox, Reference Fox2010). Presumably, conferences cost more than that today, although the cost could potentially be reduced considerably by conducting them online. Even online, participants must devote substantial amounts of time. Such conferences can influence opinion to a degree that, if public opinion were changed to the same extent, the outcome of contentious legislative processes would be different (Einsiedel & Eastlick, Reference Einsiedel and Eastlick2000; Niemeyer, Reference Niemeyer2011; Street et al., Reference Street, Duszynski, Krawczyk and Braunack-Mayer2014; Renwick et al., Reference Renwick, Allan, Jennings, McKee, Russell and Smith2017; Involve, 2018; Fishkin et al., Reference Fishkin, Siu, Diamond and Bradburn2019; The Jefferson Center, 2019). Moreover, a conference can directly reach only a small number of people. The largest one we are aware of had 500 participants (Fishkin et al., Reference Fishkin, Siu, Diamond and Bradburn2019). Disseminating conference results could cost two orders of magnitude less than the conference while reaching many more people. It requires communicating minimal information – the conference procedure and results – and should be of enough interest to reputable news organizations that some of the dissemination could be done for free through their channels along with social media. Such results would be more informative for the electorate than conventional ballot results. And because the communication of such results would be much quicker than having them actually participate in a consensus conference, this approach would overcome a primary barrier – the perceived absence of time – that prevents many Americans from obtaining political information from other sources.
A more ambitious application of our results would use them as justification for including consensus conference results in a ballot itself (Gastil, Reference Gastil2000; Crosby, Reference Crosby2003). If the competing parties in a referendum agreed beforehand on the terms of a consensus conference, they could also agree that the results – however they turn out – could be reported within the ballot for voters to see at the time of voting.
There may be other ways to try to convince electorates through evidence and fair argument: editorials, books, workshops, lecture tours, etc. However, each of these requires considerable effort and expense and speaks only to a select audience. Moreover, these methods are biased by design; they represent attempts to persuade the audience of the author or instructor's point of view. Consensus conferences, if administered fairly, let the dice fall where they may, wherever the evidence and argument land in the mind of the selected sample. Another approach to achieving this objective is teaching critical reasoning skills. But we know of no critical reasoning program that facilitates reasoning about social issues in a way that demonstrably aligns with evidence and logic.
Much more work needs to be done to identify the aspects of issues that determine people's openness to outsourcing. Perhaps we would have had more success, for instance, by describing the conferences differently. In addition, there are many open questions about what types of conferences and conference information will heighten the impact of conference results on people's opinions, and which groups of individuals are most willing to outsource. Doing this work seems worthwhile. Any activity that can encourage citizens to bring evidence to bear on their attitudes toward policy, even by a small amount, will lead to policies that are chosen by virtue of their likelihood of effectively moving society in directions desired by its citizenry.
Supplementary material
The supplementary material for this article can be found at https://doi.org/10.1017/bpp.2021.2.
Financial support
This work was funded by grants from Brown University and Boston University.