
I. INTRODUCTION
Three-dimensional nanostructures possess desirable properties for a wide range of applications requiring control over chemical reactivity and mass transport properties. Reference Rolison1 High specific surface area, porosity, and conductivity are beneficial for catalysis, energy storage and conversion, piezoelectrics, and sensors. Reference Wei, Chen, Chang, Lu and Hu2–Reference Olsson, Samir, Salazar-Alvarez, Belova, Strom, Berglund, Ikkala, Nogues and Gedde5 Metallic 3-dimensional nanostructures further enhance high conductivity, ductility, malleability, and strength. Reference Hodge, Hayes, Cao, Biener and Hamza6,Reference Hodge, Biener, Hayes, Bythrow, Volkert and Hamza7 Device integration ultimately requires that nanomaterials be freestanding or combined with support materials. An optimized support for many applications would offer a porous, conductive, and inert framework coated with an active material to a minimal thickness. Nanoparticle incorporation with support materials such as carbon is advantageous for minimizing the cost of active materials but often results in weak adsorption to the support and eventual agglomeration during device performance. Reference Ambrosi, Chua, Bonanni and Pumera8,Reference Maillard, Schreier, Hanzlik, Savinova, Weinkauf and Stimming9 Free-standing 3-dimensional metal nanomaterials offer a route to avoid this challenge. Metal and metal oxide 3-dimensional structures have been synthesized by a variety of approaches, to include select alloy etching, template assembly, solvent mediated aggregation, linker molecules, sol–gel, hydrothermal, carbothermal reduction, and freeze drying as a few examples. Reference Zielasek, Jurgens, Schulz, Biener, Biener, Hamza and Baumer10–Reference Tang, Gong, Chen, Yap and Cheng17
Noble metal 3-dimensional nanostructures, in particular, are desirable as electronic conductors, catalytic and biomedical materials, and electro-optical sensors. Reference Liu, Herrmann, Bigall, Rodriguez, Wen, Oezaslan, Schmidt, Gaponik and Eychmuller18 A large number of synthesis techniques are available to control the size and shape of individual nanoparticles. Reference Zhao, Li and Astruc19–Reference Jana, Gearheart and Murphy21 Although there are fewer approaches available to facilitate control over integrated 3-dimensional nanomaterials, a number of previous studies demonstrated the ability to synthesize noble metal 3-dimensional structures. Reference Walsh, Arcelli, Ikoma, Tanaka and Mann22–Reference Wen, Liu, Haubold, Zhu, Oschatz, Holzchuh, Wolf, Simon, Kaskel and Eychmuller27 Nanoparticles linked with dithiols, sol–gels, foams, aggregates, composites, nanosphere chains, and biotemplating have all yielded 3-dimensional noble metal structures. Reference Ding, Chen and Erlebacher28–Reference Ameen, Rajasekharan and Rajasekharan31 Gold, palladium, and platinum nanofoams synthesized directly from the reduction of precursor salt solutions resulted in contiguous nanowire-like ligamentous elements for aggregates up to hundreds of microns in size and have been dried to form powders. Reference Qin, Liu, Balaji, Xu, Matsunaga, Hakuta, Zuo and Raveendran32,Reference Krishna, Sandeep, Philip and Eswaramoorthy33 For synthesis techniques that result in shorter range order, such as nanofoam powders, additional support or mechanical pressing is required to yield materials for device integration.
Aerogels, first reported by Kistler, offer the promise of free-standing monolithic, porous materials that do not require mechanical compression to assemble nanostructures together. Reference Kistler34 Aerogels offer 3-dimensional structures over a length scale extending to bulk material, rather than shorter length particles or powders, and are hundreds of times less dense than their bulk material counterparts. Reference Du, Zhou, Zhang and Shen35,Reference Tappan, Steiner and Luther36 Aerogels thus provide a material route to rationally design and tune porosity and structural geometry to control reactivity, conductivity, and mass transport for envisioned applications. Sol–gel approaches to synthesizing noble metal aerogels yield excellent control over particle feature size but often require long periods of time for gelation on the order of days to weeks. Employment of capping agents to synthesize nanoparticles or the use of cross-linker molecules for particle assembly likely requires additional material processing to achieve an accessible metal surface.
The accessible surface of 3-dimensional porous structures has been analyzed by a number of techniques to include gas physisorption and electrochemical impedance spectroscopy (EIS). Gas physisorption models, to include those developed by Brunauer–Emmett–Teller (BET) and Barrett–Joyner–Halenda (BJH), allow the determination of a specific surface area, a pore size, and an indication of pore structure. Reference Brunauer, Emmett and Teller37,Reference Barrett, Joyner and Halenda38 Like gas physisorption, EIS enables an estimation of the specific surface area, but via the capacitance. Electrochemical transmission line models (TLMs) developed by de Levie, and later treated by Keiser for specific pore shapes, offer insights into an average pore structure. Reference de Levie39,Reference Keiser, Beccu and Gutjahr40 Determining and correlating aerogel specific surface area and pore structures with multiple experimental techniques provide a better assessment than singular approaches for the feasibility of implementation in actual devices.
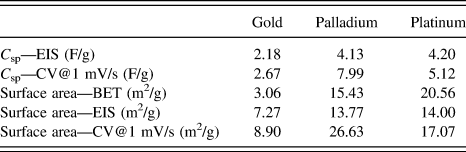
Here we present a rapid, direct solution-based method to synthesize gold, palladium, and platinum aerogels that does not use capping agents or cross-linking molecules. Noble metal salt solutions were reduced in a 1:1 (v/v) ratio with dimethylamine borane (DMAB) and sodium borohydride to rapidly form gels within seconds to minutes above a threshold salt concentration and were then freeze dried. The metal salt solution concentration threshold was determined by chemically reducing a range of concentrations. The resulting aerogels achieved densities 25 to nearly 400 times less than their bulk material counterparts. Material analysis with scanning electron microscopy (SEM), X-ray diffractometry (XRD), nitrogen physisorption with the BET, EIS, and cyclic voltammetry (CV) indicate accessible aerogel surface areas with good correlation between experimental techniques. Specific surface areas determined with BET nitrogen gas physisorption were determined to be 3.06, 15.43, and 20.56 m2/g for Au, Pd, and Pt aerogels. Electrochemically determined specific capacitance measurements using impedance spectroscopy (EIS) and CV were 2.18, 4.13, and 4.20 F/g and 2.67, 7.99, and 5.12 F/g for Au, Pd, and Pt, respectively. Specific surface areas calculated from electrochemically determined capacitances correlated well with BET values. Specific surface areas for Au, Pd, and Pt aerogels determined from EIS and CV are 7.27, 13.77, and 14.00 m2/g and 8.90, 26.63, and 17.07 m2/g, respectively. The rapid synthesis, high solvent accessible specific surface area, conductivity, and capacitance make these noble metal aerogels candidates for a wide array of catalytic, energy storage, and sensor applications.
II. EXPERIMENTAL METHODS
A. Material synthesis
Noble metal aerogels were synthesized from precursor salt solutions with concentrations of 100, 50, 25, 10, 5, 1, 0.5, and 0.1 mM. All chemical reagents used in the syntheses were from Sigma-Aldrich (Sigma-Aldrich, St. Louis, MO). The following noble metal salts were used: HAuCl4·3H2O, Na2PdCl4, Pd(NH3)4Cl2, K2PtCl4, Pt(NH3)4Cl2, and Na2PtCl6. Noble metal salts were reduced in solution using DMAB, (CH3)2NH·BH3, sodium borohydride, NaBH4, or sodium hypophosphite monohydrate, Na2HPO2·H2O. Reducing agents were used at a fixed concentration of 0.1 M. Platinum salt solutions were prepared with deionized water or a 1:1 (v/v) ratio of deionized water:ethanol solvent. All solutions were used as prepared with no buffers or pH adjustment. No capping agents or cross-linking molecules were used in the metal gel syntheses. Reducing agents were added to precursor salt solutions in a 1:1 (v/v) ratio. Salt and reducing agent solution volumes used were 0.5, 1, 2, and 3 mL. Microfuge tubes were used for 1 and 2 mL total reaction volumes. 15 mL Falcon tubes were used for 4 and 6 mL total reaction volumes.
Metal gels rapidly formed in reducing agent solution and remained in solution overnight. Gels were subsequently rinsed in a deionized water bath for 24–48 h. Wet gels were frozen at −80 °C. The frozen gels were freeze dried using a Labconco FreeZone 2.5 L Cascade Benchtop Freeze Dry System (Labconco, Kansas City, MO). Freeze drying set point pressure was 3.0 Pa.
B. Characterization
SEM imaging was performed using a ZEISS Auriga 60 field-emission SEM (Zeiss, Oberkochen, Germany). ImageJ was used to analyze SEM images. Reference Schneider, Rasband and Eliceiri41 Pore size and ligament diameters were determined with 200–300 individual measurements to determine the mean and standard deviation values. Densities were determined by measuring the mass of the aerogels and dividing by the volume calculated from photo image analysis. Aerogel porosities were calculated using the formula
 $$\% \;{\rm{Porosity}} = 100\% - \left( {{{{\rho _{{\rm{aerogel}}}}} / {{\rho _{{\rm{bulk}}}}}}} \right) \times 100\% \quad ,$$
where ρaerogel and ρbulk are the densities of the aerogel and bulk materials. A PANalytical Empyrean (PANalytical, Almelo, Netherlands) XRD was used to identify the material phase and crystallite size. XRD scans for diffraction angles (2θ) from 20° to 70° were performed at 45 kV and 40 mA with Cu Kα radiation (1.54060 Å), a 2θ step size of 0.0130°, and 8.67 s per step. XRD spectra analysis was performed with High Score Plus software (PANalytical). The Debye-Scherrer formula
 $$D = {{K\lambda } / {\left( {B\cos \theta } \right)\quad ,}}$$
was used to calculate the crystallite size (D), with the shape factor (K), full width at half maxima (B), radiation wave length (λ), and Bragg angle (θ). A shape factor of K = 0.9 was used for crystallite size determination.
Adsorption–desorption measurements were performed according to International Union of Pure and Applied Chemistry (IUPAC) standards Reference Sing, Everett, Haul, Moscou, Pierotti, Rouquerol and Siemieniewska42 using a Quantachrome NOVA 4000e (Quantachrome Instruments, Boynton Beach, FL) surface area and pore size analyzer with nitrogen (77 K) as the test gas. Two testing conditions were used that yielded similar results. First, the equilibration times for adsorption and desorption were 45 s and 60 s, respectively, and the samples were not degassed prior to measurement. Second, the equilibration times for adsorption and desorption were 60 s and 120 s, respectively, and the samples were degassed for 24 h prior to measurement. The first experimental condition dataset is presented. The BET analysis was used to determine the specific surface area from gas adsorption. Reference Du, Zhou, Zhang and Shen35 Pore-size distributions for each sample were calculated using the BJH model applied to desorption isotherms. Reference Tappan, Steiner and Luther36 All calculations were performed using Quantachrome’s NovaWin software (Quantachrome Instruments, Boynton Beach, Florida).
Electrochemical measurements were performed using a Biologic VMP-3 multi-channel potentiostat (Biologic, Seyssinet-Pariset, France). EIS and CV were performed on rinsed wet metal gels before freeze drying. Electrochemical measurements were conducted in 0.5 M KCl supporting electrolyte using a three electrode cell configuration, with an Ag/AgCl reference electrode, a platinum wire counter-electrode, and a Miccrostop Stop-Off lacquer (Tolber Chemical Division, Hope, AR) coated platinum wire working electrode. EIS measurements were conducted at open circuit potential with a 10 mV amplitude sine wave across a frequency range of 1 MHz – 1 mHz. EIS scans were performed before and after CV tests. CV measurements were performed at 100, 75, 50, 25, 10, 5, and 1 mV/s scan rates at voltage ranges of either −0.2 to 0.2 V (versus Ag/AgCl) for gold gels or 0.1–0.4 V (versus Ag/AgCl) for palladium and platinum gels. The voltage window for Pd and Pt gels was selected to avoid hydrogen adsorption and desorption and oxidation-reduction of the metals. Electrochemical analysis was performed using EC-Lab (Biologic, Seyssinet-Pariset, France).
III. RESULTS AND DISCUSSION
Based on previous reports of metal aerogels formed from sol–gels and nanofoams using conventional aqueous based reducing agents, we tested a range of noble metal salt types and concentrations using fixed concentrations of DMAB, sodium borohydride (NaBH4), and sodium hypophosphite monohydrate (Na2HPO2·H2O). Unlike other studies that examined the role of reducing agents in noble metal nanofoam synthesis in using excess reducing agent by volume, here we used a 1:1 (v/v) ratio of noble metal salt solution to reducing agent solution. Reference Ameen, Rajasekharan and Rajasekharan31 Upon addition of reducing agent, salt solutions immediately turned black, and effervescent gas evolution was observed consistent with numerous previous reports using similar reducing agents to synthesize noble metal nanostructures. In the cases where gels formed, a nascent gel structure was observed within seconds to minutes upon addition of the reducing agent. Rapid gas evolution compacted the gel toward the upper volume of the solution. Synthesis reactions then proceeded until gas evolution ceased, after which the gels were rinsed in deionized water.
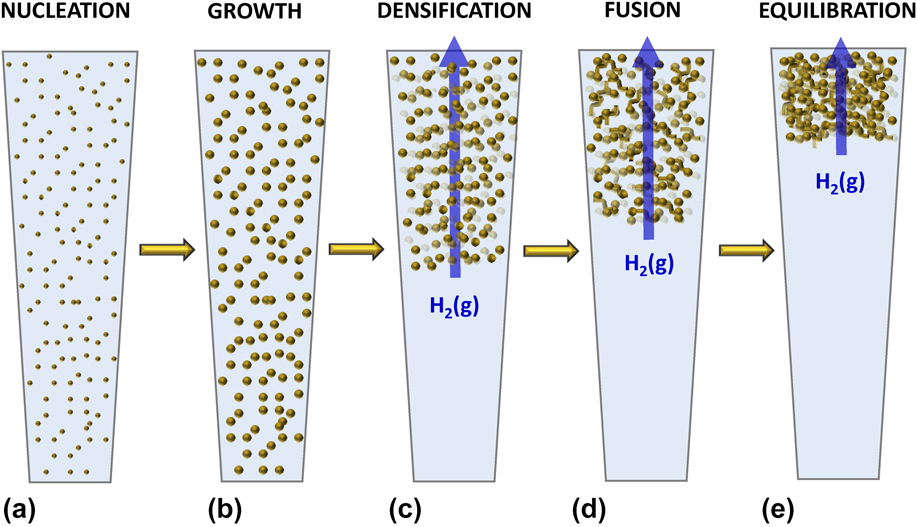
Based on observations of the synthesis reactions, gel formation proceeds through five steps depicted in a proposed mechanism in Figs. 1(a)–1(e). First, nucleation of nanoparticles quickly initiates upon addition of reducing agent. Second, continued reduction of metal ions results in growth of the nanoparticles. Third, vigorous hydrogen gas evolution, as a product of the reduction mechanism, compacts and densifies the enlarging nanoparticles toward the top of the solution. Fourth, the densified nanoparticles confined toward the top of the reduction solution then fuse with neighboring particles, forming an extended three-dimensional structure. Continued gas evolution does not appear to further compact the gel once it forms. Fifth, within the pores of the nascent gel, remaining salt ions are depleted through reduction by the aqueous reducing agent and hydrogen gas. The particle fusion and further ion reduction is believed to account for the strengthening of the gel. After which the surface free energy of the gel structural elements arrives at equilibrium. Note that capping agents or linker molecules used in other nanoparticle and aerogel synthesis studies were not used in this work, although the influence of reaction products is not dismissed as having possible capping agent-like effects. Further, in the absence of solution buffers, there may be a further influence of pH changes.
Proposed mechanism of noble metal gel formation. Synthesis proceeds via (a) initial nucleation of nanoparticles, (b) rapid growth of nanoparticles, (c) densification of nanoparticles due to hydrogen gas evolution, (d) fusion of nanoparticles, and finally (e) surface energy minimization and equilibration of resulting gel.

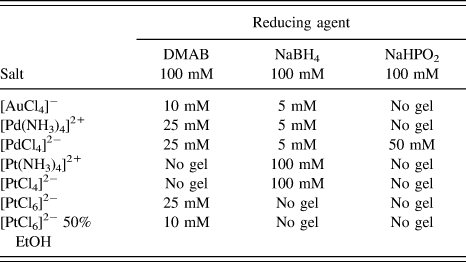
To determine if there was a threshold salt concentration for gel formation, a fixed reducing agent concentration of 0.1 M was used to reduce a range of salt concentrations of 100, 50, 25, 10, 5, 1, 0.5, and 0.1 mM at a 1:1 (v/v) with reducing agents. This volume ratio appeared to facilitate the densification and confinement needed for the rapid gel formation described above. To determine the influence of the type of noble metal salt used on gel formation, a number of different Pd and Pt salts were used, whereas only [AuCl4]− was used to synthesize gold gels. The different combinations of salts, concentrations, and reducing agents tested are summarized in Table I, along with the minimum concentration at which contiguous gel formation was observed. Gold ions reduced easily and formed gels with DMAB and NaBH4 with salt concentration thresholds of 10 mM and 5 mM, respectively, though the DMAB gels presented a smoother, more well-formed appearance. While NaBH4 was the most effective reducing agent for both [PdCl4]2− and [Pd(NH3)4]2+ with a 5 mM salt concentration threshold for gel formation, DMAB reduction resulted in gels for both salts above 25 mM salt concentration. Likely due to their thermodynamic stability, square planar platinum salts [PtCl4]2− and [Pt(NH3)4]2+ resulted in poor gel formation with all reducing agents tested, but with some gelation with 0.1 M salt and 0.1 M NaBH4. [PtCl6]2− reduction was facile with all reducing agents tested. While gels were observed for [PtCl6]2− at 25 mM and higher with DMAB reduction, the gels were not stable monolithic gels but rather broke apart into nanofoam fragments upon handing of the solutions. No monolithic gels were seen for [PtCl6]2− reduced in NaBH4 and sodium hypophosphite. Ethanol was added to platinum salt solutions for a 1:1 (v/v) ethanol to deionized water solvent. Ethanol was selected based on previous use in platinum nanoparticle synthesis to destabilize surface energy and drive aggregation. Reference Wang and Tseng43 With the 50% ethanol solvent, [PtCl6]2− formed gels above a 10 mM salt concentration with DMAB as the reducing agent but did not form gels with NaBH4 or sodium hypophosphite. Despite its strong reduction potential (E o) of −1.65 V (versus SHE), sodium hypophosphite was the least effective reducing agent for the salts tested, only forming gels with [PdCl4]2− at 50 mM and higher.
Concentration thresholds for gel formation for different combinations of salt type and reducing agents.

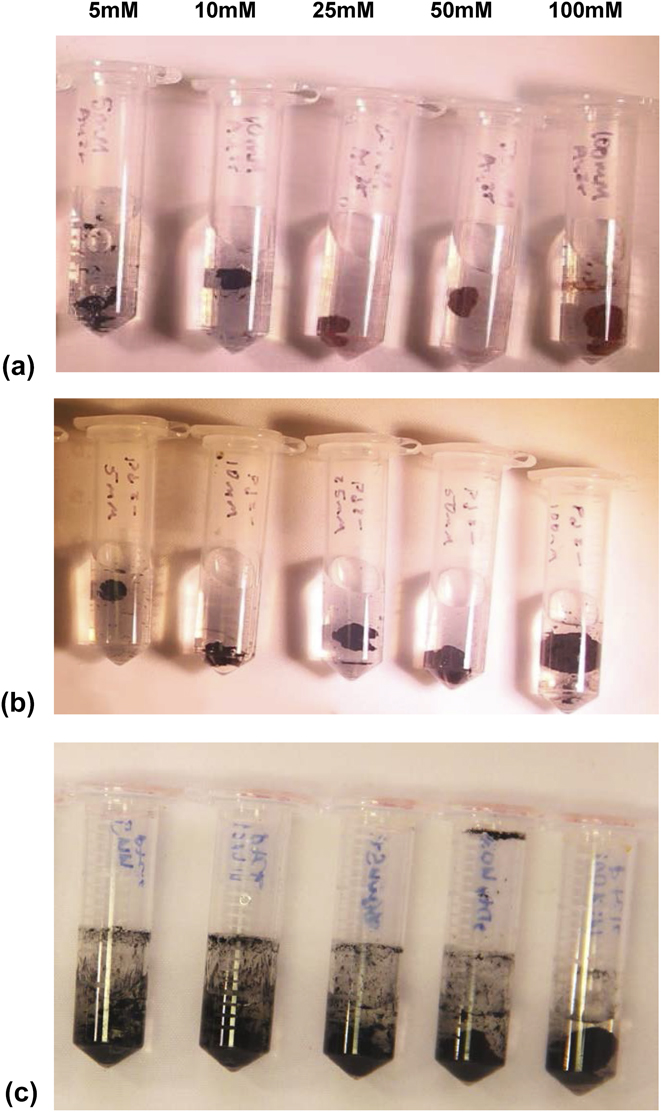
Of all the salt, concentration, and reducing agent combinations tested, the following resulted in consistent, well-formed monolithic aerogels: [AuCl4]− reduced with 0.1 M DMAB, [PdCl4]2− reduced with 0.1 M NaBH4, and [PtCl6]2− in 50% ethanol reduced with 0.1 M DMAB. The salt concentration range of 100, 50, 25, 10, and 5 mM for these synthesis combinations with 0.1 M reducing agent is shown in the photos in Fig. 2. Distinct gels are seen at higher concentrations, with gel size decreasing at lower concentrations until a single gel is no longer observed or no visible reduction product at all. Gold gels reduced with DMAB transitioned in color from reddish-gold at 100 mM salt solution to a black appearance at 10 mM and below as seen in Fig. 2(a). Pd and Pt gels appeared black for all synthesis concentrations in Figs. 2(b) and 2(c). The resulting gels are significantly compacted relative to the total solution volume.
Noble metal gel synthesis across a range of salt concentrations from right to left of 100, 50, 25, 10, and 5 mM. (a) [AuCl4]− reduced with 100 mM DMAB. (b) [PdCl4]2− reduced with 100 mM NaBH4. (c) [PdCl6]2− prepared in 50% ethanol, reduced with 100 mM DMAB.

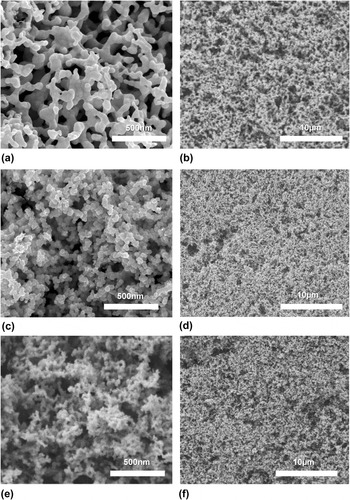
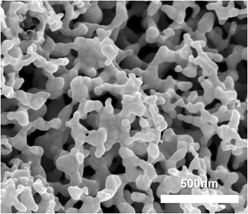
After complete reduction, gels were rinsed in deionized water for 24–48 h. After rinsing, gels were rapidly frozen at −80 °C and freeze dried to achieve the final aerogel structures. Gold, palladium, and platinum aerogels are shown in the SEM images in Fig. 3. For the SEM images and all subsequent discussion, Au aerogels were synthesized from 0.1 M [AuCl4]− and 0.1 M DMAB, Pd aerogels were synthesized from 0.1 M [PdCl4]2− and 0.1 M NaBH4, and Pt aerogels were synthesized from 0.1 M [PtCl6]2− in 50% ethanol and reduced with 0.1 M DMAB. All reactions were performed at a 1:1 (v/v) of salt solution to reducing agent. SEM images indicate porous networks with contiguous metal ligaments for all three metals. Aerogel ligament diameter and pore sizes seen in Fig. 3 were analyzed with ImageJ. Gold aerogels appear to have smooth, fused elements ranging in diameter from 18 to 280 nm (average = 63.7 ± 36.0 nm), with large macropores ranging in size from 50 to 600 nm (average for meso- and macropores = 148.8 ± 121.5 nm). Palladium and platinum aerogels differ from gold in that they present a “string-of-beads” fused nanoparticle appearance with a rougher surface than gold. Palladium ligaments are 12–65 nm in diameter (average = 34.5 ± 9.5 nm) with macropores ranging from 50 to 340 nm (average for meso- and macropores = 82.7 ± 57.7 nm). Platinum ligaments range from 13 to 60 nm in diameter (average = 29.7 ± 9.0 nm), with macropores from 50 to 470 nm (average for meso- and macropores = 98.9 ± 83.7 nm). Based on SEM images, the pore structure for all three metals ranges from meso- to macroporous with the inclusion of very large macropores, likely due to the hydrogen gas evolution during synthesis. The possible effect from gas evolution during synthesis may account for the large standard deviation in pore sizes approaching the magnitude of average pore diameter for Au, Pd, and Pt aerogels. The color transition from red-gold to black for Au gels reduced with DMAB at 10 mM salt concentration and below correlates to structural differences observed in SEM images. Compared to gold aerogel structures with large, smooth, fused elements seen in the SEM images in Figs. 3(a) and 3(b), a string-of-beads structure forms for Au aerogels at a 10 mM salt concentration and below (Fig. S1). The smaller feature size of gold gels synthesized with lower salt concentrations corresponds to the structural features seen in palladium and platinum SEM images in Figs. 3(c)–3(f) and likely accounts for the optical color change observed in the photo images in Fig. 2.
Scanning electron micrographs of (a, b) gold, (c, d) palladium, and (e, f) platinum aerogels.

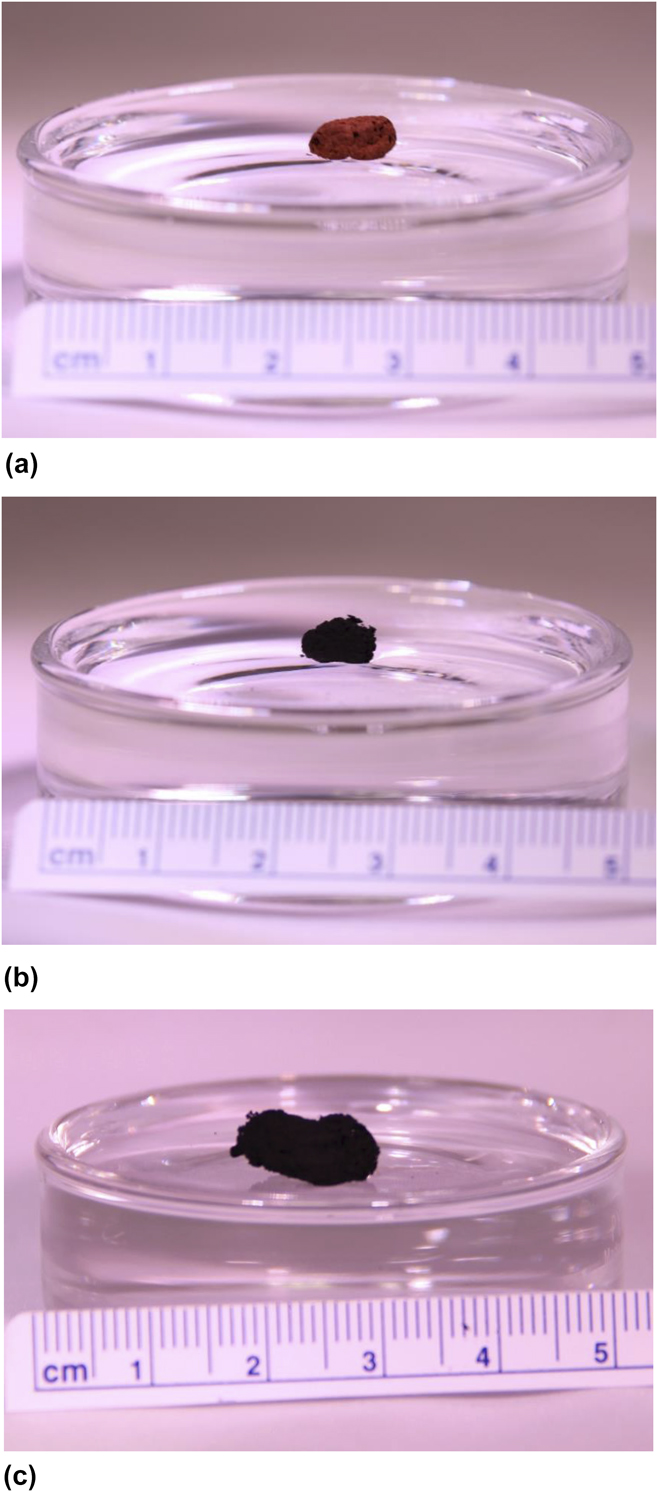
Noble metal aerogel densities were determined by measuring the freeze dried products’ volume and mass. Gold, palladium, and platinum aerogels synthesized from 0.1 M salts had densities of 0.54, 0.065, and 0.055 g/cm3 with corresponding porosities of 97.2%, 99.5%, and 99.7%, respectively. Given the low densities, the aerogels on the order of 1 cm in length are seen floating on water in Fig. 4. These aerogels were synthesized in microfuge tubes and they assumed the general diameter of the tube in its final shape but were smaller relative to the starting reaction volume. This synthesis method is more rapid than sol–gel and other techniques in terms of gel formation time within seconds to minutes. However, in the absence of capping agents and much longer coalescence time, definitive shape control is not yet a feature of this particular approach. It should be noted that gels dried at ambient temperature collapsed under capillary forces and resulted in free-standing films with a similar porous morphology to freeze dried aerogels, but with increased bulk material density.
(a) Gold, (b) palladium, and (c) platinum aerogels floating on water.

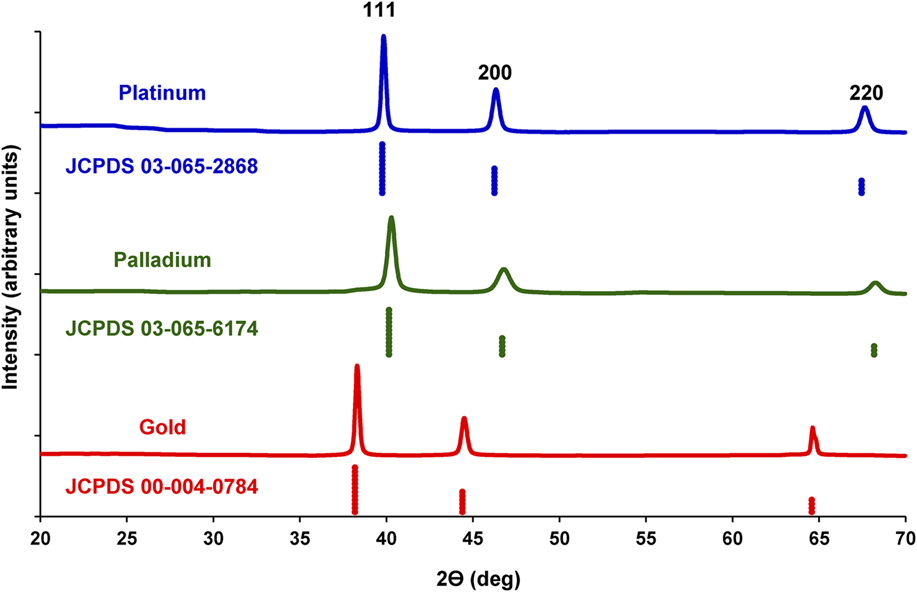
To determine the aerogel material composition, XRD was performed. XRD spectra of the noble metal aerogels are shown for a 2θ range of 20°–70° in Fig. 5. XRD spectra for gold, palladium, and platinum aerogels synthesized from 0.1 M salt precursors were matched to Joint Committee on Powder Diffraction Standard (JCPDS) patterns 00-004-0784, 03-065-6174, and 03-065-2868, respectively. No oxide or other material phase peaks were observed. Gold aerogel peaks were indexed to 38.185°, 44.393°, and 64.578°. Palladium peaks were indexed to 40.145°, 46.695°, and 68.176°. Platinum peaks were indexed to 39.755°, 46.234°, and 67.454°. All aerogels had XRD peaks corresponding to 100, 200, and 220 Miller indices and had a
 $Fm\bar{3}m$
space group for a face centered cubic (FCC) atom arrangement. Crystallite size determined using full width half-max fitting of the 100 peaks indicated crystallite sizes of 43.6, 45.1, and 51.9 nm for Au, Pd, and Pt, respectively. These crystallite sizes generally correspond to the range of ligamentous element thicknesses determined from SEM image analysis.
XRD spectra for platinum (top), palladium (middle), and gold (bottom) aerogels.

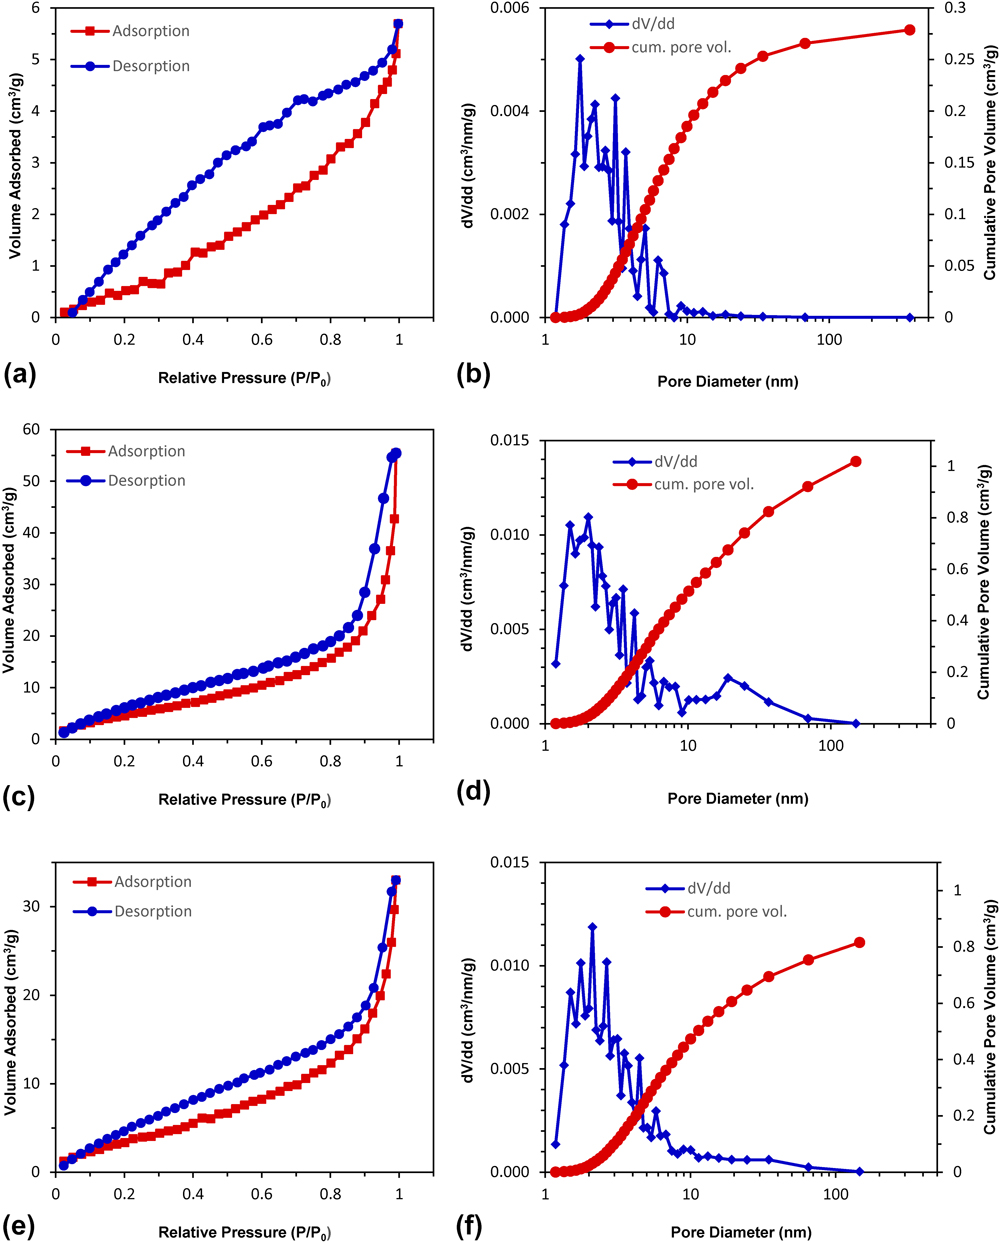
Nitrogen physisorption was performed on Au, Pd, and Pt aerogels. Adsorption–desorption isotherms shown in Figs. 6(a), 6(c), and 6(e) are type IV according to IUPAC standards, indicative of mesoporous materials (2–50 nm). The monolayer-multilayer adsorption at the initial portion of the isotherms and the lack of a plateau at high pressures suggest the presence of macroporous content in the aerogels, which correlates with pore sizes determined from SEM images. This multi-scale porosity is similar to noble metal aerogels formed using sol–gel processes. Reference Walsh, Arcelli, Ikoma, Tanaka and Mann22 The H3 hysteresis loops are similar for Pd and Pt aerogels in Figs. 6(c) and 6(e). H3 loops are often associated with particle aggregates which also correlate with the fused particle structures seen in the SEM images in Fig. 3. The gold aerogel hysteresis loop in Fig. 6(a) displays a combination of H2 and H3 loop characteristics. H2 hysteresis arises when the pore structure is not well-defined, and with pore blocking for a wide distribution of pore neck widths. Reference Sing, Everett, Haul, Moscou, Pierotti, Rouquerol and Siemieniewska42 The combination of H2 and H3 hysteresis indicates the influence of open network effects in the Au aerogels where the network of predominantly macropores as seen in SEM imagery does not completely fill with pore condensate, whereas network effects seem less dominant in Pd and Pt gels. Reference Thommes, Kaneko, Neimark, Oliver, Rodriguez-Reinoso, Rouquerol and Sing44 These hysteresis loops appear consistent with the pore structures seen in SEM imagery in Figs. 3(a) and 3(b) in that Au aerogel samples are comprised of large, smooth, fused particles with a relatively open internal pore network, while the Pt and Pd aerogels appear more similar to agglomerated powders with randomly arranged strands of particles.
Nitrogen adsorption–desorption isotherms and pore size distribution with cumulative pore volume for (a, b) gold, (c, d) palladium, and (e, f) platinum aerogels.

The BJH model for desorption curves was used to calculate pore size distribution. The cumulative pore volume (cm3/g) and pore size distribution (dV/dd) are shown for Au, Pd, and Pt in Figs. 6(b), 6(d), and 6(f), respectively. The pore size distributions indicate predominantly mesoporous length scales between 2 and 50 nm. The relatively small macroporous content seen is attributed to the open pore network not amenable to pore filling, especially in the case of gold. Palladium and platinum do exhibit slightly greater macroporous content, likely due to the smaller pore structure compared to Au aerogels as seen in SEM imagery. A multi-point BET model was applied to the adsorption isotherms to determine the specific surface areas of 3.06, 15.43, and 20.56 m2/g for Au, Pd, and Pt aerogels. These values are in the same range, although slightly lower than previous reports for noble metal aerogels synthesized using sol–gels from preformed nanoparticles. Reference Ding, Chen and Erlebacher28 To examine the correlation of the BET determined specific surface area to the nanostructures observed in SEM imagery, the equivalent diameters were determined. The corresponding equivalent diameters are 85.4, 33.1, and 13.6 nm for Au, Pd, and Pt. These idealized structure diameters generally correlate with the feature size trend of average ligament diameters determined with SEM image analysis, with Au having the largest, and Pt having the smallest features.
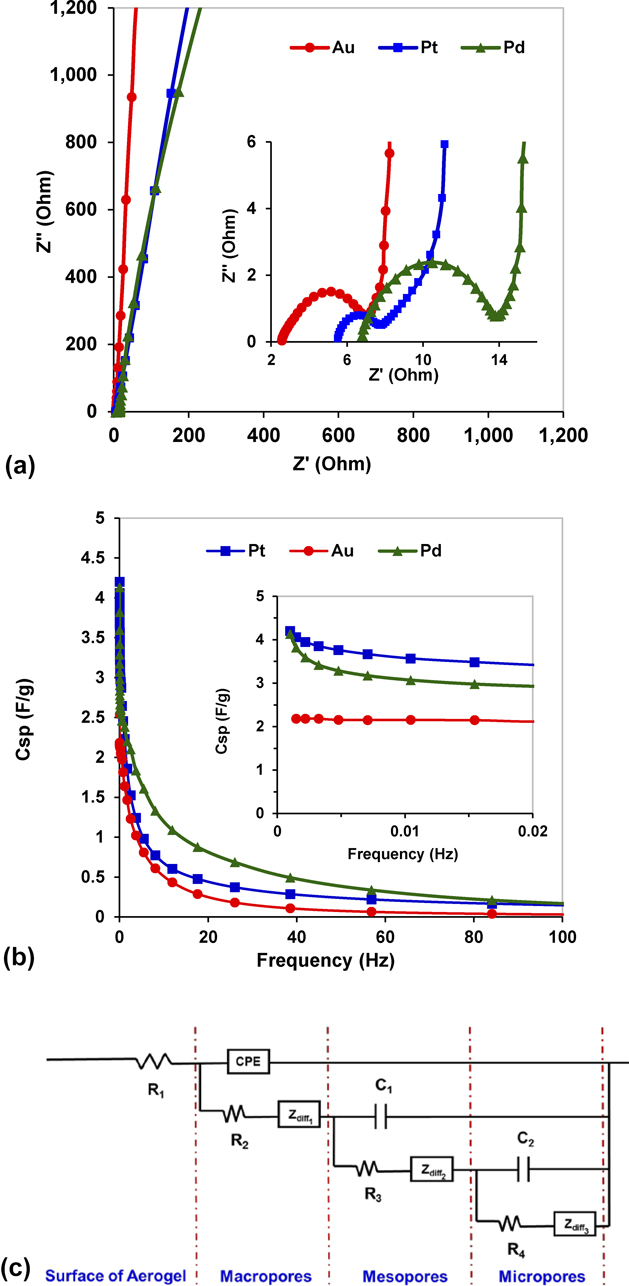
With a relatively high specific surface area indicated by nitrogen physisorption measurements, the solvent accessible surface area was assessed with EIS and CV to determine the feasibility of using the gels for catalytic, energy storage and conversion, and sensor applications. Gels were tested in a frequency range of 1 MHz – 1 mHz, with each representative EIS spectra shown in Fig. 7(a). Au, Pd, and Pt gels exhibit good capacitive behavior at the low frequency range, with Pd and Pt exhibiting a slightly greater non-ideal capacitive character than Au as seen in the near vertical lines at high imaginary components of impedance. The high frequency response for the gels is shown in the inset of Fig. 7(a). The depressed semicircle with slight neck before transitioning to predominantly capacitive behavior at lower frequencies is observed in some porous materials. Reference Barrett, Joyner and Halenda38,Reference Liu, Zhang, Zhan, Long, Qiao, Yang and Ling45 The difference in the equivalent series resistance seen in the real impedance component intercepts is normally associated with solution ion resistance, intrinsic material resistance, and electrode-sample contact resistance. Reference Gamby, Taberna, Simon, Fauvarque and Chesneau46 Given that the supporting electrolyte is the same for all three metal gels, the difference in equivalent series resistances is attributed to a variation in contact resistance between the gel samples and the platinum wire working electrode and possible differences in intrinsic material resistance. At high frequency, the semicircle diameter is normally associated with charge transfer resistance or the internal material resistance in the case of capacitors in the absence of faradaic reactions. Reference Farma, Deraman, Awitdrus, Talib, Omar, Manjunatha, Ishak, Basri and Dolah47 The semicircle diameters are estimated to be 3.88, 7.15, and 2.07 Ω for the Au, Pd, and Pt gels.
(a) Electrochemical impedance spectra for gold, palladium, and platinum gels performed in 0.5 M KCl versus Ag/AgCl reference electrode. [inset of (a)] High frequency EIS spectra from (a). (b) Specific capacitance (C sp) for gels calculated from low frequency EIS spectra in (a). [inset of (b)] Low frequency C sp values. (c) RLC fitted model for EIS spectra.

A number of studies have examined the relationship of electrochemical impedance spectra with the pore structure of porous materials. Reference Barrett, Joyner and Halenda38,Reference Song, Jung, Lee and Dao48 TLMs for electrochemical response were applied by de Levie for porous electrode systems. Reference Brunauer, Emmett and Teller37 In general, transmission line behavior results in a 45° phase angle at high to medium frequencies before turning more vertical at the knee of the curve with increasing capacitive behavior at lower frequencies. Keiser, Beccu, and Gutjahr subsequently demonstrated that the average pore structure could be estimated for porous electrodes and applied specific pore geometries to the TLM which resulted in high frequency semi-circles for certain pore geometries. Reference Barrett, Joyner and Halenda38 Given that at high frequencies ions do not penetrate as deeply into pores as at lower frequencies and that many porous materials have a distribution of pore sizes, Song further extended the TLM to account for both internal pore resistance and pore size dispersion. Reference Gamby, Taberna, Simon, Fauvarque and Chesneau46 Bisquert developed a restricted diffusion model to account for mass transport diffusion resistance, normally accounted for by a Warburg element for semi-infinite diffusion, where the pore size imposes constraints on the development of the double layer. Reference Bisquert49,Reference Bisquert50
Using the TLM with restricted diffusion elements, an equivalent circuit to model the ion diffusion through the noble metal aerogel network pores was fit to each representative EIS spectra. The measured EIS spectra in Fig. 7(a) for Au, Pd, and Pt aerogels were fit with the equivalent circuit model shown in Fig. 7(c). Fitted data are plotted in Fig. S2. The TLM represents the movement of ions through the network of macro-, meso-, and micropores by restricted diffusion. This model is based on a modified Randles circuit consisting of parallel and serially connected resistors (R), capacitors (C) or constant phase element (CPE), and restrictive diffusion elements (Z diff) through the non-homogenous porous network within the aerogel. Reference Bisquert, Garcia-Belmonte, Bueno, Longo and Bulhoes51 A CPE is incorporated into the model to account for non-ideal capacitive behavior observed in porous networks attributed to pore size distribution. Reference Gamby, Taberna, Simon, Fauvarque and Chesneau46 The element R1 represents the high frequency resistance of the electrolyte at the interface of the aerogel. The parallel combination of CPE or C elements with serially connected R and Z diff represents the double layer capacitance, charge transfer and intrinsic material resistance, and restricted diffusion of ions through the multiple layers of hierarchically distributed pores through the internal macro-, meso-, and microporous network. A number of studies modeling cylindrical pore networks result in complex plane plots with a 45° line at high frequency turning to vertical at lower frequencies. For other non-cylindrical arbitrary shaped pores, models suggest semi-circles at high frequency. Reference Barrett, Joyner and Halenda38 The shape of Au, Pd, and Pt gel EIS spectra conform to the modeled complex plane impedance plots from Keiser, Beccu, and Gutjahr for large, pear-shaped pores with small openings. This large pore structure is similar to that seen in SEM images for Au aerogels, as well as the H2 physisorption hysteresis in the Au aerogels attributed to pore blocking with a wide distribution of neck widths. Reference Sing, Everett, Haul, Moscou, Pierotti, Rouquerol and Siemieniewska42
Specific capacitances were calculated from the EIS spectra using the following equation:
 $${C_{{\rm{sp}}}} = {1 / {\left( {2\pi fZ''m} \right)}}\quad ,$$
where f is the frequency, Z″ is the imaginary component of impedance, and m is the mass of the sample. Specific capacitance versus frequency is plotted in the inset of Fig. 7(b) and used to extrapolate the specific capacitance of the gels from the lowest frequencies. From these data, specific capacitances of 2.18, 4.13, and 4.20 F/g are estimated for Au, Pd, and Pt gels. As seen in the inset of Fig. 7(b), as scan frequencies decrease and approach 1 mHz, only the gold gel indicates a leveling off in specific capacitance with the decrease in scan rate, thus fully assessing the gel’s capacitance. Palladium and platinum gel capacitances do not exhibit a plateau approaching 1 mHz suggesting even greater capacitance at lower scan rates. Complete access to the capacitance of the smallest meso- and micropores is limited to all but very low frequencies, below 1 mHz for Pd and Pt gels, whereas the larger macroporous structure in the gold gels allows more complete surface access for capacitance within pores down to 1 mHz scan rates. To estimate the specific surface area of the gels from electrochemical measurements, a nominal range of capacity per area from 20 to 40 µF/cm2 have been used. Reference Lukaszewski, Sosko and Czerwinski52 The capacity per area of a metal is dependent on electrode potential, electrolyte type and concentration, and electrode surface structure. Therefore, an average capacitance per area of 30 µF/cm2 was used as a nominal value for metal surface capacitance. Reference Kornyshev and Irbakh53 Specific surface areas from EIS data are estimated to be 7.27, 13.77, and 14.00 m2/g for Au, Pd, and Pt. These specific surface area estimates from EIS correlate with the trend in surface area from gas physisorption BET measurements from Fig. 6 with gold having the lowest and palladium having the highest estimated values.
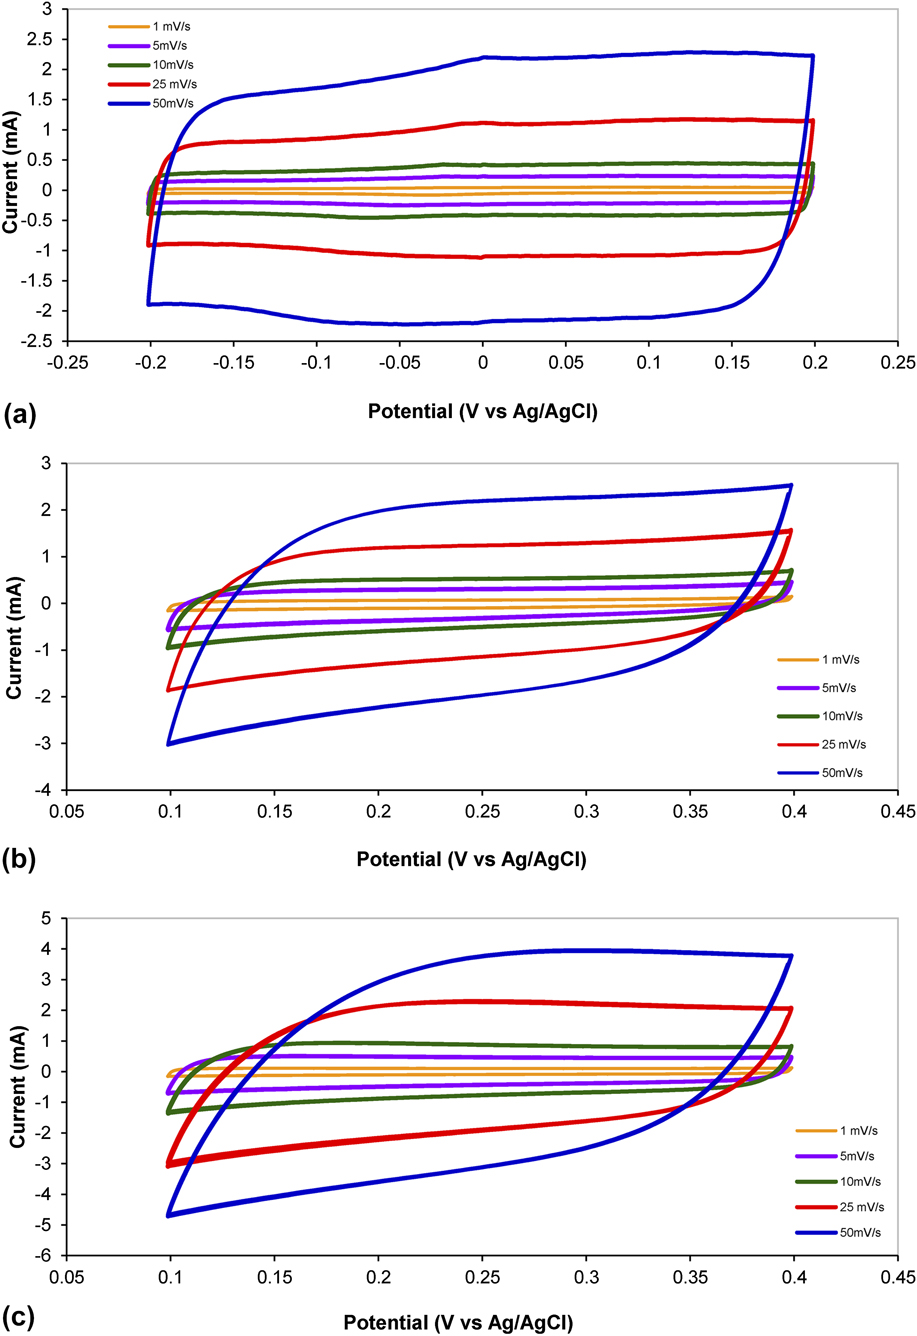
CV was performed using the same electrochemical cell configuration as for EIS. Voltammogram scan rates of 50, 25, 10, 5, and 1 mV/s are shown in Figs. 8(a)–8(c) for Au, Pd, and Pt. All gels display double layer capacitance behavior across the tested voltage windows as indicated by the characteristic rectangular shaped curves. Pd and Pt gels exhibit slight hysteresis at the voltage range limits likely attributable to hydrogen adsorption–desorption just below 0.1 V and metal oxidation-reduction just above 0.4 V (versus Ag/AgCl). The specific capacitance can be calculated from the CV curves using the following equation:
 $${C_{{\rm{sp}}}} = {{\left( {\int {iv{\rm{d}}v} } \right)} / {\left( {2\mu m\Delta V} \right)}}\quad ,$$
where i and v are the current and potential in the CV test (A and V), µ is the scan rate (V/s), m is the mass of active materials (g), and ΔV is the potential window of discharge (versus Ag/AgCl). Specific capacitance (C sp) values for Au, Pd, and Pt gels calculated from the 1 mV/s scan rate are 2.67, 7.99, and 5.12 F/g. Estimating the specific surface area using the nominal value of 30 µF/cm2, the same as for EIS capacitances, yields 8.90, 26.63, and 17.07 m2/g. A comparison of specific surface areas estimated from EIS and CV capacitances and BET measurements is shown in Table II. In general, there is a correlation between specific surface area estimates determined from the three experimental techniques for each metal aerogel. Specific capacitances determined with EIS and CV are in close agreement in the case of gold with 2.18 and 2.67 F/g, respectively. Palladium gel specific capacitances from EIS and CV are 4.13 and 7.99 F/g with the CV determined value nearly twice as large. The EIS and CV determined specific capacitances are also close for Pt gels with 4.20 and 5.12 F/g, respectively. The specific surface areas estimated from EIS and CV measurements using an average metal capacitance per area value of 30 µF/cm2 indicate a reasonable correlation with BET determined specific surface areas. BET, EIS, and CV determined specific surface areas were 3.06, 7.27, and 8.90 m2/g for Au; 15.43, 13.77, and 26.63 m2/g for Pd; and 20.56, 14.00, and 17.07 m2/g for Pt. These specific surface area values are close to or less than a factor 2 of each other. Given the range of metal capacitances in general of 20–40 µF/cm2, the specific surface areas estimated from electrochemical measurements are sensitive to the value selected. Using the limits of the metal capacitance per area range, the electrochemically determined specific surface areas remain within a factor of 2–4 from BET surface area measurements.
Cyclic voltammetry at scan rates of 50, 25, 10, 5, and 1 mV/s for (a) gold, (b) palladium, and (c) platinum gels. Voltage windows are (a) −0.2 to 0.2 V and (b, c) 0.1–0.4 V (versus Ag/AgCl).

Aerogel specific surface areas estimated from EIS and CV capacitances and BET.

IV. CONCLUSIONS
We have presented a method to rapidly synthesize high surface area, monolithic noble metal aerogels of gold, palladium, and platinum with densities of 0.54, 0.065, and 0.055 g/cm3, respectively. The use of 1:1 (v/v) ratios of salt solution to reducing agent facilitated a gel formation mechanism proposed to proceed from nanoparticle nucleation, growth, densification, fusion, and equilibration. Salt solutions reduced with DMAB and sodium borohydride rapidly formed gels within seconds to minutes above a threshold salt concentration and were then rinsed and freeze dried. The resulting Au, Pd, and Pt aerogels presented no detectable oxide phases with XRD. Polycrystalline feature sizes determined with XRD correlate with SEM structural analysis. Specific surface areas determined with BET nitrogen gas physisorption were determined to be 3.06, 15.43, and 20.56 m2/g for Au, Pd, and Pt. Electrochemically determined specific capacitance measurements using impedance spectroscopy and CV were 2.18, 4.13, and 4.20 F/g and 2.67, 7.99, and 5.12 F/g for Au, Pd, and Pt, respectively. Specific surface areas calculated from electrochemically determined capacitances correlate well with BET values. Specific surface areas calculated from EIS data are estimated to be 7.27, 13.77, and 14.00 m2/g and those from CV data are estimated to be 8.90, 26.63, and 17.07 m2/g for Au, Pd, and Pt. The direct synthesis method presented here used in conjunction with catalyst template supports such as biotemplating and/or with capping agents may also assist in achieving the objectives of shape and size control in the future. The rapid synthesis, high solvent accessible specific surface area, conductivity, and capacitance make these noble metal aerogels promising candidates for a wide array of catalytic, energy storage, and sensor applications.
Supplementary Material
To view supplementary material for this article, please visit https://doi.org/10.1557/jmr.2017.412.
ACKNOWLEDGMENTS
The authors are grateful to Dr. Deryn Chu at the Army Research Laboratory-Sensors and Electron Devices Directorate, Dr. Christopher Haines at the Armament Research, Development and Engineering Center, U.S. Army RDECOM-ARDEC, and Dr. Stephen Bartolucci at the U.S. Army Benet Laboratories for their assistance. This work was supported by a Faculty Development Research Fund grant from the United States Military Academy, West Point.