Implication
A common problem in dairy production is mastitis, both clinical and subclinical. Subclinical mastitis results in deteriorated milk quality, increased somatic cell count (SCC) and lower milk yield without clinical signs. Furthermore, cows with subclinical mastitis may contribute to a lower bulk tank milk quality. It is rare that all a cow’s udder quarters have subclinical mastitis. Therefore, it could be worthwhile to separate the milk from the individual udder quarters with deteriorated milk quality. To decide when milk should be separated, knowledge about quality alteration at different levels of SCC increase is needed.
Introduction
High quality in the raw milk composition is required to achieve high yield and quality products in the dairy processing industry. One major factor that affects raw milk quality is mastitis. Mastitis causes an increase in milk SCC as an inflammatory response to infection or udder trauma. Milk composition and milk yield are altered when cows have clinical mastitis (Hortet and Seegers, Reference Hortet and Seegers1998). It is not fully evaluated to what extent milk composition is affected by subclinical mastitis, especially when only one udder quarter is affected. Subclinical mastitis usually occurs in one udder quarter (Barkema et al., Reference Barkema, Schukken, Lam, Galligan, Beiboer and Brand1997) and can therefore go unnoticed due to dilution in the composite milk (Berglund et al., Reference Berglund, Petterson, Östensson and Svennersten-Sjaunja2004). Even if cow composite milk has a low SCC, milk from one individual udder quarter may have high SCC and, due to higher enzyme activity, negatively affect the composite milk when mixed during milking. Therefore, milk quality assurance ought to start at udder quarter level with the detection and separation of milk from udder quarters with altered milk composition during milking.
In an earlier study by Forsbäck et al. (Reference Forsbäck, Lindmark-Månsson, Andrén, Åkerstedt and Svennersten-Sjaunja2009), it was found that 30% of cows with cow composite SCC < 100 000 cells/ml had one or more udder quarters with SCC > 100 000 cells/ml, indicating that these quarters were affected. Milk from the affected quarters had higher total protein and whey protein values, but lower casein number and lactose content when compared to milk from healthy opposite udder quarters of the same cow. This indicates that quality alterations do occur in milk from separate udder quarters even when the cow composite SCC is low. Berglund et al. (Reference Berglund, Petterson, Östensson and Svennersten-Sjaunja2004) also showed similar patterns with more than 10% of individual udder quarters with California mastitis test (CMT) score ⩾3 in cow composite milk samples of SCC < 100 000 cells/ml.
Findings by Forsbäck et al. (Reference Forsbäck, Lindmark-Månsson, Andrén, Åkerstedt and Svennersten-Sjaunja2009) further justify studying the ways in which raw milk composition differs in separate udder quarters with increased SCC at a low-to-moderate increase in cow composite SCC. In addition to analyses of gross milk composition, that is, total protein, whey protein, fat, lactose, citric acid, SCC and bacterial content, it is relevant to study the following components to gain a better understanding of how mastitis influences milk composition. Spontaneous lipolysis may occur in mastitic milk, resulting in an elevated free fatty acid (FFA) level, which may cause rancid off-flavour. Milk protein compositions, and especially the caseins and degree of casein degradation, are important factors for the quality of dairy products, that is, yield, texture, flavour and functionality (Auldist et al., Reference Auldist, Coats, Sutherland, Mayes, McDowell and Rogers1996; Kelly et al., Reference Kelly, O’Flaherty and Fox2006). The protein profile, that is, content of caseins and whey proteins, gives an indication of protein quality, in addition to proteolysis. Sodium and potassium contents are abnormal in mastitic milk due to leaky tight junctions (Allen, Reference Allen1990). Lactoferrin is a bacteriostatic protein that prevents bacteria from growing during mastitis (Sordillo et al., Reference Sordillo, Shafer-Weaver and DeRosa1997). Lactoferrin concentration is increased during subclinical mastitis and is significantly correlated with SCC (Hagiwara et al., Reference Hagiwara, Kawai, Anri and Nagahata2003; Lindmark-Månsson et al., Reference Lindmark-Månsson, Bränning, Aldén and Paulsson2006). Lactate dehydrogenase (LDH) is an enzyme in milk that appears in earlier studies to be a promising marker for mastitis (Friggens et al., Reference Friggens, Chagunda, Bjerring, Ridder, Højsgaard and Larsen2007). This parameter has also recently been used in-line as an indicator of mastitis in the management programme, Herd Navigator™ (Herd Navigator, 2009). The relationship between LDH, lactoferrin and milk quality has not yet been fully elucidated. Consequently, the potential of LDH and lactoferrin as markers for milk quality in addition to udder health need investigation.
For cases in which the cow composite milk exhibits only a small increase in milk SCC, milk composition from individual udder quarters has not previously been analyzed using many different parameters. The aim of this study is to gain knowledge on how milk composition is affected at different levels of increased SCC in udder quarter milk when cow composite milk exhibited low-to-moderate SCC levels. The hypothesis is that already at a low increase in cow composite SCC, individual udder quarters might have an elevated SCC and altered milk composition. Milk composition changes will also increase with SCC and affect milk quality negatively.
Material and methods
The study was performed at the Kungsängen Research Centre of the Swedish University of Agricultural Sciences in Uppsala, Sweden. The study was approved by the Uppsala Ethical Committee.
Animals
Milk samples were taken from 42 Swedish Red Breed cows for analysis of milk SCC at udder quarter level. Seventeen of these cows fulfilled the pre-set criteria for participation in the study and were thus used in the experiment. The selected cows had either all udder quarters with low SCC, or one udder quarter with elevated SCC and the other three udder quarters with low SCC. The selected cows were divided into three groups according to their SCC at udder quarter level. Each group contained five or six cows. The three groups, were defined as follows: Group 1 (n = 6) – SCC < 50 000 cells/ml for all udder quarters; Group 2 (n = 5) – 101 000 cells/ml < SCC < 600 000 cells/ml for one udder quarter and SCC < 100 000 cells/ml for the other three udder quarters; Group 3 (n = 6) – SCC > 700 000 cells/ml for one udder quarter and SCC < 100 000 cells/ml for the other three udder quarters. The cows in Groups 1, 2 and 3 had average lactation numbers 1.2, 1.4 and 1.0, respectively. The average lactation week was 29, 33 and 32 for Groups 1, 2 and 3, respectively.
The cows were kept in two different housing systems, one stanchion barn and one loose house barn equipped with automatic milking (AM). All cows were fed according to Swedish recommendations (Spörndly, Reference Spörndly2003). The cows in the stanchion barn were milked twice daily with a milking interval of 9 h during the day and 15 h during the night. The cows in the AM barn were milked on average 2.3 times per day with an average milking interval of 10.4 h, and a range of 6.9 to 18.1 h. All cows included in the study were delivering milk to the dairy processor on the sampling occasion. None of the cows were treated for mastitis.
Milking equipment
The cows in the AM barn were milked with a VMS™ (Voluntary Milking System, provided by DeLaval International AB, Tumba, Sweden) with monovac, pulsation ratio 70 : 30; pulsation rate 60 cycles/min; and system vacuum 42 kPa. The cows in the stanchion barns were milked with a special quarter milking machine (provided by DeLaval International AB) with monovac, pulsation ratio 70 : 30; pulsation rate 60 cycles/min; and system vacuum 42 kPa.
Milk sampling and registration
In order to find cows which fulfilled the criteria for the three groups stated above, 42 cows were milked once, and the milk from each udder quarter was analyzed for content of SCC. New milk samples were collected on the following day from cows which fulfilled the criteria. In both milking systems and during all sampling, all the milk obtained during entire milking from each individual udder quarter was collected in separate containers. Quarter milk samples and cow composite milk samples were collected for analysis. The following sampling routine was used in both systems: after gentle stirring, milk samples were collected from each quarter container and then all milk from each separate quarter was poured in a new container and mixed, and a cow composite sample was taken after gentle stirring. Milk yield from each quarter was registered. The milk sampling tubes for SCC, fat, lactose, total protein, whey protein and citric acid analysis contained approximately 50 ml milk, and were treated with 50 μl (20% w/v) Bronopol, 2-bromo-2-nitropropane-1,3-diol (VWR International AB, Stockholm, Sweden). This means that the milk samples contained 0.02% Bronopol. Milk samples for SCC, fat, lactose, total protein, whey protein and citric acid analysis were stored at +4°C and analyzed in the following day. The samples for all other parameters were frozen and stored at −70°C until analysis.
On the sampling day and the following day, bacteriological samples were collected directly after milking was complete from all udder quarters of the 17 cows. The milk used for bacteriological analysis was collected in sterile tubes directly from the teats. The milk for bacteriological analysis was collected according to the following routine: the teats were wiped with an udder towel, the first beams of milk were rejected and then the teats were disinfected with 70% ethanol and allowed to dry before milk collection.
Analysis of fat, total protein, lactose, citric acid and whey protein
To estimate the content of milk fat, total protein, lactose, citric acid and whey protein, the mid-infrared spectroscopy method (Fourier Transform Instrument, FT 120, Foss, Hillerød, Denmark) was used. The proportion of casein was calculated from the whey protein and total protein proportions using a rennet casein method. In short, 60 μl calcium chloride (48% w/v) was added to 40 ml milk, which was then incubated at 40°C in a water bath. When the temperature reached 40°C, 200 μl rennet (180 ± 10 international milk clotting units) was added. The samples were mixed and allowed to coagulate for 15 to 20 min. The curd was cut into small cubes and then filtered (42 μm) to determine the whey protein fraction via mid-infrared spectroscopy. The casein number was calculated as the proportion of casein in relation to total protein.
Analysis of lactoferrin and LDH
Lactoferrin was determined quantitatively, according to the producer’s instruction, using a commercial enzyme-linked immunosorbent assay (Bovine Lactoferrin ELISA Quantification Kit, Bethyl Laboratories Inc., Montgomery, TX, USA). The analysis of LDH was performed according to Larsen (Reference Larsen2005).
Analysis of sodium and potassium
Sodium and potassium content was determined by a flame photometric method. In short, 1 ml milk sample was mixed with 1 ml trichloroacetic acid and centrifuged (4193 × g) for 20 min at room temperature. A volume of 0.5 ml from the supernatant was added to the flame photometer (Flame Photometer FF-IL 943, ILS Instrumentation Laboratory S.p.A., Milano, Italy) and analyzed.
Analysis of FFAs
Milk samples for FFA analysis were extracted directly after milking. The FFA content was determined using the Autoanalyzer II method (Lindqvist et al., Reference Lindqvist, Roos and Fujita1975).
Analysis of protein profile, proteolysis and non-protein nitrogen (NPN)
The composition of individual milk proteins (protein profile), αs1-casein (αs1-CN), β-casein (β-CN), κ-casein (κ-CN), α-lactoalbumin (α-la), β-lactoglobulin A (β-lg A) and β-lactoglobulin B (β-lg B) in skimmed milk samples was determined using the reverse phase high-performance liquid chromatography method of Bordin et al. (Reference Bordin, Raposo, Calle and Rodriguez2001) and modified according to Hallén et al. (Reference Hallén, Wedholm, Andrén and Lundén2008).
The presence of proteolysis products in the milk samples was evaluated in skimmed milk samples using the flourescamine method of Wiking et al. (Reference Wiking, Frøst, Larsen and Nielsen2002) with one minor modification. This modification comprised a second centrifugation 14 000 × g for 30 min with a filter (10 kDa cutoff), in order to obtain a pure supernatant.
NPN content was analyzed according to International IDF Standard 20B:1993, determination of NPN content (IDF, 1993).
Analysis of SCC and bacteria
The milk samples were analyzed for SCC using electronic fluorescence-based cell counting (Fossomatic 5000; A/S N. Foss, Hillerød, Denmark). Bacteriological analysis of the milk samples was performed by The National Veterinary Institute, Uppsala, Sweden, according to the quality assurance protocol SS-EN ISO/IEC 17025.
Statistical analyses
For statistical analyses, the data were divided into three groups based on SCC in udder quarter milk samples. Numerical values of SCC were used for assigning cows to different groups, and logarithmic values of SCC were used for all statistical analyses. Least square means (LSmeans) and estimated standard errors for contents of total protein, casein, whey protein, casein number, fat, lactose, citric acid, lactoferrin, sodium, potassium, FFA, NPN, LDH, proteolysis, SCC, αs1-CN, β-CN, κ-CN, α-la, β-lg A, β-lg B and yields of milk, total protein, casein, whey protein, fat, lactose, lactoferrin, potassium, sodium, NPN, αs1-CN, β-CN, κ-CN, α-la, β-lg A and β-lg B in cow composite milk in the three groups were calculated with the GLM procedure in SAS 9.1 (Statistical Analysis Systems Institute, 2004) using the following model:
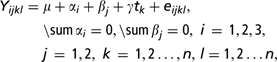
where, μ is the overall mean effect, αi represents the group effect, βj represents the effect of lactation stage, γ describes the effect of hours since last milking, tk is known time point and eijkl is a random measurement error.
The lactation stage was modeled dichotomously: A = lactation week ⩽30 and B = lactation week > 30. The effect of time since last milking was described using a continuous variable.
LSmeans and estimated standard errors for contents of total protein, casein, whey protein, casein number, fat, lactose, citric acid, lactoferrin, sodium, potassium, FFA, NPN, LDH, proteolysis, SCC, αs1-CN, β-CN, κ-CN, α-la, β-lg A, β-lg B and milk yield in milk from affected quarters in Groups 2 and 3 were calculated with the GLM procedure in SAS 9.1 using the following model:
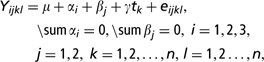
where, μ is the overall mean effect, αi represents the group effect, βj represents the effect of front or rear udder quarter, γ describes the effect of hours since last milking, tk is known time point and eijkl is a random measurement error.
The effect of front or rear udder quarter was described as a discrete variable with two levels: back udder quarter and front udder quarter. The effect of time since last milking was described as a continuous variable.
Udder quarters were defined as either healthy (SCC < 100 000 cells/ml) or affected (SCC > 100 000 cells/ml) (Hamann, Reference Hamann2003) in the three groups. The difference in composition parameters and milk yield between affected and opposite healthy quarters for individual cows was calculated and tested if they differed from zero with the paired t-test in SAS 9.1. In Group 1, opposite front and rear quarters were compared. Right and left sides were randomised.
Results
Comparisons between the groups
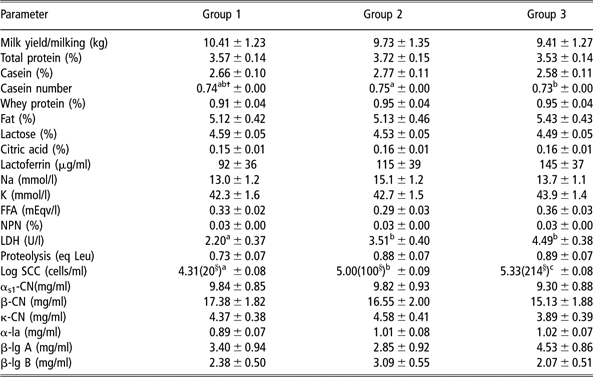
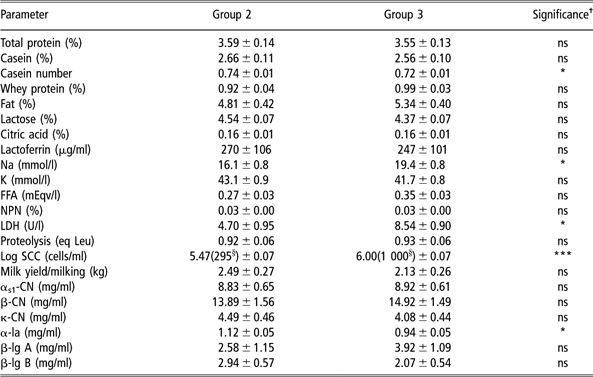
The only significant difference in cow composite milk between all three groups was seen in SCC. The SCC was higher (P < 0.001) when Groups 2 and 3 were compared to Group 1. Group 3 also had higher (P = 0.008) SCC than Group 2. LDH was significantly higher in Groups 2 and 3 compared to group 1 (P = 0.032 and 0.001, respectively). Casein number showed significantly higher (P = 0.050) values in Group 2 compared to Group 3, and lower (P = 0.083) values in Group 3 compared to Group 1 (Table 1). When the affected udder quarters (SCC > 100 000 cells/ml) in group 2 were compared to affected udder quarters in Group 3, LDH (P = 0.02), sodium (P = 0.02) and SCC P = 0.001) were significantly higher, whereas FFA (P = 0.07) showed a tendency to be higher in Group 3 (Table 2). The casein number (P = 0.03) and content of α-la (P = 0.03) was significantly lower in Group 3 compared to Group 2 (Table 2). No significant differences in cow composite milk between the three groups could be seen when yields of total protein, casein, whey protein, fat, lactose, lactoferrin, potassium, sodium, NPN, αs1-CN, β-CN, κ-CN, α-la, β-lg A and β-lg B were compared.
Milk yield and composition (LSmeans ± s.e.) of cow composite samples from cows grouped according to somatic cell count
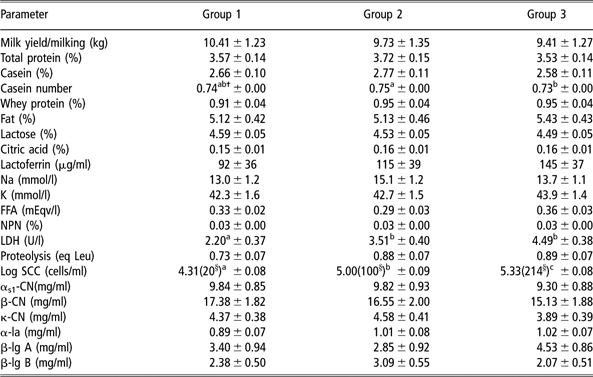
FFA = free fatty acid; NPN = non-protein nitrogen; LDH = lactate dehydrogenase; eq Leu = equivalent mM leucine; SCC = somatic cell count; αs1-CN = αs1-casein; β-CN = β-casein; κ-CN = κ-casein; α-la = α-lactoalbumin; β-lg A = β-lactoglobulin A; β-lg B = β-lactoglobulin B.
†Different superscripts in a row mean significant differences (P < 0.05).
§× 1000, displayed as antilogarithmic values.
Group 1: all udder quarters with SCC < 50 000 cells/ml; Group 2: one udder quarter with SCC 101 000 to 600 000 cells/ml, three udder quarters with SCC < 100 000 cells/ml; and Group 3: one udder quarter with SCC > 700 000 cells/ml, three udder quarters with SCC < 100 000 cells/ml. Values corrected for lactation stage and time since last milking.
Comparison of milk composition and yield between affected Footnote a udder quarter samples from Groups 2 Footnote b and 3 Footnote c
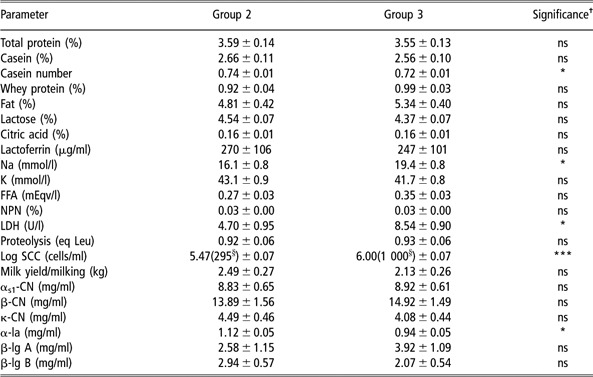
ns = non-significant; FFA = free fatty acid; NPN = non-protein nitrogen; LDH = lactate dehydrogenase; eq Leu = equivalent mM leucine; SCC = somatic cell count; αs1-CN = αs1-casein; β-CN = β-casein; κ-CN = κ-casein; α-la = α-lactoalbumin; β-lg A = β-lactoglobulin A; β-lg B = β-lactoglobulin B.
a SCC > 100 000 cells/ml.
b One udder quarter with SCC 101 000 to 600 000 cells/ml, three udder quarters with SCC < 100 000 cells/ml.
c One udder quarter with SCC > 700 000 cells/ml, three udder quarters with SCC < 100 000 cells/ml.
†* P < 0.05, **P < 0.01, ***P < 0.001.
§ ×1000, displayed as antilogarithmic values.
Results shown are LSmeans ± s.e. and significance calculated according to the statistical analysis in the text.
Comparisons within the groups
Group 1. In Group 1, in which all udder quarters were healthy, no significant differences between front and rear quarters could be seen. No bacterial growth was found in the udder quarters of the cows in this group. The range of cow composite SCC in this group was 7 000 to 30 000 cells/ml.
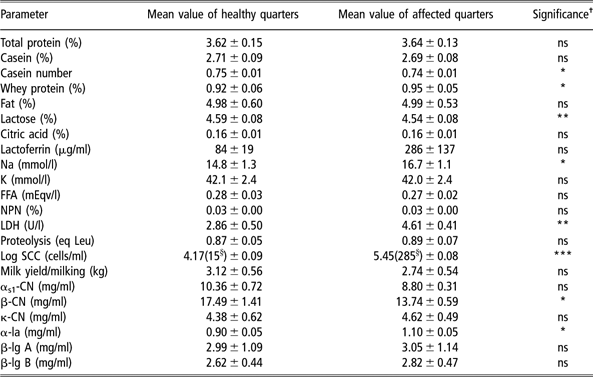
Group 2. In Group 2, casein number (P = 0.012), content of lactose (P = 0.008), αs1-CN (P = 0.094) and β-CN (P = 0.042) were lower in the affected udder quarters (Table 3). Content of whey protein (P = 0.041), sodium (P = 0.047), LDH (P = 0.007), SCC (P < 0.001) and α-la (P = 0.032) showed increased values in the affected udder quarters (Table 3). When yields of the different milk components were studied, casein, lactose, αs1-CN and β-CN yields showed a tendency to be lower in affected udder quarters, whereas yield of lactoferrin showed a tendency to be higher. Group 2 consisted of five cows, of which four exhibited bacterial growth of Coagulase-negative staphylococci (CNS) in the udder quarter with elevated milk SCC. The cow composite SCC in this group varied from 69 000 cells/ml to 157 000 cells/ml.
Comparison of milk composition and milk yield between healthy (<100 000 cells/ml) and affected (> 100 000 cells/ml) udder quarters in Group 2, n = 5
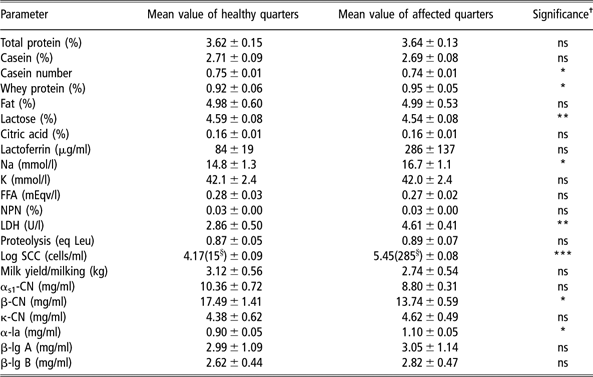
ns = non-significant; FFA = free fatty acid; NPN = non-protein nitrogen; LDH = lactate dehydrogenase; eq Leu = equivalent mM leucine; SCC = somatic cell count; αs1-CN = αs1-casein; β-CN = β-casein; κ-CN = κ-casein; α-la = α-lactoalbumin; β-lg A = β-lactoglobulin A; β-lg B = β-lactoglobulin B.
†*P < 0.05, **P < 0.01, ***P < 0.001.
§× 1000, displayed as antilogarithmic values.
Results shown are mean values of healthy and affected quarters ± s.e. and significance.
Group 2: One udder quarter with SCC 101000 to 600000cells/ml, three udder quarters with SCC<100000cells/ml.
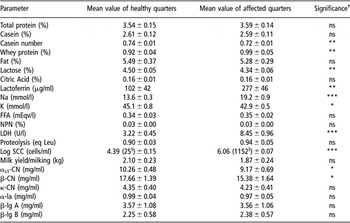
Group 3. The casein number (P = 0.002) and content of lactose (P = 0.003), fat (P = 0.091), potassium (P = 0.013), αs1-CN (P = 0.012) and β-CN (P = 0.028) had lower values in the affected udder quarters in Group 3 (Table 4). Higher contents of total protein (P = 0.087), whey protein (P = 0.006), lactoferrin (P = 0.008), sodium (P < 0.001), LDH (P < 0.001) and SCC (P < 0.001) were found in the affected udder quarters. The total yield of lactoferrin was also significantly (P = 0.018) higher in the affected udder quarters. Of the six cows in Group 3, bacterial growth was found in udder quarters from three of them. Two cows had bacterial growth of Staphylococci aureus and one cow had CNS in the udder quarters with elevated milk SCC. The cows in this group had an SCC at cow composite level ranging between 105 000 and 362 000 cells/ml.
Comparison of milk composition and milk yield between healthy (<100 000 cells/ml) and affected (>700 000 cells/ml) udder quarters in Group 3, n = 6

ns = non-significant; FFA = free fatty acid; NPN = non-protein nitrogen; LDH = lactate dehydrogenase; eq Leu = equivalent mM Leucine; SCC = somatic cell count; αs1-CN = αs1-casein; β-CN = β-casein; κ-CN = κ-casein; α-la = α-lactoalbumin; β-lg A = β-lactoglobulin A; β-lg B = β-lactoglobulin B.
†*P < 0.05, **P < 0.01, ***P < 0.001.
§× 1000, displayed as antilogarithmic values.
Results shown as mean values of healthy and affected quarters ± s.e. and significance.
Group 3: One udder quarter with SCC>700000cells/ml, three udder quarters with SCC<100000cells/ml.
Discussion
In this study, we found that milk from separate udder quarters in cow composite milk with low-to-moderate increase in SCC showed deteriorated milk composition. That includes indications of degradation or decreased synthesis of proteins and increased permeability of the milk–blood barrier.
Comparisons between the groups
Although the SCC at cow composite level was below 220 000 cells/ml in Group 3, the group with the highest SCC in one quarter, significant differences in casein number, LDH and SCC between this group and Group 2 were observed. This shows that the changes in milk composition are greater with increasing SCC even at a low level of composite milk SCC. This is in agreement with the study by Hamann (Reference Hamann2002).
The expected SCC for a healthy cow has been discussed for a long time by different researchers, with various results. Doggweiler and Hess (Reference Doggweiler and Hess1983) find that healthy first parity cows have an SCC of approximately 20 000 cells/ml in foremilk samples at udder quarter level. Hamann (Reference Hamann2002) suggests that an SCC at udder quarter level of up to 100 000 cells/ml should be considered physiologically normal. At cow composite level, it is observed that milk SCC in bacteriologically negative cows was approximately 50 000 cells/ml (Laevens et al., Reference Laevens, Deluyker, Schukken, De Meulemeester, Vandermeersch, De Muecaronlenaere and De Kruif1997; Ma et al., Reference Ma, Ryan, Barbano, Galton, Rudan and Boor2000) and that neither lactation stage nor lactation number affect SCC (Laevens et al., Reference Laevens, Deluyker, Schukken, De Meulemeester, Vandermeersch, De Muecaronlenaere and De Kruif1997). In this study, average cow composite SCC in Group 1 was 20 000 cells/ml and the average lactation number was 1.2, strengthening the assumption that the cows in Group 1 of our study were healthy. In Group 2, in which cows had one affected udder quarter, the average cow composite SCC was 100 000 cells/ml, indicating that cow composite SCC of 100 000 cells/ml does not necessarily represent a cow with four healthy udder quarters.
The fact that Group 2 cows had affected udder quarters was further indicated by the observation that LDH was significantly higher in cow composite milk when compared to Group 1. LDH has recently been incorporated as a mastitis indicator in Herd Navigator™, a new management system that performs automatic in-line milk analyses to monitor metabolic status, udder health and reproduction. Friggens et al. (Reference Friggens, Chagunda, Bjerring, Ridder, Højsgaard and Larsen2007) find LDH to be an accurate mastitis indicator as it reveals significant differences between healthy and mastitic cows at an early stage. In a study in which quarter foremilk from subclinical cows was collected and compared to foremilk from healthy udder quarters, LDH activity is found to be elevated in those quarters with subclinical mastitis (Batavani et al., Reference Batavani, Asri and Naebzadeh2007). This is in accordance with our study. However, a study by Babaei et al. (Reference Babaei, Mansouri-Najand, Molaei, Kheradmand and Sharifan2007) presents higher activity of LDH in milk from cows with subclinical mastitis, but the sensitivity for LDH tests is too low for early detection of subclinical mastitis. Hiss et al. (Reference Hiss, Mueller, Neu-Zahren and Sauerwein2007), who measured LDH using a method suitable for on-line systems, suggested LDH as a potential marker for subclinical mastitis. In our material, LDH seems to be a good indicator for subclinical mastitis. We found significant differences in cow composite milk even for SCC between 100 000 and 214 000 cells/ml, which is an SCC that would not draw much attention in practice. In addition, LDH also could act as a milk quality marker, as compositional differences were found when elevated LDH values were detected.
Although not significant, there are many parameters that show numerical differences in cow composite milk between the three groups. However, the experimental design of this study included a small number of cows and resulted thereby in a large variation, which might explain the small number of significant differences observed.
Comparisons within groups
In Group 1, in which all udder quarters were healthy, no differences could be seen when opposite front and rear quarters were compared. This indicates that the differences in composition between healthy udder quarters within the same cow are minimal, as has been observed in earlier studies (Berglund et al., Reference Berglund, Petterson, Östensson and Svennersten-Sjaunja2007).
In our experiment, lower content of lactose and higher content of sodium were found in milk from affected udder quarters compared to healthy udder quarters in both Groups 2 and 3. In Group 3, milk from affected udder quarters also contained a lower content of potassium. It is well known that lactose content decreases during mastitis (Linzell and Peaker, Reference Linzell and Peaker1972; Kitchen, Reference Kitchen1981; Munro et al., Reference Munro, Grieve and Kitchen1984) as a consequence of the lower blood–milk barrier caused by increased tight junction permeability and damaged epithelial cells. The osmotic pressure of milk is maintained by the balance of concentration of lactose and of soluble minerals (Ling et al., Reference Ling, Kon and Porter1961). Therefore, changes in the sodium and potassium content of milk will result in reduced lactose synthesis and thus milk production (Stelwagen et al., Reference Stelwagen, Farr and McFadden1999). Lactose will also decrease in milk due to losses into the circulation through damaged epithelial cells and leaky tight junctions (Allen, Reference Allen1990). When the tight junctions become leaky, there is an influx of sodium and chlorine into the alveolar lumen, whereas potassium decreases (Kitchen, Reference Kitchen1981; Allen, Reference Allen1990). Bruckmaier et al. (Reference Bruckmaier, Ontsouka and Blum2004) show that there is a numerical difference in sodium concentrations between infected and healthy quarters at SCC levels of 398 000 to 1 000 000 cells/ml, which is in accordance with our results. The differences in lactose between healthy and affected udder quarters is bigger in Group 2 compared to Group 3. In addition, the potassium level does not differ between healthy and affected quarters in Group 2. This indicates that the reduced blood–milk barrier is becoming worse with increasing SCC. The small and non-significant difference in potassium in Group 2 might be explained by the small number of cows, the small changes or the high variation between the samples in this group.
An increased permeability of the blood–milk barrier also results in an influx of serum proteins and enzymes (such as plasminogen) from the blood, which may lead to increased proteolysis. Both Groups 2 and 3 showed altered protein composition in milk from affected udder quarters when compared to milk from healthy opposite udder quarters. Casein number, αs1-CN and β-CN were lower in affected udder quarters, whereas the content of whey proteins was increased. These findings are in line with those of Urech et al. (Reference Urech, Puhan and Schällibaum1999). Haenlein et al. (Reference Haenlein, Schultz and Zikakis1973) present significantly lower contents of casein, αs1-CN, β-CN, β-lactoglobulin, α-lactalbumin and whey proteins, and a lower casein number with increasing degrees of subclinical mastitis and SCC. A study by Le Roux et al. (Reference Le Roux, Colin and Laurent1995) showed that protein composition starts to change even at low levels of SCC (>250 000 cells/ml) in udder quarter milk. In this study, protein composition was also influenced in milk from affected udder quarters in Group 2, for which the udder quarter mean SCC was 285 000 cells/ml. Plasmin and other proteolytic enzymes, such as cathepsin, elastase and collagenase, all contribute to the degradation of caseins in milk (McSweeney et al., Reference McSweeney, Fox and Olson1995; Bastian and Brown, Reference Bastian and Brown1996; Le Roux et al., Reference Le Roux, Laurent and Moussaoui2003; Kelly et al., Reference Kelly, O’Flaherty and Fox2006). Politis et al. (Reference Politis, Lachance, Block and Turner1989) find elevated plasmin concentrations in cow composite milk with SCC of 250 000 cells/ml. Lower levels of αs1-CN and β-CN in milk from affected udder quarters in our study indicate thus either proteolysis from present proteolytic enzymes or decreased casein synthesis. However, we could not find any significant difference in measured proteolysis when comparing milk from affected udder quarters with milk from healthy udder quarters. The reason may be that the total proteolysis is lower than the detection limit of the flourescamine method we used (Haryani et al., Reference Haryani, Datta, Elliott and Deeth2003). In conclusion, the content of lactose, sodium, and potassium and the protein composition changes even with a small increase in SCC.
The total protein content in milk from affected udder quarters was not affected by any degradation or altered synthesis of caseins in the study, as the total protein content was compensated by increased contents of whey proteins. Other studies have shown that the total protein content could be higher due to increased SCC and mastitis (Auldist et al., Reference Auldist, Coats, Rogers and McDowell1995; Urech et al., Reference Urech, Puhan and Schällibaum1999; Nielsen et al., Reference Nielsen, Larsen, Bjerring and Ingvartsen2005) because of an increased whey protein ratio. Using the total protein content as a milk quality marker is therefore questionable, whereas measuring the whey protein content, in addition to total protein, would be a more correct validation of the protein quality of milk.
The fact that the milk samples were taken directly after milking needs consideration. Any proteolysis and lipolysis in these milk samples occurred in the udder or shortly after milking and were probably difficult to detect. This could partially explain why we could not see any differences in FFA in these milk samples. However, most mammalian enzymes would have optimal conditions in the udder at 37°C (Kelly and Fox, Reference Kelly and Fox2006); therefore, conditions for proteolysis and lipolysis in milk are favourable during storage in the udder. The FFA level might already be increased at milk secretion due to the infection and disrupted milk synthesis (Deeth, Reference Deeth2006).
In our study, the lactoferrin values for milk from healthy and affected udder quarters in Group 3 were significantly different, and there were numerical differences both between the groups in cow composite milk and between healthy and affected udder quarters in Group 2. This is in accordance with earlier studies which show that lactoferrin is correlated to SCC (Lindmark-Månsson et al., Reference Lindmark-Månsson, Bränning, Aldén and Paulsson2006; Cheng et al., Reference Cheng, Wang, Bu, Liu, Zhang, Wei, Zhou and Wang2008). In another study, lactoferrin content was significantly higher in milk from udder quarters with subclinical mastitis than in milk from normal udder quarters (Hagiwara et al., Reference Hagiwara, Kawai, Anri and Nagahata2003). This study also finds that milk from cows infected with major pathogens, such as Staphylococcus aureus and different streptococci, contained higher lactoferrin levels compared to milk infected with minor pathogens, such as CNS and Corynebacterium bovis.
As discussed previously, the bacteriological sampling may give false-negative results, as there is a cycling of bacteria and SCC during mastitis (Forsbäck et al., Reference Forsbäck, Lindmark-Månsson, Andrén, Åkerstedt and Svennersten-Sjaunja2009). In our study, we found bacteria in four out of five cows in Group 2 and in three out of six cows in Group 3. There were probably bacteria in the remaining affected quarters too, even though we were unable to detect them with only two sampling occasions.
Conclusion
The major finding of this study was that milk quality deteriorated in individual udder quarters already when cow composite milk had a low level of SCC. Even at a low level of SCC increase in separate udder quarters, there were signs of a reduced blood–milk barrier, and hence influx of minerals and whey proteins, which consequently gave a lower protein quality and lactose level. The milk composition alterations were found to worsen with increasing SCC. Other alterations in the milk, such as lower β-CN and αs1-CN, indicated that there was probably higher enzyme activity and consequently protein degradation or decreased synthesis of caseins. Even when the SCC of cow composite milk is low, increased enzyme activity will cause deterioration during storage and thus have a negative effect on the milk as a whole. This indicates the importance of detecting the level of quality deterioration and of separating milk at udder quarter level. Thus, there is a need for further experiments on the impact that separating milk at the udder quarter level has on milk quality before and after storage.
Acknowledgement
The study was financially supported by the Swedish Research Council for Environment, Agricultural Sciences and Spatial Planning (FORMAS), and received as well strategic money from the Faculty of Veterinary Medicine and Animal Science. The authors thank Professor Dietrich von Rosen for statistical assistance.