In late January 2014, a minor storm producing less than 3 inches of snow left the Atlanta metro area in chaos. The snow stranded motorists for hours on interstate highways, forced students to spend the night at school and shoppers to sleep in supermarkets, and saw babies delivered on roadsides (AP 2014). One state legislator described the scene as a “zombie apocalypse” (ibid). This chaos occurred even though the National Weather Service had accurately predicted the inclement weather and began issuing warnings at noon the day before the storm. Blame quickly focused on the poor preparations made by Georgia Governor Nathan Deal and Atlanta Mayor Kasim Reed. Even TV weatherman Al Roker criticised the response as “poor planning on the mayor’s part and the governor’s part, pure and simple” (Chappell Reference Chappell2014).
While Deal and Reed were both blamed for the governmental response to the storm, their reactions were markedly different. While both acknowledged that the government failed to prepare for or respond to the storm adequately, Deal publicly accepted full responsibility while Reed did not. In a press conference, the governor declared, “I accept responsibility for the fact that we did not make preparation early enough to avoid these consequences… I’m not going to look for a scapegoat. I am the governor. The buck stops with me” (Mascaro and Zucchino Reference Mascaro and David2014). In contrast, Reed deflected blame to others. In one interview, the mayor argued that the traffic problems during the storm were not his fault but were caused by the “independent decisions” of the Atlanta public school system and local businesses to close around the same time and congest roads (CNN Reference Costello2014). Given the same negative event and comparable claims of fault, how did the different responses of Deal and Reed influence the public reaction to each elected official? Headlines and sporadic polls aside, we have a sparse understanding of how politicians’ public responses to adverse outcomes influence the public’s evaluations of their performance. Footnote 1
When a negative outcome occurs, citizens turn their gaze to their mayor, governor, or president – the elected executives at the pinnacle of the institutional hierarchy who manage the resources and personnel of government that may have led to the failure and often play a critical role in redressing the failure (Boin et al. Reference Boin, McConnell, ʼt Hart, Boin, McConnell and ’t Hart2008; Schneider Reference Schneider2008). While other studies explore how adverse outcomes influence the public’s appraisal of elected executives and other political actors (Arceneaux and Stein Reference Arceneaux and Stein2006; Malhotra and Kuo Reference Malhotra and Kuo2008), we focus instead on the effect of the types of public responses, or presentational strategies, elected executives offer in the wake of crises to manage these appraisals (Hood Reference Hood2011).
President Harry Truman placed a sign on his desk in the Oval Office that read, “the buck stops here,” a play on the idiom “passing the buck.” Footnote 2 When elected executives are implicated in the wake of governmental crises, they often adopt the presentational strategy suggested by either of these slogans to try to influence public appraisals of their performance (Boin et al. Reference Boin, ʼt Hart and McConnell2009). Because policy formulation and implementation involve myriad political actors, elected executives can attempt to evade responsibility by “passing the buck” to other actors or entities associated with the policy. We refer to this as blame deflecting. Previous studies posit that blame deflecting is useful because it reduces the blameworthiness of an elected official, thereby shielding her from public disdain (Weaver Reference Weaver1986). Alternatively, elected executives embroiled in crises can “stop the buck” by accepting responsibility for the calamity. We refer to this strategy as blame claiming. Here, the mechanism operates by improving the public’s perceptions of their leadership valence (Stone and Simas Reference Stone and Simas2010; Stone Reference Stone2017), informed by qualities such as honesty and competence, which subsequently enhances their reputations as a quality leaders (Coombs Reference Coombs1995; Busuioc and Lodge Reference Busuioc and Lodge2016).
In this article, we use survey experiments to evaluate how elected executives’ use of presentational strategies in the aftermath of crises influences public opinion. Our study joins an emerging trend in political science, public administration, and public policy scholarship to leverage experiments to study the microfoundations of broader theories (Gaines et al. Reference Gaines, Kuklinski and Quirk2007; Jilke et al. Reference Jilke, Van de Walle and Kim2016; James et al. Reference James, Jilke and Van Ryzin2017a, Reference James, Jilke and Van Ryzin2017b). In this article, we use the attitudes that elites elicit from respondents to learn about how the public evaluates elected executives during crises and how executives’ presentational strategies inform those evaluations (see also Cohen Reference Cohen2017, pp. 417–418). This approach also follows other studies that use surveys to uncover the public costs that politicians may anticipate as they calculate strategies, policies, and actions (Kriner and Reeves Reference Kriner and Reeves2014, Reference Kriner and Reeves2015; Reeves and Rogowski Reference Reeves and Rogowski2015, Reference Reeves and Rogowski2016; Reeves and Rogowski, Forthcoming). The flexibility afforded by experimental design allows us to isolate the causal effect of the two presentational strategies on which we focus – blame claiming and blame deflecting – by constructing scenarios that differ only with respect to the presentational strategy employed. To our knowledge, this is the first such study in these disciplines using experimental methods to gain insights into elected executives’ use of presentational strategies during crises.
Despite a scholarly focus on the mitigation or minimisation of blame to maximise public support (Fiorina Reference Fiorina1977; Weaver Reference Weaver1986; Tilley and Hobolt Reference Tilley and Hobolt2011; Gasper and Reeves Reference Gasper and Reeves2011; Marvel Reference Marvel2014), we argue and present evidence across five different experimental contexts that blame claiming is a far more effective strategy for elected executives to manage public evaluations in the aftermath of a governmental crisis. We also demonstrate that the leadership valence mechanism accounts for a substantial share of the blame claiming effect.
Our findings challenge conventional wisdom concerning the efficacy of blame deflecting. Motivated by political goals, such as electoral success and policy achievement, and a desire “to be well thought of” (Hood Reference Hood2011, pp. 7–8), elected executives facing a governmental crisis often default to blame deflecting behaviour (see also Weaver Reference Weaver1986; Boin et al. Reference Boin, ʼt Hart, McConnell and Preston2010). However, our findings suggest that this is a suboptimal presentational strategy. Executives can best maintain public support through building reputations as quality leaders by taking responsibility when crises strike.
This article proceeds as follows. First, we describe how blame claiming and blame deflecting strategies influence public opinion. Second, we present five survey experiments. The first four feature an elected executive employing different presentational strategies in the context of several governmental crises. A fifth leverages Michigan Governor Rick Snyder’s use of different presentational strategies in his response to the real-world Flint water crisis. Across these experiments, we find that respondents evaluate elected executives more positively when they claim blame, but that blame deflecting induces a null or negative effect on respondents’ evaluations. In additional analyses, we find that these results persist after accounting for other informational cues, such as crisis severity and partisanship. Third, we use causal mediation analysis to demonstrate that a substantial share of the positive effect of blame claiming is mediated by respondents’ evaluations of the executive’s leadership valence. We conclude by discussing the importance of these findings and considering further research.
Blame deflecting, blame claiming, and public opinion
Mayors, governors, and presidents seek the esteem of the public for many reasons. Most directly, public support translates into reelection (King Reference King2001; Brown and Jacobson Reference Brown and Jacobson2008; Campbell Reference Campbell2008). Elected executives can also brandish public support to enact their legislative agendas (Canes-Wrone and De Marchi Reference Canes-Wrone and De Marchi2002), mobilise citizens to vote for copartisan candidates (Herrnson and Morris Reference Herrnson and Morris2007), and pass preferred initiatives and referenda (Lubbock Reference Lubbock, Reilly and R.M.2012). Public support for incumbents is based, at least in part, on retrospective evaluations of officials’ past performance on a vast array of phenomena including the state of the economy (Fiorina Reference Fiorina1981; Lewis-Beck and Stegmaier Reference Lewis-Beck and Stegmaier2000), public service provision (Boyne et al. Reference Boyne, James, John and Petrovsky2009; Burnett and Kogan Reference Burnett and Kogan2017), crime rates (Arnold and Carnes Reference Arnold and Carnes2012), and natural disasters (Arceneaux and Stein Reference Arceneaux and Stein2006; Malhotra and Kuo Reference Malhotra and Kuo2008). As a result, incumbents strategically portray their performance to their constituents to maximise their public support (Fenno Reference Fenno1978; Grimmer Reference Grimmer2013; Druckman and Jacobs Reference Druckman and Jacobs2015). While executives often cultivate support by claiming credit for positive outcomes, they must also manage the public’s attitudes towards deleterious events in order to preserve or build support. We focus here on the latter task executives face. We examine how elected executives’ choice of presentational strategies – the explanatory frames through which a political actor seeks to shape citizens’ perceptions of an event and the actor’s role in it – in the aftermath of a governmental crisis influences public evaluations of the executive.
We define governmental crises as adverse outcomes resulting from the action or inaction of the government which attract public attention. Footnote 3 A governmental crisis, such as an economic downturn, crime wave, failure to provide quality public services, or inadequate response to a natural disaster triggers a “blame game” (Weaver Reference Weaver1986; Brändström and Kuipers Reference Brändström and Sanneke2003; Boin et al. Reference Boin, McConnell, ʼt Hart, Boin, McConnell and ’t Hart2008; Hood Reference Hood2011; Hinterleitner and Sager Reference Hinterleitner and Fritz2017) as citizens seek to understand the cause of the crisis and to attribute blame for it (Kelley and Michela Reference Kelley and Michela1980; Weiner Reference Weiner1985). Governmental crises and the consequent blame games are dangerous for elected officials because their public support may suffer if they are deemed culpable.
While any political actor can be held responsible for a governmental crisis, we focus on elected executives because they are especially vulnerable to blame. Footnote 4 Governors, mayors, and presidents are unitary in their role and function and are typically at the apex of the executive hierarchy of their respective jurisdictions, thus providing them with ultimate authority over and responsibility for the apparatus of government (Bovens Reference Bovens2007, p. 458). While the collective nature of Congress, state legislatures, or city councils helps shield their members from individual blame, elected executives are “held accountable for the broad performance of their agencies,” and “an executive decision is the decision of the individual politician” (Ansolabehere and Snyder Reference Ansolabehere and Snyder2002, p. 315). Footnote 5 As the leaders of the part of government responsible for implementation, executives are more proximate to the actions associated with the adverse outcome and are likely to be held more responsible than the legislature (Arnold Reference Arnold1990). Voters’ expectations of executives and legislators also differ substantially. Governors must “meet the common challenge of facing nearly unlimited responsibility for governing their states (at least in the eyes of voters)” (Kousser and Phillips Reference Kousser and Phillips2012, p. 251). At the national and state levels, voters are more likely to know the name of their elected executive than that of their legislators (Delli Carpini and Keeter Reference Delli, Michael and Keeter1996). When voters draw on “top of the head” considerations to make responsibility attributions for government crises (Taylor and Fiske Reference Taylor and Fiske1978), they are more likely to think of elected executives than of legislators.
Knowing that governmental crises are inevitable, elected executives often structure and implement policies to avoid being implicated when crises stemming from their (in)action manifest in the future (Hood Reference Hood2011; Hinterleitner and Sager Reference Hinterleitner and Fritz2017). Executives may design policies to front-load benefits and delay costs, thus reaping the policies’ rewards and postponing any adverse effects to the future (Weaver Reference Weaver1986; Arnold Reference Arnold1990; Vis Reference Vis2016). Differently, executives can use institutional mechanisms to shift formal responsibility for implementation to other actors in hopes that they will absorb the negative consequences arising from subsequent crises. One such mechanism for shifting responsibility is delegating authority to bureaucrats or other subordinate officials; should a governmental crisis arise, elected executives can use these subordinate officials as “lightning rods” to which they can deflect blame (Ellis Reference Ellis1994; James et al. Reference James, Jilke, Petersen and Van de Walle2016; Vis Reference Vis2016). Similarly, executives may draw officials from other levels of government into the implementation process to create a sense of collective responsibility and diminish the public’s perception of their role (Thompson Reference Thompson1980; Mortensen Reference Mortensen2013). Finally, with the rise of third-party governance, executives can delegate implementation to private contractors to insulate themselves and the government more generally from blame (Marvel and Girth Reference Marvel and Girth2016; Piatak et al. Reference Piatak, Mohr and Leland2017).
However, such blame avoidance behaviours are imperfect, and when they fail to shield elected executives from the blame games surrounding crises, executives must engage in the framing contests associated with these blame games to preserve their reputations (Brändström and Kuipers Reference Brändström and Sanneke2003; Boin et al. Reference Boin, ʼt Hart and McConnell2009; Resodihardjo Reference Resodihardjo2020). While executives can sometimes lean on institutional mechanisms, such as investigatory bodies, to manage blame games (Sulitzeanu-Kenan Reference Sulitzeanu-Kenan2006, Reference Sulitzeanu-Kenan2010; Stark Reference Stark2019; Resodihardjo Reference Resodihardjo2020), they must primarily rely on presentational strategies to influence the public’s perception of their culpability and evaluation of their performance (Hearit Reference Hearit2006; Hood Reference Hood2011; Benoit Reference Benoit2015; Hinterleitner and Sager Reference Hinterleitner and Fritz2017; Hinterleitner Reference Hinterleitner2018).
Though elected executives can employ many different presentational strategies, we focus on two ubiquitous types. First, we consider the public’s response to an executive who deflects blame. Executives’ belief that their public esteem will suffer if the public deems them responsible and blameworthy for a crisis motivates them to avoid blame (Kelley and Michela Reference Kelley and Michela1980; Schlenker et al. Reference Schlenker, Britt, Pennington, Murphy and Doherty1994). Given this belief, executives’ optimal strategy to maintain public support when blame games manifest is to minimise the degree to which the public deems them culpable for the crisis. A conventional means by which to effect this strategy is to deflect blame to others. Executives may implicate bureaucrats, a legislature, or Mother Nature to shift public blame away from themselves (Weaver Reference Weaver1986; Ellis Reference Ellis1994; Hood Reference Hood2011; Hinterleitner Reference Hinterleitner2018). Contemporary examples of such blame deflection abound. For instance, when asked in March 2020 if he took responsibility for the United States’ (US’) lag in testing for COVID-19, President Donald Trump responded, “I don’t take responsibility at all, because we were given a set of circumstances and… rules, regulations, and specifications from a different time” (Trump Reference Trump2020). Again, facing criticism for a high number of murders in late 2019, Baltimore Mayor Jack Young told reporters, “It’s not any lack of leadership on my part… I’m not committing the murders. The police commissioner is not committing (sic) it. The council is not committing (sic) it. So how can you fault leadership?” (Hellgren Reference Hellgren2019). Thus, we expect that elected executives facing a governmental crisis can increase their levels of public support when they deflect blame to others. The mechanism underlying this expectation is that blame deflecting redirects the public’s attributions of blame to other actors, thereby reducing the share of blame ascribed to the executive.
Second, we consider how the public responds to blame claiming. Footnote 6 Instead of deflecting blame, a politician may embrace responsibility for a negative outcome. One potential consequence of this strategy is for voters to more strongly punish executives because it strengthens the linkage between the executive and the crisis, thereby enabling the public to sanction the executive more confidently. Despite this danger, elected executives not infrequently opt to blame claim in the real world. For example, responding to reports that much of the intelligence he used to justify his decision to invade Iraq was flawed, President George W. Bush said, “[I]t is true that much of the intelligence turned out to be wrong. As President, I’m responsible for the decision to go into Iraq, and I’m also responsible for fixing what went wrong by reforming our intelligence capabilities” (Bush Reference Bush2005). Again, addressing complaints concerning his closure of bars and restaurants early on in the COVID-19 pandemic, New York Governor Andrew Cuomo told citizens, “The buck stops on my desk. Your local mayor did not close your restaurants, your bars, your gyms or your schools. I did. I did. I assume full responsibility” (Cuomo Reference Cuomo2020). We argue that elected executives claim blame to manage their public support because it allows them an opportunity to bolster their leadership valence (Stone Reference Stone2017; Stone and Simas Reference Stone and Simas2010), thus improving their reputations as quality leaders (Busuioc and Lodge Reference Busuioc and Lodge2016, Reference Busuioc and Martin2017).
While voters hold elected executives accountable for the outcomes that occur during their tenure, they also draw on their perceptions of executives’ characteristics, such as trustworthiness or competence, to inform their evaluations of their leadership abilities (Miller et al. Reference Miller, Wattenberg and Malanchuk1986; Huddy and Terkildsen Reference Huddy and Nayda1993; Popkin Reference Popkin1994; Bartels Reference Bartels and King2002; McGraw Reference McGraw, Druckman, Green, Kuklinski and Lupia2011). Stone (Reference Stone2017) refers to the dimension of evaluation that considers whether candidates or officeholders “meet fundamental standards of competence to do the jobs to which they aspire and who have the traits and characteristics associated with personal integrity and dedication to public service” as “leadership valence,” which informs citizens’ opinions of candidates or officeholders’ “personal suitability to hold office” (2017, pp. 5–6, p. 18; see also Stone and Simas Reference Stone and Simas2010). Even in an era characterised by high polarisation, Stone (Reference Stone2017) finds that candidates’ leadership valence exerts a positive effect on voters’ evaluations independent of ideology (see also Besley Reference Besley2005; Buttice and Stone Reference Buttice and Stone2012). This same reasoning extends to incumbents’ leadership valence in governing outside of an electoral context. As incumbents govern, they reveal their leadership valence to voters both directly through their actions and behaviour and indirectly through outcomes observed under their watch (Stokes Reference Stokes1992). Through cultivating positive leadership valence, elected executives can enhance their public standing by establishing reputations as high-quality leaders (Busuioc and Lodge Reference Busuioc and Lodge2016, Reference Busuioc and Martin2017; Moynihan Reference Moynihan2012).
Blame claiming, we argue, enables elected executives to improve citizens’ perception of their leadership valence. Hood (Reference Hood2011, p. 55) suggests that public officials who accept responsibility for problems “can present themselves as honest and sincere,” and make themselves look like “they are made of different metal from the stereotype of those slippery politicians and bureaucrats who will go on with denials and evasions….” Similarly, Thompson (Reference Thompson1980, p. 907) asserts that elected officials often participate in the “ritual taking of responsibility” because it “strengthens [their] own political standing – by reassuring the public that someone is in charge and by projecting an image of a courageous leader who does not pass the buck.” Again, Busuioc and Lodge (Reference Busuioc and Lodge2016, pp. 252–253) posit that “being (seen to be) accountable might be said to carry considerable reputational benefits… as accountability has become a prevailing norm of good governance…” Given that citizens expect their mayors, governors, and presidents to have strong leadership abilities, particularly in comparison to legislators (Huddy and Terkildsen Reference Huddy and Nayda1993), elected executives are motivated to leverage opportunities to cultivate reputations as high-quality leaders. Voters may view an incumbent as a stronger leader or more honest and trustworthy as a result of their accepting blame and stopping the buck. Thus, blame claiming enables elected executives to fortify their reputations by improving citizens’ perceptions of their leadership valence, which underlies citizens’ evaluations of those executives.
Despite frequent pronouncements of “the buck stops here” in American politics and theoretical speculation of the effectiveness of blame claiming, there is scant empirical evidence on the matter. One exception is Brändström et al. (Reference Brändström, Kuipers, Daléus, Boin, McConnell and ’t Hart2008), which examines how the governments of Finland, Norway, and Sweden aided their affected citizens and defended those responses in the aftermath of the 2004 tsunami in Southeast Asia, a popular tourist destination for Scandinavian travelers. The study finds that whether the governments decided to apologise and accept responsibility for their own responses influenced their political fates. The governments of Finland and Norway apologised for their posttsunami responses and were spared lasting political harm. However, the government of Sweden, which tried to deflect blame, incurred intense public criticism, faced lengthy government investigations, and lost in the next election due in part to its handling of the tsunami (2008, pp. 136–143). Though not a study of individual behaviour, this evidence suggests that blame claiming is an effective method for maintaining political power. Outside of political science and public administration, experimental studies in communications and psychology have found that when leaders apologise for adverse outcomes, they minimise reputational damage and strengthen positive evaluations of themselves and their organisations (Coombs Reference Coombs1995; Coombs and Holladay Reference Coombs and Holladay2008; Claeys et al. Reference Claeys, Cauberghe and Vyncke2010; Pace et al. Reference Pace, Fediuk and Botero2010). Other studies suggest that blame claiming yields more positive evaluations because they improve perceptions of an individual or organisation’s credibility (Lyon and Cameron Reference Lyon and Cameron2004), trustworthiness (Kim et al. Reference Kim, Ferrin, Cooper and Dirks2004), or ability to provide transformational leadership (Tucker et al. Reference Tucker, Turner, Barling, Reid and Elving2006). We hypothesise that these same mechanisms influence assessments of elected executives who claim blame in the aftermath of governmental crises.
To summarise our theoretical expectations, the classic blame deflection hypothesis is that elected executives in the midst of a crisis will enjoy higher levels of public support when they deflect blame to others. Our blame claim hypothesis is that elected executives embroiled in a crisis can increase their public support by accepting responsibility for the crisis relative to other presentational strategies. We expect the effects of blame deflecting and blame claiming to emerge from their ability to influences respondents’ perceptions of the executives’ blameworthiness for the crisis and leadership valence, respectively.
Empirical analysis
Investigating public attitudes towards real-world elite actions presents several challenges (see Miller and Reeves Reference Miller and Reeves2017; Reeves and Rogowski Reference Reeves and Rogowski2018). Ideally, we could observe a single elected executive utilise different presentational strategies in otherwise identical contexts where polling data is abundant, but this combination of observed elite behaviour and data availability is rare. In light of these challenges, we utilise survey experiments (Gaines et al. Reference Gaines, Kuklinski and Quirk2007; James et al. Reference James, Jilke and Van Ryzin2017a, Reference James, Jilke and Van Ryzin2017b), which allow us to construct realistic governmental crises and then systematically vary the elected executive’s response across different conditions while holding all other facets of the crisis constant. Random assignment of survey respondents to different conditions allows us to isolate effects attributable to the executive’s responses.
Our research design leverages survey experiments to make causal claims and address concerns about the external validity. First, we present results from four experiments which demonstrate the relative benefit of blame claiming in managing public support after a stylised crisis. Second, we enhance the validity of our findings with three additional experiments that embed elected executives’ presentational strategies in more complex information environments accounting for partisanship and crisis severity. We also present an experiment drawing on the real-world Flint, Michigan water crisis and Governor Rick Snyder’s use of blame claiming and blame deflecting strategies during the crisis. This experiment subjects our theories to a hard test because respondents are likely pretreated by their knowledge of and prior opinions concerning the crisis and thus could be less responsive to our treatments (Gaines et al. Reference Gaines, Kuklinski and Quirk2007, pp. 15–16). Footnote 7
Evidence from four governmental crises
Our first set of survey experiments uses stylised scenarios in which an elected executive responds to a governmental crisis. Each study examines an elected executive dealing with the aftermath of one of four crises – a flood, a bridge collapse, a budget shortfall, and a heat wave. A feature of these crises is the ambiguity of responsibility. Blame is often contentious and not directly observable, creating space for political actors to influence the public’s perceptions of an executive’s responsibility (Brändström and Kuipers Reference Brändström and Sanneke2003; Boin et al. Reference Boin, ʼt Hart and McConnell2009). For example, while a politician is unlikely to be responsible for the weather, the mitigation and response are well within her purview (Gasper and Reeves Reference Gasper and Reeves2011; Reeves Reference Reeves2011) such that citizens may blame them for a crisis stemming from an adverse weather event. We fielded the flood study in January 2018 on The American Panel Survey (TAPS), a nationally representative monthly panel survey of approximately 2,000 US adults administered by GfK Knowledge Networks. We fielded our remaining bridge collapse, budget deficit, and heat wave studies in October 2017 on Amazon’s Mechanical Turk (MTurk) with approximately 870 respondents for each study. Footnote 8,Footnote 9
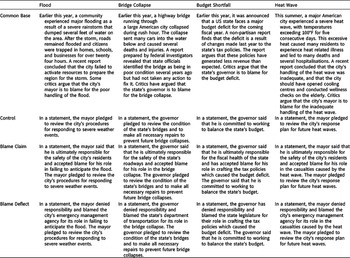
The vignettes we present to respondents in each of these four studies, presented in Table 1, adhere to a common format. In each study, we first present all respondents with a paragraph that describes the crisis, mentions a report that the government is at fault, and notes that critics argue that the elected executive is to blame. Then, we present each respondent with a short second paragraph corresponding with their assigned treatment condition. In the control condition, the elected executive does not comment on fault. Footnote 10 In the blame claim condition, the elected executive takes “ultimate responsibility” for the failure. Finally, in the blame deflection condition, the executive denies responsibility and casts blame onto another actor. Because all treatment conditions provide a response from the elected executive, the key point of comparison among the conditions is how the elected executive addresses blame.
Vignette question wording (four governmental crises)

Note: All subjects in each experimental context are presented with the common base text, followed by the additional text corresponding to their treatment condition.
After each vignette, we ask respondents questions to assess their support for the elected executive. First, we ask, “Do you approve or disapprove of the [mayor’s/governor’s] handling of the [flood/bridge collapse/budget shortfall/heat wave]?” Responses range along a four-point scale from “strongly approve” to “strongly disapprove.” Second, we ask, “How likely would you be to vote for the [mayor/governor] in the next election?” Responses range along a four-point scale from “very likely” to “very unlikely.” Third, we gauge respondents’ views of the elected executives’ leadership valence by asking respondents to indicate how well each of five character traits – “intelligent,” “provides strong leadership,” “honest,” “competent,” and “trustworthy" – describes the executive on a five-point scale ranging from “extremely well” to “not well at all.”
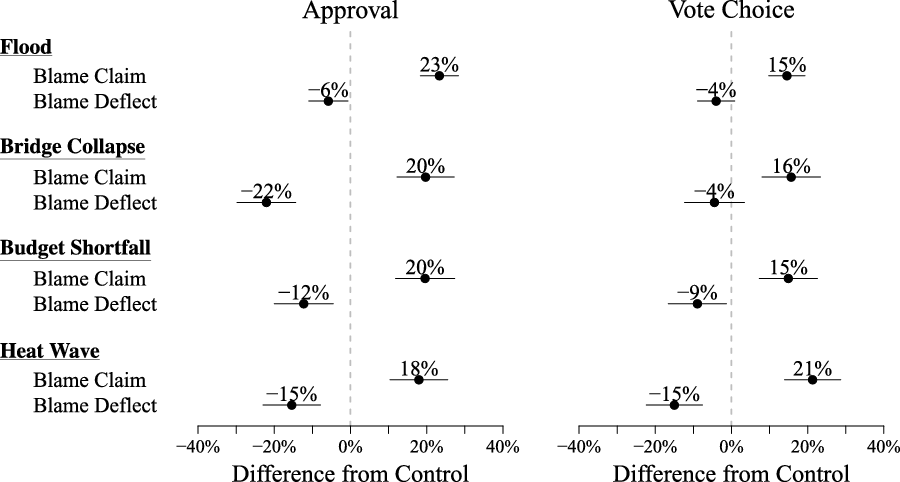
We first consider how the different presentational strategies affect public support for elected executives in the midst of governmental crises. Our results for all four studies are presented in Figure 1. The figure presents percentage point differences in average treatment effects using binary indicators of our outcome measures. Footnote 11 Along the x-axis, we present treatment effects relative to the control for the blame claim and blame deflect conditions for approval of the executive’s handling of the crisis (left panel) and likelihood of voting for the executive in the next election (right panel). Turning first to the left panel, we observe that for all four studies, approval of the executive’s handling of the governmental crisis is between 18 and 23 percentage points higher among respondents in the blame claim condition relative to respondents in the control condition. Footnote 12 In contrast, approval is between 6 and 22 percentage points lower among respondents in the blame deflect condition relative to respondents in the control condition. Footnote 13 The results in the right panel convey a similar pattern. Relative to respondents in the control condition, respondents in the blame claim condition are between 15 and 21 percentage points more likely to vote for the elected executive in the next election. Footnote 14 Respondents in the blame claim conditions are between 4 and 15 percentage points less likely to vote for the executive. Footnote 15 Thus, consistent with our blame claiming hypothesis, our results suggest that the public evaluates elected executives embroiled in governmental crises more favourably when those executives engage in blame claiming rather than offer perfunctory responses (as in the control condition) or deflect blame. Contrary to the blame deflection hypothesis, we find evidence that the public punishes elected executives who deflect blame to others, though the differences in evaluations between the control condition and the blame deflect condition in some of our experiments are not statistically distinguishable.
Effect of elected executives’ presentational strategies on evaluations. Linear regression coefficients for treatment effects of blame claiming and blame deflecting on approval of the executive’s handling of the crisis (left panel) and likelihood of voting for the executive in the next election (right panel) relative to the control condition in each of our four experiments. Positive (negative) values along x-axis reflect more (less) favourable evaluations relative to the control condition. When elected executives claim blame, respondents express higher levels of approval for their handling of the crisis and are more likely to vote for the executive in the next election compared with respondents in the other conditions. For example, when the mayor claims blame for the flood, approval of his handling of the crisis is 23 percentage points higher than when respondents are informed that the mayor merely pledges to address the crisis (control condition) and 29 percentage points higher than when respondents are informed that the mayor deflects blame to the city’s emergency management agency. Bars around point estimates represent 95% confidence intervals.

The preceding four studies provide consistent and substantial evidence of blame claiming in a basic information environment. Reports about governmental crises typically include additional contextual information such as the severity of the crisis and the elected executive’s partisan affiliation, which could subsume or condition the effect of blame claiming on respondents’ evaluations. Though partisanship may be less salient for evaluations of governors and mayors, it may also diminish or eliminate the relative benefits of blame claiming. The power of the partisan heuristic may dilute any other information about an elected official’s behaviour (Campbell et al. Reference Campbell, Converse, Miller and Stokes1960; Mondak Reference Mondak1993). Alternatively, heterogeneous responses may drive the overall effects across copartisan and noncopartisan respondents (Lyons and Jaeger Reference Lyons and Jaeger2014; Bisgaard Reference Bisgaard2015). Similarly, blame claiming may be less effective when the crisis is more severe (Coombs Reference Coombs1995; Claeys et al. Reference Claeys, Cauberghe and Vyncke2010). As the cost of a crisis, as measured by financial losses, human life, or otherwise, grows, executives may confront limited opportunity to influence public appraisals (Hood Reference Hood2011; Hinterleitner and Sager Reference Hinterleitner and Fritz2017).
To ascertain whether the positive effect of blame claiming persists in more complex information environments, we refielded our bridge collapse, budget shortfall, and heat wave studies as factorial experiments. For each, we independently randomised the severity of the crisis, the executive’s partisan affiliation, and the executive’s presentational strategy. Whereas our previous studies varied the executive’s presentational strategy leaving all else constant, a factorial framework allows us to assess whether the blame claiming effect holds as we add complexity to the information environment. For each of the three studies, we investigate whether the blame claiming effect holds across low, moderate, and high levels of crisis severity and for respondents who are copartisans and noncopartisans of the elected executive.
We present a full analysis of these factorial experiments in the Supplemental Information, but we briefly discuss the results here. When looking at the marginal effect of blame claiming without conditioning on crisis severity and partisanship, the positive effect of blame claiming persists at magnitudes similar to those reported in Figure 1. Further, we find no consistent evidence that crisis severity or partisanship conditions the effect of blame claiming. Footnote 16 In the case of crisis severity, we observe that blame claiming induces positive effects across all levels of severity for all three studies, though the relative magnitude of the effect varies across severity and does not follow a consistent pattern. Similarly, we find that blame claiming exerts a positive effect for respondents who are both copartisans and noncopartisans of the executive, but that the relative magnitude of the effect among these groups of respondents varies across the three studies. Thus, our treatment effects persist in the presence of additional relevant information, and we find no consistent evidence that heterogeneous effects drive them.
Evidence from the Flint water crisis
The preceding studies demonstrate consistent positive effects of blame claiming, even when respondents confront complex information environments. One limitation of these studies is that, while they are composites of real-world events, they are constructed. To promote the generalisability of the effects of blame claiming, we conduct an additional study based on the water crisis in Flint, Michigan. Survey experiments based on real-world events and utilising the actual presentational strategies employed by politicians bolster external validity because they incorporate the broader political context in which respondents live. Further, survey experiments based on real-world events often provide a hard test of a posited treatment effect if respondents enter into the experiment with knowledge of or opinions about the event or relevant actors (Gaines et al. Reference Gaines, Kuklinski and Quirk2007, pp. 15–16). For example, if respondents have preexisting knowledge about or opinions of a political actor featured in a survey experiment, the observed treatment effects may be smaller than had the respondents lacked previous knowledge or opinions.
Our Flint study concerns Michigan Governor Rick Snyder’s use of blame claiming and blame deflecting presentational strategies during the Flint water crisis. The crisis, whose effects are still being felt, stemmed from decisions by several state and local officials that contaminated the water in Flint, Michigan, with lead, Legionella, and other harmful bacteria and chemicals (Hanna-Attisha et al. Reference Hanna-Attisha, LaChance, Sadler and Schnepp2016) Footnote 17 Governor Snyder personally appointed several of the key government officials who had caused the crisis, and his administration reacted slowly after warning signs emerged. Because of this, Governor Snyder was a primary target in the initial blame game. Importantly for our study, the governor employed both blame claiming and blame deflecting strategies as he navigated a firestorm of criticism (Morning Joe 2016; Snyder Reference Snyder2016). Therefore, we were able to construct a survey experiment where we vary the type of presentational strategy Governor Snyder employed without using deception. Additionally, because the crisis featured prominently on the national agenda in much of 2015 and 2016 through media coverage, congressional hearings, and presidential debates, Americans outside of Flint were both aware of the crisis and held opinions about the culpability of relevant actors at the time we implemented of our survey experiment. For example, a YouGov survey of American adults fielded in January 2016 indicated that 58% of respondents were following the Flint water crisis “very closely” or “somewhat closely” and that 52% of respondents “strongly disapproved” or “somewhat disapproved” of Governor Snyder’s handling of the crisis. Footnote 18 Thus, many of our respondents were exposed to coverage of the crisis prior to our survey, making their evaluations of the governor resistant to our treatments (Gaines et al. Reference Gaines, Kuklinski and Quirk2007).
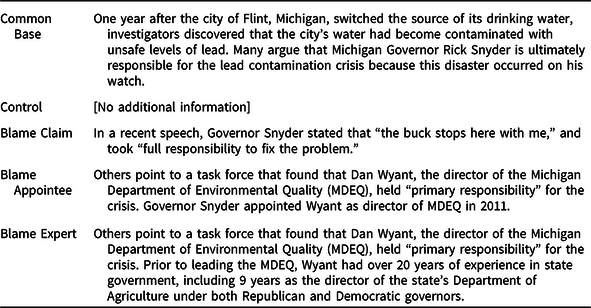
We fielded our Flint experiment on MTurk in March 2016 with 851 respondents. Footnote 19 The structure of our survey experiment resembles that of our previous studies, with a few minor differences. First, the experiment included four conditions: a control condition, a blame claiming condition, and two different blame deflecting conditions (see Table 2 for vignette wording). Each of these blame deflecting conditions implicates other government officials with clear lines of culpability for the crisis; in one condition, blame is deflected to one of the governor’s political appointees, and in the second, blame is deflected to an expert bureaucrat. Second, Governor Snyder does not offer a response in the control condition. Third, blame deflection is attributed to third parties rather than to Governor Snyder himself. Footnote 20 Fourth, we measured respondents’ evaluations of Governor Snyder by asking them to rate the job that the governor had done in handling the Flint water crisis and to indicate whether the governor should resign from or remain in office. Footnote 21
Vignette question wording (Flint)
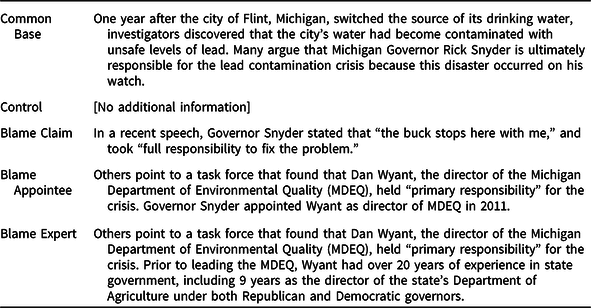
Note: All subjects in the Flint study are presented with the common base text, followed by the additional text corresponding to their treatment condition.
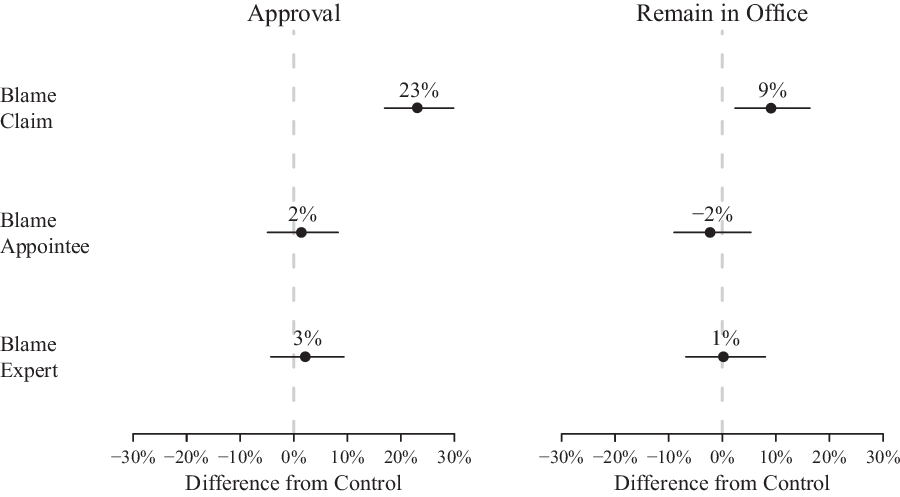
We present the results from our Flint experiment in Figure 2. Each panel presents the treatment effects for the blame claim condition, the blame appointee condition, and the blame expert condition. The left panel presents the results for a binary indicator for whether respondents approved of Snyder’s handling of the crisis. We observe that approval of the governor’s handling of the crisis is about 23 percentage points higher among respondents in the blame claim condition than respondents in the control condition. Footnote 22 Conversely, deflecting blame to an appointee or an expert results in substantively small and statistically indistinguishable increases in approval. Footnote 23,Footnote 24 The right panel presents the results for a binary indicator of whether the governor should remain in rather than resign from office. Compared with the control condition, respondents in the blame claim condition are about 9 percentage points more likely to believe the governor should remain in office. Footnote 25 We again see that the effects of blaming appointees or experts are substantively small and statistically indistinguishable. Footnote 26, Footnote 27 As in our previous studies, we find that elected executives can better manage their public support in the aftermath of governmental crises through blame claiming than through blame deflecting, even when studied in a contextually rich and salient real-world political environment.
Public responses to Governor Snyder’s Flint water crisis presentational strategies. Linear regression coefficients for treatment effects of blame claiming and blame deflecting conditions relative to control condition. In the left panel, positive (negative) values along the x-axis reflect higher (lower) levels of support relative to the control condition. In the right panel, positive (negative) values along the x-axis reflect higher (lower) levels of agreement that the governor should remain in office (rather than resign from office). When Governor Snyder claims blame, respondents are significantly more likely to approve of his handling of the crisis (left panel) than are respondents in the control and blame deflecting conditions. Respondents in the blame claiming condition are also more likely to agree that Governor Snyder should remain in office (right panel) than are respondents in the no response condition and blame deflection conditions. Bars around point estimates represent 95% confidence intervals.

Testing the blame claiming mechanism
In the previous sections, we presented evidence from five studies, all of which found consistently positive blame claiming effects. In this section, we examine the mechanism by which blame claiming improves citizens’ evaluations of elected executives. Specifically, we examine the extent to which blame claiming improves respondents’ evaluations of elected executives through bolstering perceptions of their leadership valence, as we earlier hypothesised. To do so, we further interrogate the findings from our earlier flood, bridge collapse, budget shortfall, and heat wave studies. Footnote 28
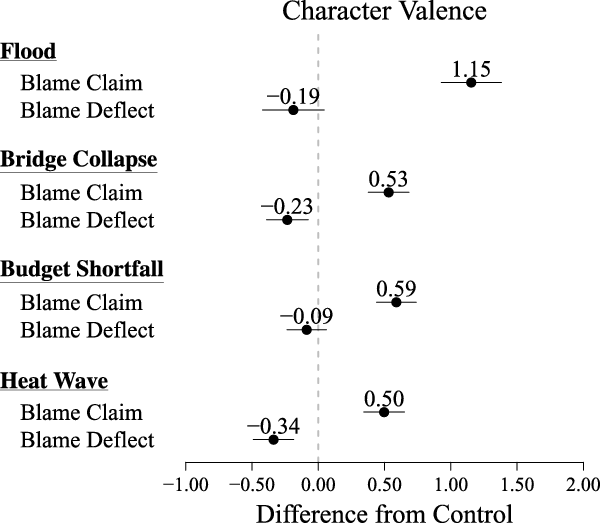
We first consider how elected executives’ presentational strategies influence respondents’ perceptions of their leadership valance, which we define as their assessments of how well five character traits – intelligence, honesty, competency, strong leadership, and trustworthiness – describe the executive along a five-point scale. We construct our measure by scaling these responses. Footnote 29 Figure 3 presents differences in mean levels of the five-point leadership valence scale between respondents in each of the treatments and those in the control. Across all four studies, respondents in the blame claiming condition express more positive perceptions of the executive’s character compared with those in the control condition. Footnote 30 Respondents in the blame deflecting condition, meanwhile, have more negative perceptions, though these effects are statistically distinguishable from zero in only two of the four studies. Footnote 31 For example, in the bridge collapse study, the mean value of the executive’s leadership valence for respondents in the control condition is 2.46 on a five-point scale, and the mean value for respondents in the blame claim condition is 2.99 – an increase of 0.53 points or 21.5%. The mean value for respondents in the blame deflect condition is 2.23 – a decrease of 0.23 points or 9% compared with the control. Thus, we find that respondents perceive elected executives to have more favourable leadership valence when they claim blame for a crisis.
Public evaluations of elected executives’ leadership valence. Linear regression coefficients for treatment effects of blame claiming and blame deflecting on the elected executive’s leadership valence relative to the control condition in each of our four experiments. Positive (negative) values along the x-axis reflect more positive (negative) perceptions of leadership valence relative to the control condition. When elected executives claim blame, respondents express more positive perceptions of the elected executives’ leadership valence compared with respondents in the other conditions. Bars around point estimates represent 95% confidence intervals.

To test our fully specified mechanism – that blame claiming induces more favourable evaluations of an elected executive by increasing citizens’ positive perceptions of the executive’s leadership valence – we employ causal mediation analysis (Imai et al. Reference Imai, Keele, Tingley and Yamamoto2011), which allows us to recover both the direct and mediated effects of blame claiming on public support. Footnote 32 Each treatment effect we estimate in our earlier analyses is itself composed of an average direct effect (ADE), or the effect of the treatment itself on the outcome, and an average causal mediation effect (ACME), or the effect of the treatment on the outcome through a hypothesised mediator. Under the assumption of sequential ignorability, causal mediation analysis recovers unbiased estimates of the ACME, ADE, and the average total effect, which allow us to assess whether a hypothesised mediator does, in fact, mediate the effect of the treatment on the outcome, and the proportion of the total effect that is mediated (Imai et al. Reference Imai, Keele, Tingley and Yamamoto2011, p. 770). Footnote 33
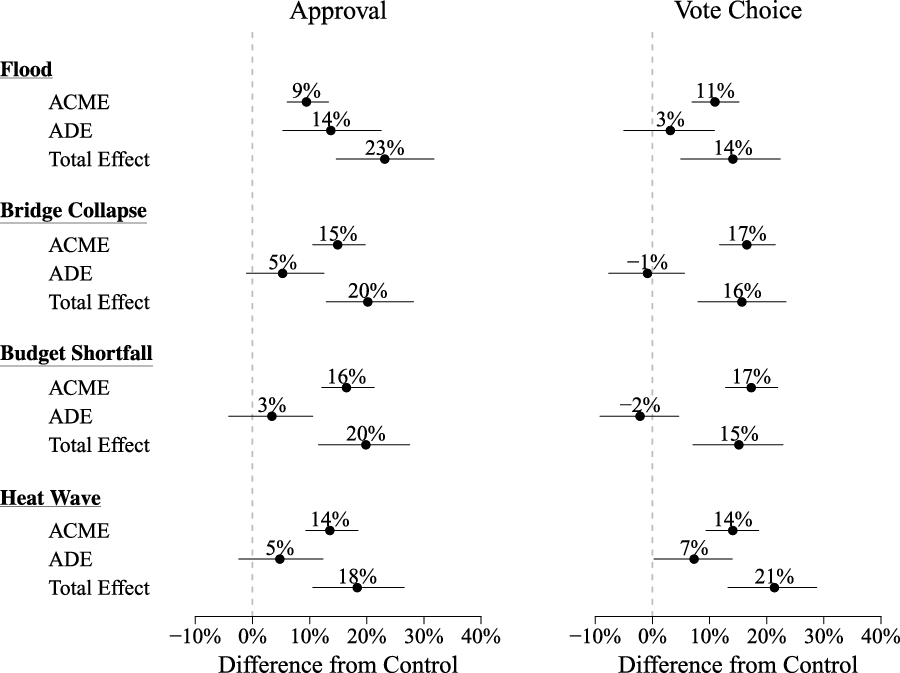
Figure 4 presents our estimates for the mediated (ACME) and direct (ADE) effects of blame claiming on respondents’ approval of the executive’s handling of the crisis (left panel) and likelihood of voting for the executive in the next election (right panel) for each of our four experiments. Footnote 34 In both panels, we observe that leadership valence mediates substantial portions of the blame claiming effects for approval and vote choice. Footnote 35 For example, in the heat wave study the average total effect of blame claiming on respondents’ approval of the executive’s handling of the crisis is an increase in approval of 18 percentage points, and approximately 78% of that total effect (14 out of 18 percentage points) is mediated through respondents’ perceptions of the executive’s leadership valence. For the bridge collapse and budget shortfall, the effects are comparable with leadership valance accounting for 75% (15 out of 20 percentage points) and 80% (16 out of 20 percentage points) of the overall effect, respectively. For our flood study, the mediation effect accounts for a smaller though still sizable 39% share of the total effect (9 out 23 percentage points). For vote choice, the results are even starker. The mediated effect accounts for nearly all of the total effect in the flood, bridge collapse, and budget shortfall study. For the heat wave study, it accounts for 67% of the total effect. As we hypothesised, blame claiming improves evaluations by bolstering individuals’ perceptions of elected executives’ leadership valence.
Causal mediation analysis (mediated effect of leadership valence). Estimated average causal mediation effects (ACME), average direct effects (ADE), and average total effects for respondents in the blame claiming condition relative to respondents in the control condition across each of our four experiments. Estimates in the left and right panels correspond to the mediated and direct effects of blame claiming for approval of the executive’s handling of the crisis and likelihood of voting for the executive in the next election, respectively. Positive (negative) values along x-axis reflect more favourable (less) evaluations relative to the control condition. Across all four experiments, leadership valence, our hypothesised mediator, mediates over 40% of the total effect of blame claiming and in all but one case mediates over half of the total effect. Note that in a few cases, the ADE and ACME for a given experiment and outcome do not sum to the corresponding total effect due to rounding. Bars around point estimates represent 95% confidence intervals obtained through nonparametric bootstraping (percentile method). For details on our estimation procedure, please see Footnote 0 and the Supplemental Information.

Discussion
Our research provides consistent evidence that elected executives can effectively manage their public support during governmental crises through blame claiming. In contexts ranging from floods, bridge collapses, budget shortfalls, and heat waves, to the real-world Flint, Michigan water crisis, the public prefers leaders who stop the buck and accept blame to those who pass the buck and deflect blame or offer perfunctory responses. We also demonstrate in our mediation analysis that improved views of leadership valence account for the beneficial effects of blame claiming. When executives claim blame for a governmental crisis, respondents have improved views of their leadership abilities, which in turn induces more favourable evaluations of the executive. While recent research has postulated that leadership valence plays a substantial role in voting, we find evidence that it also mediates how voters hold elected officials accountable. Though our studies focus on mayors and governors, our findings may be generalisable to other institutional contexts including presidents, business leaders, and any other executives accountable to a constituency.
While our survey experiments offer evidence of the public costs of elite action, our approach also comes with many limitations. Some of these shortcomings reflect opportunities for future research, while others represent constraints from our methodological approach.
One limitation of our study is that we cannot account for the political environment that precedes the crisis, which dramatically shapes what a leader can do and how citizens perceive those actions. The factors that we do not or cannot consider may make blame deflecting a preferable strategy at times. Leaders have established reputations determined by personal characteristics as well as broader structural factors that may inform their choice of presentational strategy (Bennister et al. Reference Bennister, ʼt Hart and Worthy2015, Reference Bennister, ʼt Hart, Worthy, Mark Bennister and ’t Hart2017). Relatedly, our surveys present a single interaction between the respondent and the elected official. In reality, these interactions persist for years. If an executive has repeatedly claimed blame in the past, the approach may have diminishing returns. Strategic leaders may anticipate only a limited number of opportunities to claim blame. While our study focuses on public responsiveness at the time of a crisis, we do not consider the long-term consequences of blame claiming. From a structural perspective, the sequence in “political time” in which a leader holds office may determine a leader’s ability to address a crisis (Skowronek Reference Skowronek1997). These political forces are difficult to approximate using survey experiments and represent a limitation of our approach.
A second limitation from the simplification that comes with our survey experiments is that we do not explore how the behaviour of other actors, such as bureaucrats or political opponents, conditions the effectiveness of blame claiming. We focus on one moment in the blame game – when elected executives respond to criticism for their role in the crisis. Other actors also try to influence the public’s perception of who is at fault for an adverse outcome (Brändström and Kuipers Reference Brändström and Sanneke2003; Boin et al. Reference Boin, McConnell, ʼt Hart, Boin, McConnell and ’t Hart2008), and their actions may moderate the effect of blame claiming on public evaluations of executives. For example, political opponents could exploit an executive’s decision to blame claim by brandishing it as proof of the executive’s culpability, such that executives suffer, rather than benefit from, claiming blame. Conversely, claiming blame may enable executives to reap its rewards by “tak[ing] the wind out of critics’ sails,” forcing critics to either “go on pressing charges, as it were (with the risk that they will be made to look negative and vindictive, thereby unintentionally increasing public sympathy rather than blame for the officeholder), or to accept the apology, drop the charges, and move onto other ground” (Hood Reference Hood2011, p. 54). While this is a limitation in our study, further work could explore how the interplay between elected executives’ blame claiming and the responses of other actors affects public opinion.
A third limitation of our survey experimental approach is that we cannot gauge how the direct costs of mishandling a crisis affect attitudes. When a citizen experiences costs, such as emotional tolls or property damage, they may be less accepting of blame claiming. Our survey respondents did not incur direct costs from governmental crises. In the first four studies, we describe the damages in the context of generic crises. In our Flint survey experiment, the respondents were from across the US, and so the water crisis was unlikely to have directly affected them. For most citizens whose communities are in the midst of a governmental crisis, the direct costs are likely low and diffuse; however, some crises impose severe and salient costs. In these latter cases, the intensity of citizens’ anger may diminish the benefits of blame claiming for embattled elected executives (Hood Reference Hood2011; Hinterleitner and Sager Reference Hinterleitner and Fritz2017). Further research should consider the effectiveness of presentational strategies as these costs are born directly.
In addition to limitations, our findings suggest further avenues of research. First, we test only a limited number of aspects of crises. Just as leaders’ reputations are variable, so is the nature of crises that a leader may face (see Ang, Noble, and Reeves, Forthcoming, for an overview). Crises may be sudden or lingering, and their effects may be dispersed or concentrated. The context in which a leader exercises power conditions the public response (Reeves and Rogowski Reference Reeves and Rogowski2016, Reference Reeves and Rogowski2018; Reeves et al. Reference Reeves, Rogowski, Seo and Stone2017), and further research should explore these additional circumstances.
Second, rather than employing a single presentational strategy, political officials sometimes utilise mixed strategies. They may simultaneously claim blame and diminish culpability by appealing to extenuating circumstances or blaming others. Might the benefits of blame claiming be reduced when politicians simultaneously shift blame to others? Or can political officials enhance their auras of leadership by claiming blame while also deflecting that blame to others? Political officials sometimes employ different presentational strategies during a single blame game (Hood et al. Reference Hood, Jennings, Dixon, Hogwood and Beeston2009; Hood Reference Hood2011; Hood et al. Reference Hood, Jennings and Copeland2016), and the placement of blame claiming in executives’ sequence of actions may impact its effectiveness. For instance, when executives claim blame only after exhausting all other options, the public may deem the action insincere and not reward or even punish them for doing so. Further work should disentangle these phenomena.
Third, future studies should explore the effectiveness of presentational strategies employed by unelected governmental actors embroiled in crises, such as agency heads and street-level bureaucrats. Governmental crises can ensnare nonelected actors, and harm to their public reputations can threaten their career prospects and standing among their peers (Busuioc and Lodge Reference Busuioc and Lodge2016; Moynihan Reference Moynihan2012; Hinterleitner and Sager Reference Hinterleitner and Fritz2019). These unelected actors occupy a distinct position in blame games stemming from governmental crises because they are directly responsible for the government’s response to a crisis (Arnold Reference Arnold1990). They are also vulnerable to blame by their bosses, elected executives, who often craft institutions and policies ex ante to leave them vulnerable to blame and deflect blame for adverse outcomes onto them ex post (Ellis Reference Ellis1994; Hood Reference Hood2011; Mortensen Reference Mortensen2013; Gilad et al. Reference Gilad, Maor and Bloom2015; Nielsen and Moynihan Reference Nielsen and Moynihan2017). Further research should consider how unelected governmental actors approach blame games and whether they also benefit from claiming blame.
Despite our findings, it seems that blame claiming is far less prevalent than blame deflecting (e.g. Weaver Reference Weaver1986; Boin et al. Reference Boin, ʼt Hart, McConnell and Preston2010). As President Kennedy noted after the Bay of Pigs, “victory has a hundred fathers and defeat is an orphan.” Footnote 36 When politicians decide to admit fault, they consider how the public will respond to their admission, which is the focus of this article. They also consider the long-term consequences of their decisions, such as their electoral implications, and grapple with psychological biases that every human faces when deciding to admit blame (Hastorf et al. Reference Hastorf, Schneider and Polefka1970; Zuckerman Reference Zuckerman1979). Our findings suggest that in the face of a crisis, elected executives may be better served by resisting these biases and claiming blame. Compared with blame deflecting, blame claiming enhances citizens’ perceptions of their leadership abilities and, consequently, maximises public support.
In the Cherry Tree Myth, George Washington, a young boy, is said to have chopped down his father’s cherry tree with his new hatchet. When Washington’s angry father confronts him, the boy declares, “I cannot tell a lie… I did cut it with my hatchet” (Richardson, n.d.). He eschews the natural temptation to blame someone else or feign ignorance and instead claims blame for the act. This national fable evokes admiration towards the first president because of his honesty and willingness to take responsibility for his peccadillo. It also encapsulates the findings of this research. Though there are costs for accepting blame and “stopping the buck,” there are also reputational benefits. Just as Washington’s father was likely pleased with his son, we find evidence that the public appreciates when elected executives claim blame for their actions.
Acknowledgements
For helpful comments, we thank Michael Decrescenzo, Justin Fox, George Krause, Susan M. Miller, Benjamin Noble, Jon Rogowski, Steven Webster, Susan Webb Yackee, and seminar participants at the University of Southern California Sol Price School of Public Policy and the University of Wisconsin, Madison.
Supplementary material
To view supplementary material for this article, please visit https://doi.org/10.1017/S0143814X21000039
Data availability statement
Replication materials are available in the Journal of Public Policy Dataverse at https://doi.org/10.7910/DVN/S0XVEQ.