I. INTRODUCTION
During the past decades, inclusion-based biocomposites (such as bioceramics and biopolymers) have been widely used as artificial scaffold materials in tissue engineering, due to their bioactivity, biodegradability, and biocompatibility.Reference Venugopal and Ramakrishna1–Reference Soloviev3 From the mechanical point of view, after combining individual components together, the system performance of composite materials has been reported to be significantly better than that of the original materials.Reference Hull and Clyne4–Reference Barbero6 As one of the key requirements, implanted scaffolds must be strong enough to avoid the fracture during the patient’s normal activities.Reference Reichert, Quent, Burke, Stansfield, Clements and Hutmacher7 Thus, it is of great importance to understand how the surrounding matrix will affect the measured mechanical properties, which will provide guidance for the optimization of material processing to achieve the target design properties.
Numerous studies have proved that nanoindentation is a powerful tool to determine the mechanical properties of composite materials.Reference Herruzo, Perrino and Garcia8–Reference Argatov and Sabina17 However, most of these studies focus on the mechanical properties of bulk composites, the physical interaction between a single fiber and the matrix has rarely been systematically reported. For example, Cao and Chen have investigated the effects of fiber geometry and distribution on the mechanical properties of a bulk composite with aligned fibers at the macroscopic scale, while there are no further studies in a localized area.Reference Cao and Chen18 When performing nanoindentation on inclusions or the matrix at small scale, it is challenging to define the inevitable influence of the surrounding second phase and the influence of the geometric anisotropy of the fiber.Reference Argatov and Sabina17 There is lack of sophisticated studies on how the indentation location and the inclusion orientation would affect the mechanical behavior of the composites. Therefore, in this study, finite element analysis (FEA) is adopted to investigate the elastic response of a fiber reinforced composite during a nanoindentation test. By varying the indentation location and the fiber orientation, this work reveals the correlation between the elastic properties of the fiber reinforced composite and the elastic properties of each individual constituent. In practice, this work can be used to predict the elastic response of periodically reinforced fiber composites or extract the properties of the matrix and the fiber.
II. METHODOLOGY
A. Analytical method
A few models have been developed to study the nanomechanical response of inclusion-reinforced composites in our previous work.Reference Duan, Bull and Chen19 For example, the Clifford model as well as another two linear equations [Eqs. (1)–(3)], which were initially proposed for the nanomechanical characterization of a linear elastic coating/substrate system indented by a rigid spherical tip, have been effectively used to study the spatial-dependent composite elastic modulus of the inclusion/matrix composite.Reference Duan, Bull and Chen19,Reference Clifford and Seah20 Compared to Eqs. (1), Eqs. (2) and (3) require less fitting parameters while maintaining their robustness.
 $${{{E^ * } - E_{\rm{I}}^ * } \over {E_{\rm{M}}^ * - E_{\rm{I}}^ * }} = {{P{z^n}} \over {1 + P{z^n} + Qz}}\quad ,$$
 $${{{E^ * } - E_{\rm{I}}^ * } \over {E_{\rm{M}}^ * - E_{\rm{I}}^ * }} = B \cdot z\quad ,$$
 $${{{1 / {{E^ * }}} - {1 / {E_{\rm{I}}^ * }}} \over {{1 / {E_{\rm{M}}^ * }} - {1 / {E_{\rm{I}}^ * }}}} = B\left( {{e^z} - 1} \right)\quad ,$$
where E*,  $E_{\rm{I}}^ *$, and
 $E_{\rm{M}}^ *$ are the reduced modulus of the composite, inclusion, and matrix, respectively. P, Q, n, and B are the fitting constants. z is the relative contact radius, which is given by
 $$z = {a \over t}{\left( {{{E_{\rm{I}}^ * } \over {E_{\rm{M}}^ * }}} \right)^b}\quad ,$$
where a is the contact radius between the indenter and composite, t is the radius of the inclusion, and b is a fitting constant which weights the elastic mismatch between the inclusion and the matrix.
In addition, to extract the nanomechanical properties of each individual constituent of the fiber/matrix composite, a linear equation and a second-order polynomial equation were also proposed based on numerical fitting, which is given by21,Reference Clifford and Seah22
 $$E = A \cdot \delta + C\quad ,$$
 $$E = A \cdot {\delta ^2} + B \cdot \delta + C\quad ,$$
where E is the composite elastic modulus and δ is the displacement. A, B, and C are the fitting constants. Similar to the conception of ISO 14577,21 the intercept C gives the elastic modulus of the indented material (inclusion or matrix) because when the displacement is approaching to zero, the apparent elastic modulus should be negligibly influenced by the other component (matrix or inclusion).
In these models, no consideration is given to the fiber orientation and indentation location in the inclusion-reinforced composites. Therefore, in this study, we aim to examine the applicability of these models in investigating the effects of indentation location and fiber orientation on the elastic response of a fiber/matrix model system.
B. Finite element method
In practice, when indenting an inclusion/matrix composite, the indentation may not always take place in the center of the inclusion and the fiber inclusions may be randomly orientated. During nanoindentation tests, the indentation direction may be parallel, perpendicular, or at an arbitrary angle to the inclusion axis. Therefore, in this study, by modeling the nanomechanical response of the inclusion/matrix composite indented by using a conical indenter and a Berkovich indenter, FEA was adopted to investigate the effects of the distance between the inclusion and the indenter, the orientation of the fiber inclusion, and the geometry of the indenter during the nanoindentation tests.
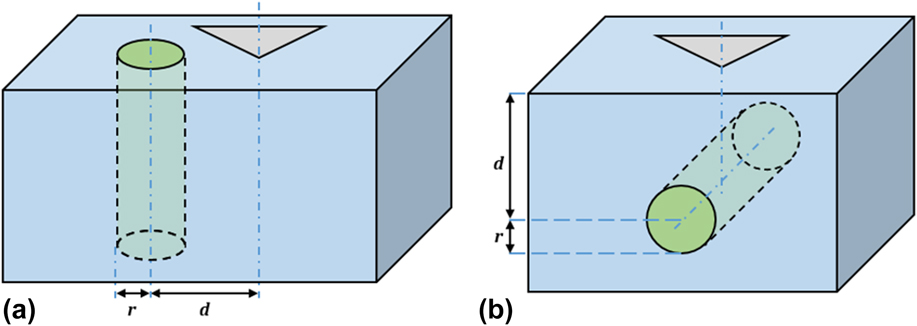
For simplification, the inclusions with vertical orientation and horizontal orientation relative to the indentation direction were modeled. As shown in Fig. 1, r is the radius of the inclusion, which equals 1 µm. d is the horizontal distance between the center of the inclusion and the indentation point in the case of a vertical inclusion, or the vertical distance that the center of inclusion away from the sample free surface in the case of a horizontal inclusion. In this study, the ratio of d/r varied from 0 to 5. For simplification, both the inclusion and the matrix were considered as isotropic elastic materials. The Young’s modulus of the inclusion and the matrix were fixed at 10 MPa and 2 MPa, respectively, with their Poisson’s ratio set as 0.3. As the nanomechanical response of different material combinations has been investigated in previous workReference Duan, Bull and Chen19 and also due to the fact that it is very time-consuming to run the three-dimensional simulations, only one material combination was considered here. Both a Berkovich indenter and a conical indenter were used, with the tip radius of 0.1 µm. Such a tip radius represents a real test. The half-included angle of the conical indenter was set to 70.3°, which was identical to the equivalent angle of the Berkovich indenter.
Schematic of the indentation of reinforced fiber with different orientations in the matrix. (a) A vertical fiber embedded in the matrix and (b) a horizontal fiber embedded in the matrix, with the indenter just above the center of the inclusion.

Due to the symmetric nature of the indenter and the inclusion/matrix composite, a half three-dimensional model was adopted to improve the computational efficiency. Whenever possible (namely, for the horizontal fiber model and for the vertical fiber model when d/r = 0), the model was further simplified to a quarter three-dimensional model or a two-dimensional axisymmetric model to reduce the computing time. The finite element (FE) model was created in ABAQUS 6.14 software (Dassault Systèmes Simulia Corp., Providence, Rhode Island). Figure S1 shows the details of the FE mesh for the representative models: (i) the vertical fiber model when d/r = 2 and (ii) the horizontal fiber model when d/r = 2. The element type is C3D6 (A 6-node linear triangular prism). A minimum number of 200,000 elements were used to create the half model of the inclusion and the matrix (at least 100,000 elements for the quarter model). To improve the simulation accuracy, finer mesh was arranged with proximity to the specimen/indenter contact region. It has been demonstrated that the influence of friction on the indentation response was relatively small,Reference Chen and Bull23,Reference Low, Pun and Yan24 thus the interface between the indenter and the sample was assumed to be frictionless. As the indenter was much stiffer than the specimen, the conical indenter was modeled as a rigid body. While the Berkovich indenter (as shown in Fig. S2) was modeled as a deformable body due to its relatively complicated geometry (in which case it cannot be modeled as a rigid body in ABAQUS software), with its elastic properties the same as diamond (E = 1141 GPa, v = 0.07). The inclusion was assumed to be perfectly bonded with the matrix. For the boundary conditions, a completely fixed boundary condition was applied to the bottom of the specimen, and symmetric boundary conditions were applied to the symmetry planes of the specimen. The height (6 µm) and the width (6 µm from the center of the indentation to the edge) of the model are sufficiently large compared to the penetration depth so that the influence from the sample edges will be minimal. To optimize the efficiency, the movement of the indenter was controlled by displacement. A loading–unloading indentation procedure was applied with the maximum displacement varied from 0.2 to 0.5 µm. As depicted in Fig. S3, the indenter reaches the maximum displacement within 1 s, and then gets back to the original place. In all cases, the elastic modulus of the composite was determined from the force–displacement (F–δ) curves by the Oliver and Pharr method.Reference Oliver and Pharr25
C. Model calibration and curve fitting
There are many semi-analytical models available for determining the Young’s modulus and hardness.Reference Chen and Bull26 In this study, the Oliver and Pharr method was used because it has been widely integrated with software in nearly all commercial nanoindenters.Reference Oliver and Pharr25 While, this procedure involves the calculation of contact area, which may be highly affected by the tip radius. To simulate a real indenter, the tip radius was set to 0.1 μm in this study, which is comparable to the displacement and will consequently induce errors on the determination of contact area.Reference Chen and Bull26 Similar to the experimental tip area function calibration, this study used numerical simulation as the calibration procedure. The matrix was assigned to share the same elastic properties as the fiber (i.e., E = 10 MPa and v = 0.3). Thereafter, the elastic modulus determined by the Oliver and Pharr method was calibrated against the intrinsic elastic modulus. This generates a new area function for data calibration and also eliminates any numerical instability induced errors.Reference Oliver and Pharr25
Matlab code was written to perform the curve fitting and extract the composite elastic modulus. The statistical parameter, coefficient of determination (R 2), was adopted here to represent the quality of the fitting. This statistical parameter varies between 0 and 1. Within this range, a larger value means a better fitting and one represents a perfect fitting.
III. RESULTS AND DISCUSSION
A. Apparent Young’s modulus determined by FEA
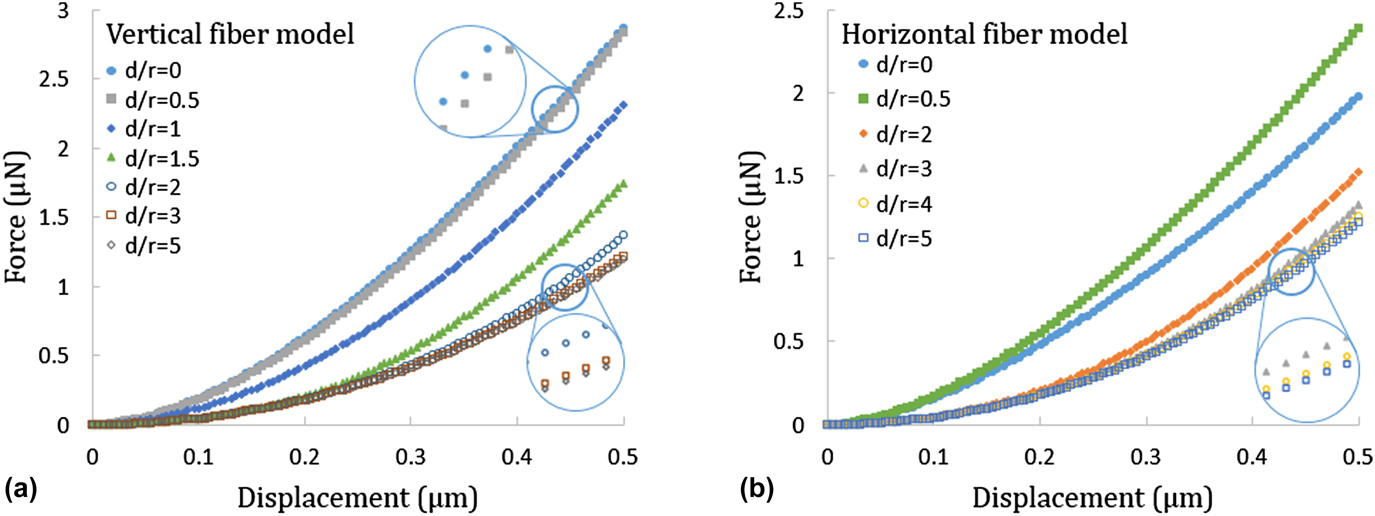
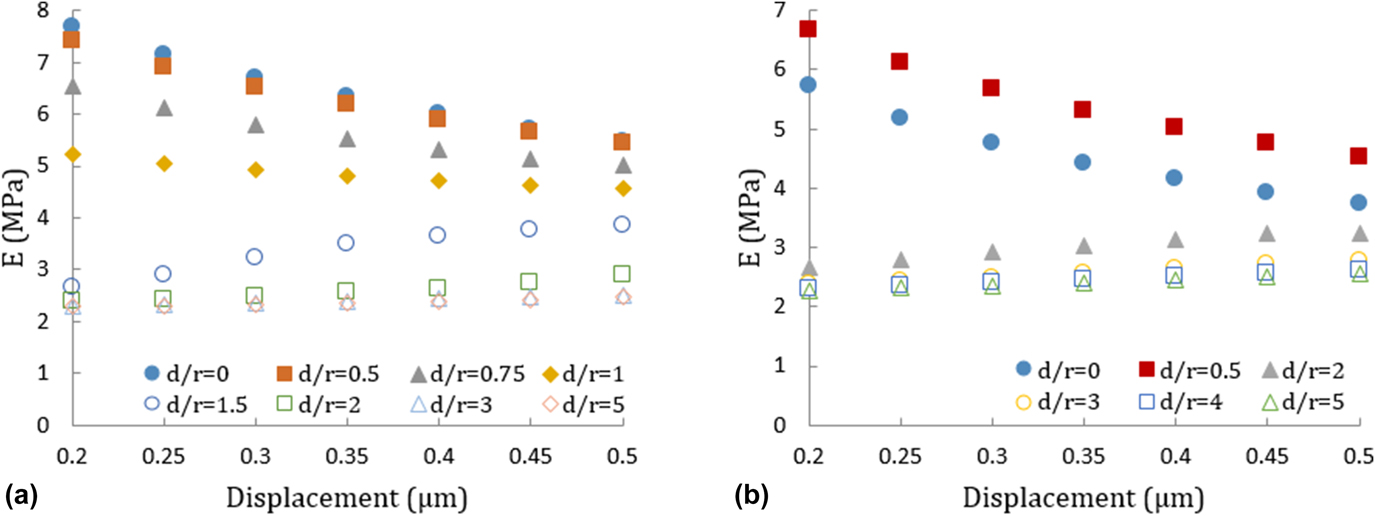
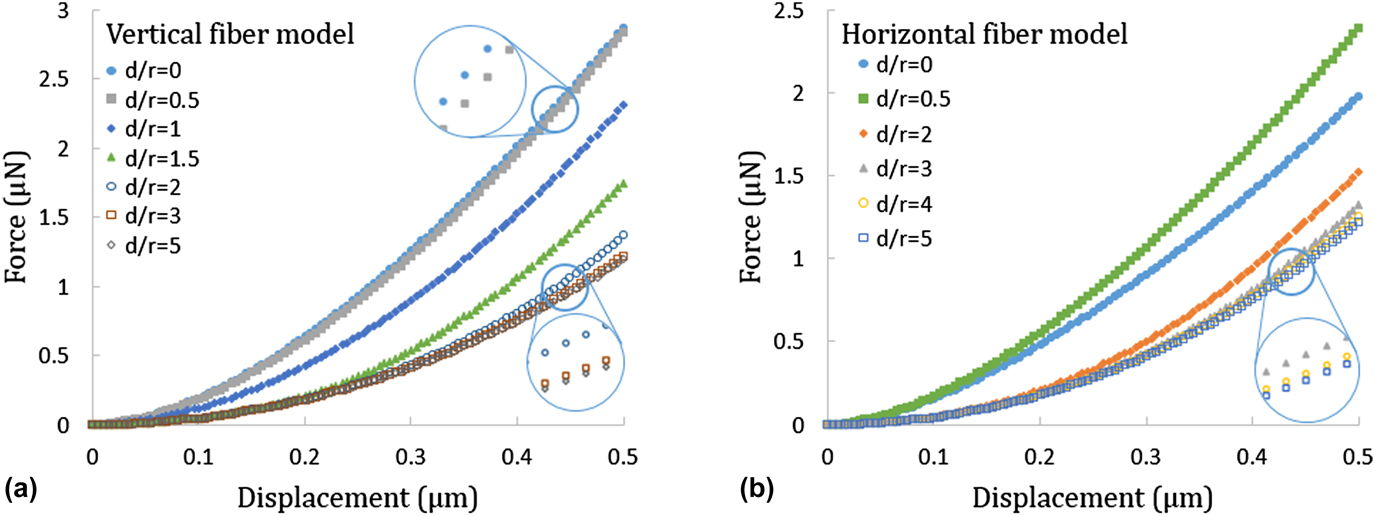
The data in Figs. 2 and 3 show the F–δ curves and the corresponding apparent elastic modulus for the inclusion/matrix models. For the vertical fiber model, the difference between the forces or the depth-dependent composite elastic modulus from d/r equals to 0 and 0.5 are negligible. This indicates that the influence from the matrix is not evident when the ratio of d/r is less than 0.5 (namely, the indentation took place in the region of the inclusion). While, when the indentation takes place in the region of the matrix, the response is matrix-dominated. At the same displacement, the influence from the inclusion is decreasing with the increase of the d/r ratio. That is, when the ratio of d/r equals to 1.5, the influence of the inclusion is not obvious until the displacement reaches approximately 0.2 μm, which suggests that the effective deformation zone began to be affected by the fiber inclusion. When the ratio of d/r increases up to 2, the influence from the inclusion becomes obvious only after the displacement reaches approximately 0.4 μm. When the ratio of d/r is higher than 3, the influence of the inclusion is undetected even after the displacement reaches 0.5 μm, which implies that the effective deformation zone is within 3 μm radius. This phenomenon agrees well with the change of composite elastic modulus shown in Fig. 3. That is, when the ratio of d/r is smaller than 0.5, the composite elastic modulus is significantly decreasing with the increase of displacement due to the increasing effect from the matrix. When the ratio of d/r is higher than 3, the composite elastic modulus is independent of the displacement, which indicates that influence of the fiber on the elastic behavior is negligible in this case. For the horizontal fiber model, this statement is observed as well. Namely, when the ratio of d/r equals to 2, the influence from the inclusion can be observed only after the displacement reaches approximately 0.2 μm. When the ratio of d/r is higher than 3, the influence from the inclusion is negligible when the displacement is within the range of 0–0.5 μm. It seems that there may exist a critical displacement, which raises with the increase of d/r ratio. Within this critical displacement, the indentation response will be insignificantly affected by the other component. On the other hand, as shown in Figs. 2(b) and 3(b), the force and the apparent elastic modulus from the case of d/r equals to 0.5 are always greater than the values from the case of d/r equals to 0. It is because that, when the d/r ratio is between 0 and 0.5, the volume ratio between the fiber and matrix that contributes to the overall deformation of the composite increases. However, this volume ratio decreases when the d/r ratio is larger (i.e., above 2). However, for the vertical fiber model, the volume ratio between the fiber and matrix that contributes to the overall deformation of the composite monotonically decreases with the increase of d/r ratio.
F–δ curves for the indentation test on the (a) vertical fiber model and (b) horizontal fiber model, with the conical indenter.
Composite elastic modulus for (a) the vertical fiber model and (b) the horizontal fiber model, with different distances between the conical indenter and the inclusion.

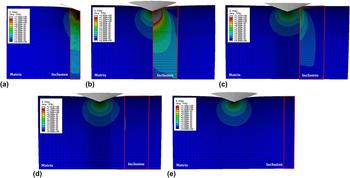
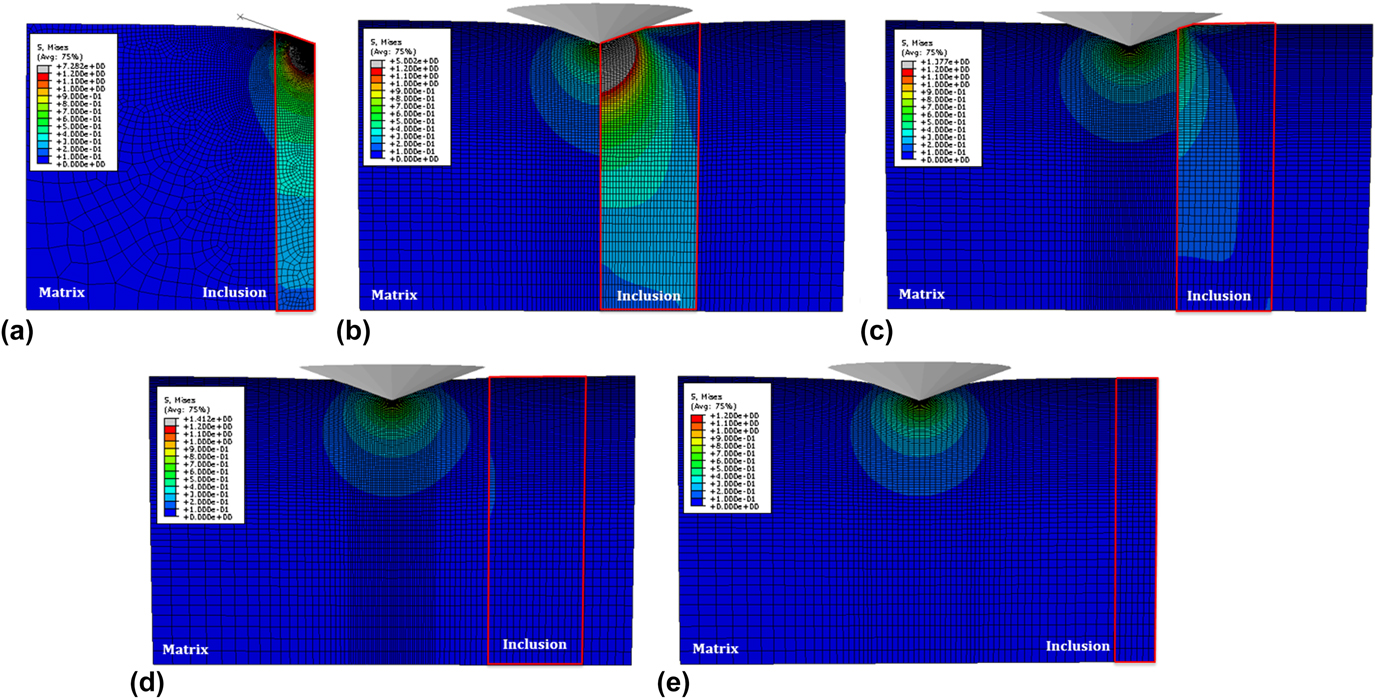
To further analyze the relationship between the ratio of d/r and the corresponding nanomechanical response for the inclusion/matrix model, von Mises stress contours are plotted to represent the stress distribution.Reference Guo and Yen27,Reference Walter, Antretter, Daniel and Mitterer28 As illustrated in Fig. 4, stress contours for the vertical fiber model indented by the conical indenter are plotted with the displacement equal to 0.5 μm. For standardization, the maximum stress limit was set to 1.2 MPa and the minimum stress limit was set to 0 MPa in all the cases. It shows that, for the vertical fiber model, the response is mainly fiber-dominated when the indentation takes place in the region of the fiber [d/r < 1, Fig. 4(a)]. When the interface between the fiber and the matrix is indented [d/r = 1, Fig. 4(b)], both of them will contribute to the resulting response. Even at a small displacement, it is still difficult to extract the individual properties from the corresponding F–δ curve. When the indentation occurs in the region of the matrix [d/r > 1, Figs. 4(c)–4(e)], the response will be matrix-dominated. In this case, the influence from the inclusion can be negligible [Figs. 4(d) and 4(e)] until the indenter directly touches the inclusion [Fig. 4(c)]. It indicates that once the displacement is small enough, the properties for each individual phase can be extracted from the corresponding F–δ curve.
von Mises stress contours for the vertical fiber model with a displacement of 0.5 μm, when (a) d/r = 0, (b) d/r = 1, (c) d/r = 2, (d) d/r = 3, and (e) d/r = 5. For standardization, all the figures share the same stress scale.
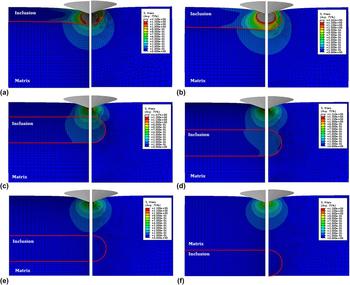
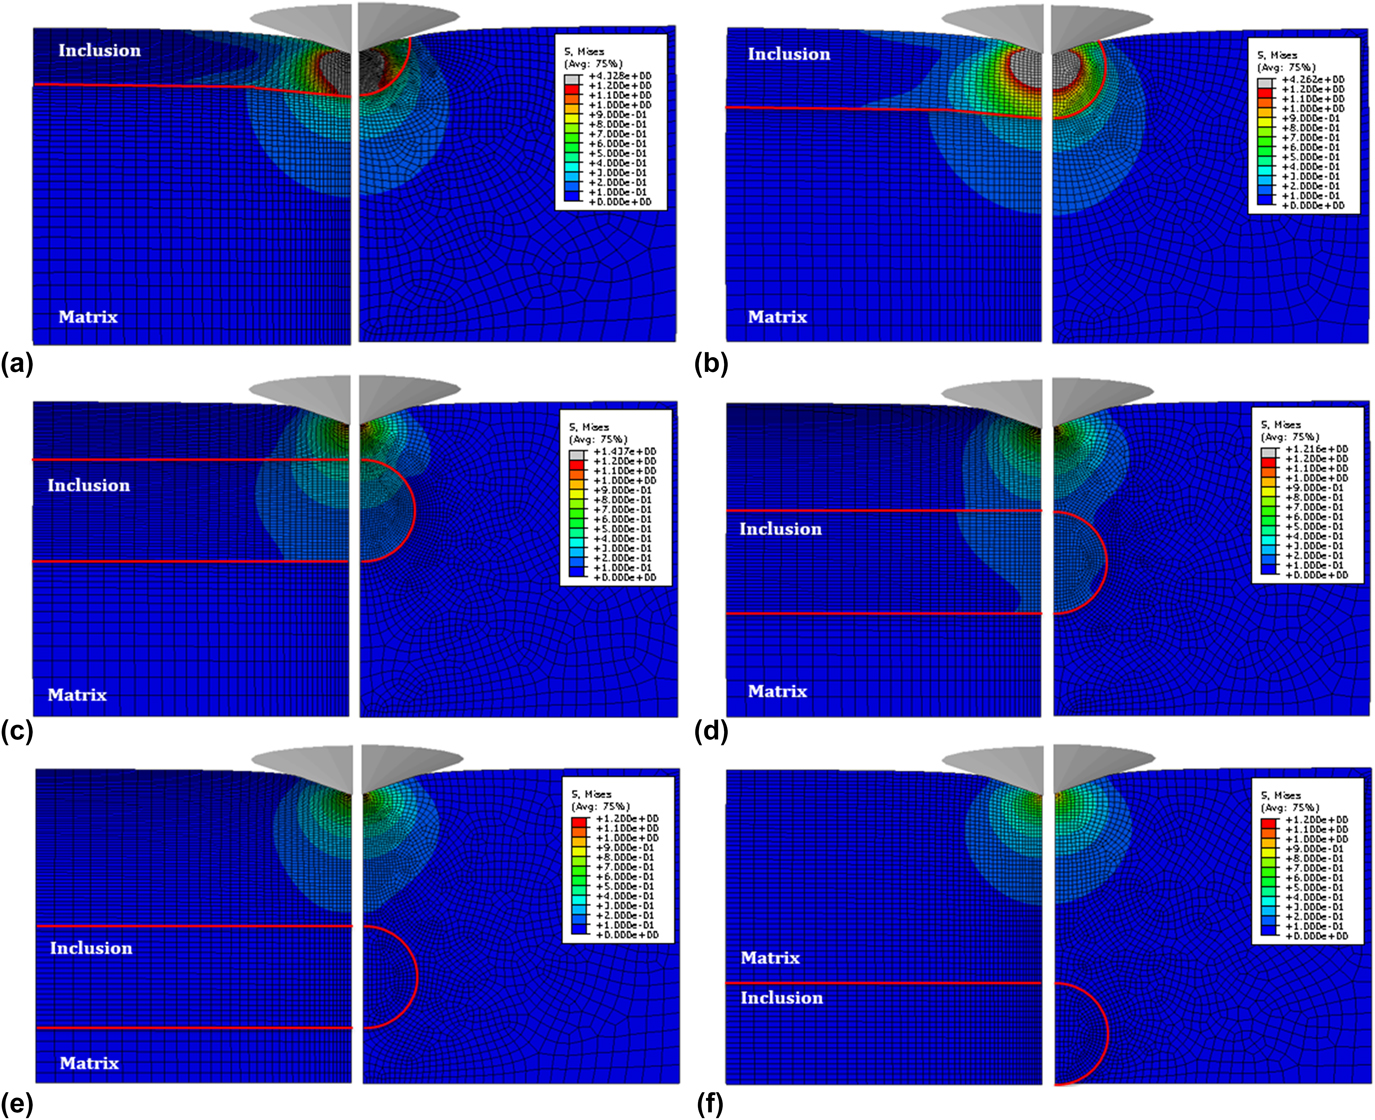
For comparison, stress contours for the horizontal fiber model indented by using the conical indenter are plotted in Fig. 5. The maximum and minimum stress limit was also set to 1.2 MPa and 0 MPa, respectively. Similar to the vertical fiber model, when the indentation is carried out in the region of the inclusion [d/r < 1, Figs. 5(a) and 5(b)], the response is mainly fiber-dominated. Besides, it also indicates that the apparent elastic modulus is highly related to the ratio of V inclusion/V matrix (which is the deforming volume ratio between the inclusion and the matrix involved in the effective stress fieldReference Bull29,Reference G-Berasategui, Bull and Page30 ). For a greater deforming volume ratio of V inclusion/V matrix, a higher apparent elastic modulus will be obtained. When the indentation takes place in the region of the matrix [d/r > 1, Figs. 5(c)–5(f)], the response is mainly matrix-dominated, especially for a lower displacement or a larger d/r ratio. Compared with the stress contours from the vertical fiber model, for the same ratio of d/r [such as Figs. 4(d) and 5(d) for d/r = 3], the horizontal inclusion seems to contribute more to the resulting response than the vertical inclusion. It may due to the fact that stress propagates further along the vertical direction (i.e., the direction of loading) than along the horizontal direction. On the other hand, similar to the 10% rule-of-thumb for estimating the coating properties,Reference Chen and Bull23,Reference Sawa, Akiyama, Shimamoto and Tanaka31,Reference Wang, Liechti, White and Winter32 and also as suggested by Chen and Bull, the size of the deformation zone is related to the maximum displacement.Reference Chen and Bull23,Reference Chen and Bull33 Therefore, in this study, there may also exist a critical distance for the inclusion/matrix system, which relates to the ratio of d/r, indenter geometry, and maximum displacement. That is, when indenting the matrix within a certain displacement range, the influence from the inclusion will be negligible once beyond this critical distance (or critical d/r ratio). In practical application, when the fibers are periodically distributed in the matrix, a greater volume fraction of the fiber leads to more fiber-dominated response, and a smaller volume fraction of the fiber stands for more matrix-dominated response.
von Mises stress contours for the horizontal fiber model from two orthogonal cross sections with a displacement of 0.5 μm, when (a) d/r = 0, (b) d/r = 0.5, (c) d/r = 2, (d) d/r = 3, (e) d/r = 4, and (f) d/r = 5. For standardization, all the figures share the same stress scale.
B. Extraction of the elastic modulus of the inclusion and the matrix
Equations (1)–(3) were adopted to describe the apparent elastic modulus plotted in Fig. 3. Although each curve can be effectively fitted by these empirical equations, they are not able to converge all the data to a master curve. Thus, it does not make much sense to adopt these equations here for nanomechanical response prediction, as all the fitting parameters depend on the ratio of d/r. Equations (1)–(3) work well in the previous work as they take consideration of the elastic mismatch between the inclusion and the matrix.Reference Duan, Bull and Chen19 While, in this study, the variables are the fiber orientation and the indentation location. Hence, as a future study, a more generalized expression should be developed, which considers the variables such as indentation location, fiber orientation, indenter geometry, and even the inclusion geometry.
On the other hand, Eqs. (5) and (6) were adopted to extract the elastic modulus of each individual component (fiber or matrix). By fitting these equations to the curves plotted in Fig. 3, the relevant fitting parameters are shown in Tables SI–SIV. The R 2 value is higher than 0.95 in each case, which shows the good quality of the fitting. For the linear equation, the parameter A reflects the changing trend of the apparent elastic modulus with respect to the displacement. A higher value of A leads to greater increment of the apparent elastic modulus. As listed in Tables SI and SIII, when the ratio of d/r is greater than 1, the value of A is decreasing with the increase of d/r. This indicates that, when indenting the matrix, the influence from the fiber will decrease with the increase of d/r ratio. The parameter C represents the modulus of the indented bulk material, which is the intercept of extrapolating the fitting equation to zero contact depth. In both the vertical and horizontal fiber cases, when indenting the matrix, the value of C from the linear equation will be closer to the exact elastic modulus of the matrix (2 MPa) rather than the value from the polynomial equation. By contrast, when indenting the inclusion, the value of C from the polynomial equation will be closer to the exact elastic modulus of the inclusion (10 MPa) rather than the value from the linear equation. While, when indenting the interface between the inclusion and the matrix [as shown in Fig. 4(b)], both of these two equations are invalid to extract the elastic modulus of either individual component because even when extrapolating the displacement to zero, the influence from both the fiber and the matrix still cannot be ignored. Therefore, it may be suggested that for an inclusion/matrix composite, a linear equation should be used to extract the elastic modulus of the indented material when the ratio of d/r is higher than 1, and a second order polynomial equation should be used when the ratio of d/r is lower than 1. This may due to the fact that with the development of the stress field, the changing trend of the deforming volume ratio of V inclusion/V matrix that starts from the matrix is different from the changing trend of the evolved volume ratio that starts from the inclusion. Thus, different equations are applied to each case depending on the ratio of d/r.
C. Effect of indenter geometry
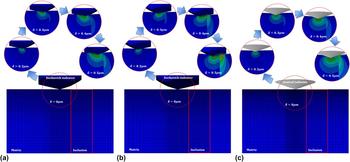
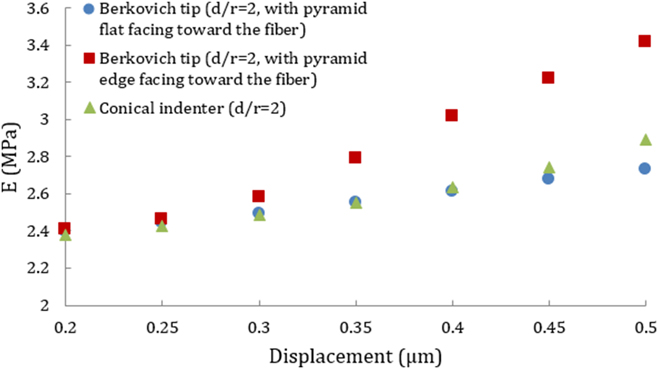
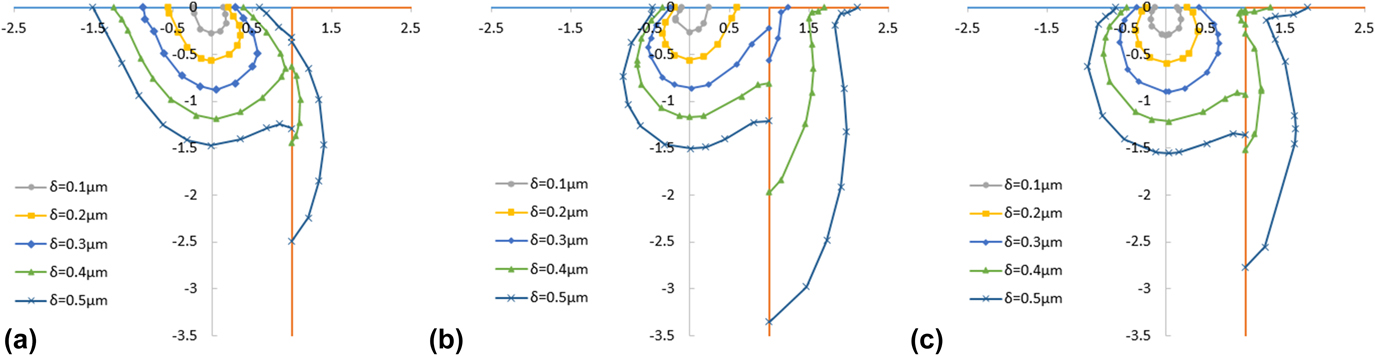
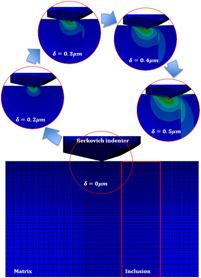
In practice, the Berkovich indenter is usually equivalent to a conical indenter in the FE modeling.Reference Lichinchi, Lenardi, Haupt and Vitali34,Reference Bolshakov, Oliver and Pharr35 However, its nonaxisymmetric geometry actually affects the conclusion drawn from the case of a conical indenter, especially in the case of a nonaxisymmetric model (namely, d/r ≠ 0).Reference Bei, George, Hay and Pharr36–Reference Swaddiwudhipong, Hua, Tho and Liu38 To reveal the effect of the indenter geometry, the vertical fiber model with d/r = 2 were indented by using (i) the Berkovich indenter with the pyramid flat facing toward the fiber, (ii) the Berkovich indenter with the pyramid edge facing toward the fiber, and (iii) the equivalent conical indenter in this study. The stress contours and the extracted composite elastic modulus are shown in Figs. 6 and 7, respectively. It can be seen that in the case of the Berkovich indenter with the edge facing toward the fiber, the indenter will directly press the fiber when the displacement reaches 0.25 μm, which is much earlier than the other two cases. Once the indenter touches the inclusion, the corresponding apparent elastic modulus and the effective deformation zone within the fiber are rapidly increasing. To further investigate the extension of the stress field, the stress development with respect to the displacement was quantified with the 0.2 MPa contour line, which is plotted in Fig. 8. Before the displacement reaches 0.3 μm, there is no clear difference between the stress field areas enclosed by contour lines for those three cases. When the displacement is greater than 0.3 μm, the stress field area for the case of the Berkovich indenter with the edge facing toward the fiber increases much more rapidly than the areas for the other two cases. When the displacement reaches 0.5 μm, the stress field area for the case of the Berkovich indenter with the edge facing toward the fiber is approximately 1.49 times greater than that for the case of the conical indenter, and approximately 1.27 times greater than that for the case of the Berkovich indenter with the flat facing toward the fiber. Therefore, it seems that the nonaxisymmetric geometry of the indenter will actually affect the effective tip angle relative to the fiber. That is, in the case of the Berkovich indenter with the edge facing toward the fiber, the effective tip angle is 77° which is the angle from the pyramid axis to the edge. While in the case of the Berkovich indenter with the pyramid flat facing toward the fiber, the effective tip angle decreases to 65.3°, which is the angle between the axis and the face. In practice, this random effective tip angle (within 65.3–77°) will correspondingly affect the distribution and the development of the effective stress field within the fiber and the matrix. As suggested in the previous discussion, a linear equation was then adopted to extract the elastic modulus of the matrix. While, relatively big deviation (20.14% difference between the extracted value and exact value) was observed in the case of the Berkovich indenter with the edge facing toward the fiber, and acceptable values (with the differences of 0.36 and 8.09%) were obtained in the other two cases. This indicates that, when using Eq. (5) to extract the elastic modulus of the matrix, it will become invalid once the indenter touches the inclusion. Once the indenter touches the fiber, the effective deformation zone will become irregular and the corresponding deforming volume ratio of V inclusion/V matrix will increase rapidly.
Comparison of the von Mises stress contours for the vertical fiber model with d/r = 2, indented by using (a) the Berkovich indenter with the pyramid flat facing toward the fiber, (b) the Berkovich indenter with the pyramid edge facing toward the fiber, and (c) the conical indenter. For standardization, the maximum stress limit was set to 1.2 MPa and the minimum stress limit was set to 0 MPa in all the figures.

Apparent elastic modulus for the vertical fiber model in the case of d/r = 2, indented by different indenters and orientations.

Quantification of 0.2 MPa contour line of von Mises stress contours shown in Fig. 6. That is, the contour lines of the vertical fiber model with d/r = 2, when indented by using (a) the Berkovich indenter with the pyramid flat facing toward the fiber, (b) the Berkovich indenter with the pyramid edge facing toward the fiber, and (c) the conical indenter. The origin of each coordinate system represents the indentation point.

It is noted that the indenter used in this study is relatively blunt (well above 45°), which means that the stress field can be much more disturbed laterally when the indenter senses another material with very different mechanical properties. Therefore, within the range of d/r in this study, the geometry effect between the Berkovich tip and its equivalent conical tip can be significant for the fiber aligned vertically as can be seen in Fig. 8. However, such an effect is expected to be insignificant for the fiber aligned horizontally for the given d/r ratio in this study because the stress field in the vertical direction has negligible difference between the Berkovich tip and its equivalent conical tip. Therefore, within the given conditions in this study, we did not perform further study to examine the indenter geometry effect for the horizontal fiber. Nevertheless, in some extreme cases, e.g., the fiber is very close to the surface, and the indenter geometry effect can also become evident, but it is beyond the scope of this study.
IV. CONCLUSIONS
FE simulations were performed to investigate the elastic response of the fiber reinforced composite with different indentation locations and fiber orientations indented by using a conical indenter and a Berkovich indenter. The FE results have revealed that there exists a critical ratio of d/r for a given displacement. Beyond this ratio, the indentation response will be negligibly affected by the other component. In other words, for a given ratio of d/r, the maximum displacement should not exceed the corresponding critical displacement to avoid the influence from the other component. It reveals that for a periodically distributed fiber-reinforced composite, the mechanical response of the composite will transit from matrix-dominated to fiber-dominated with the increase of the fiber volume fraction within the indentation-affected zone. That is, higher fiber volume fraction indicates more fiber-dominated response, and vice versa.
Empirical equations, which worked well when the nanoindenter closely aligns with the center of the symmetric particle (or inclusion) embedded in the matrix, have been examined. However, these equations are incapable to describe the apparent elastic modulus of the inclusion/matrix composite with various d/r ratios when the indenter is randomly located. Similar to the conception of ISO 14577, where a linear equation was suggested to extract the mechanical properties of the coating, simple equations like linear equation and second-order polynomial equation were adopted here to enable the extraction of the elastic modulus of each individual component. The work has revealed that, based on the extension of the stress field, the polynomial equation will be more effective to extract the elastic modulus of the fiber when the indentation takes place on the fiber. However, when the indentation stress field extends from the matrix, before the indenter directly touches the fiber, the linear equation will be more suitable to extract the elastic modulus of the matrix. Once the indenter touches the fiber, the linear equation will become significantly violated due to the extension of irregular effective deformation zone within the fiber and the matrix.
The effect of the indenter geometry has been investigated with a nonaxisymmetric indenter (e.g., Berkovich indenter) and a conical indenter. It has revealed that the orientation of the indenter might actually change the effective tip angle relative to the fiber, and correspondingly affect the extension of the effective stress field within the fiber and the matrix, when the fiber is aligned vertically. Therefore, when a nonaxisymmetric indenter was adopted, careful attention should be paid to the application of these analytical equations.
Supplementary Material
To view supplementary material for this article, please visit https://doi.org/10.1557/jmr.2018.243.
ACKNOWLEDGMENT
J. Chen is acknowledging funding from the Engineering and Physical Sciences Research Council (EP/K039083/1).