Introduction
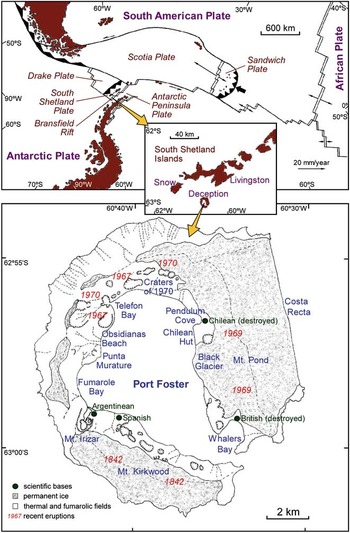
Deception Island volcano is situated in the South Shetland Islands archipelago. The regional tectonic framework is complex, in which several major tectonic units come together. These include two main plates, the South-American Plate and the Antarctic Plate, as well as the Scotia, Drake and South Shetland Islands microplates (Fig. 1). The South Shetland Trench is undergoing a very slow slab roll-back subduction process (Ibáñez et al. Reference Ibáñez, Morales, Alguacil, Almendros, Ortiz and Del Pezzo1997, Maurice et al. Reference Maurice, Wiens, Shore, Vera and Dorman2003). This process led to the South Shetland Islands microplate breaking off and separating from the Antarctic Peninsula about two million years ago, to create what is known today as the Bransfield Rift. It is made up of three active extensional basins, which trend north-east and which are the sites of volcanism and normal faulting. The axis of the central basin is characterized by a series of undersea volcanoes between Deception Island and Bridgeman Island, many of which have been active recently (Gracia et al. Reference Gracia, Canals, Farran, Prieto and Sorribas1996).
Upper: tectonic map of the Scotia region. The inset shows a map of the South Shetland Islands region. Lower: map of Deception Island, showing the main volcanic features.

The seismic activity in the Bransfield Strait has characteristics of rift extension and volcanism. Practically all the earthquakes in the region are shallow, taking place at depths of < 40 km (Pelayo & Wiens Reference Pelayo and Wiens1989). A few deeper earthquakes are consistent with the subduction of the Drake Plate (Ibáñez et al. Reference Ibáñez, Morales, Alguacil, Almendros, Ortiz and Del Pezzo1997). Many of the shallow earthquakes tend to cluster near volcanoes, which suggests that they are probably of volcanic or volcano-tectonic origin (Maurice et al. Reference Maurice, Wiens, Shore, Vera and Dorman2003).
Deception Island is situated on the extension axis of the central Bransfield basin (Fig. 1) and is probably one of the most active Antarctic volcanoes today with known eruptions in 1842, 1912 and 1917, and more recently in 1967, 1969 and 1970 (Smellie et al. Reference Smellie, López-Martínez, Thomson and Thomson2002). It is shaped like a horseshoe with an inner flooded bay. The area above water is c. 15 km in diameter. Several origins have been proposed for this morphology. One is that it is a caldera produced by catastrophic collapse, which was formed around a ring fracture after one or more large eruptions of andesitic magma (Smellie et al. Reference Smellie, López-Martínez, Thomson and Thomson2002). Other suggestions include incremental growth in response to a series of moderate-sized eruptions (Walker Reference Walker1984) and a tectonic-driven model, in which the caldera is a tectonic depression caused by extensive movements along normal faults that follow the trend of the extensive regional faults (Rey et al. Reference Rey, Somoza and Martínez-Frías1995, Martí et al. Reference Martí, Vila and Rey1996).
Leaving aside the different hypotheses regarding the formation of the caldera, the various seismic studies based on reflection, and observations in the field have clearly demonstrated that there are three large fault systems crossing the island (Rey et al. Reference Rey, Somoza and Martínez-Frías1995, Martí et al. Reference Martí, Vila and Rey1996). The first fault system runs from Punta Murature to Telefon Bay and coincides with the NE–SW direction of the Bransfield Strait. These alignments are related to the eruptions of 1967 and 1970. In addition, seismic tomography has revealed a velocity contrast between Deception Island and the basement of the South Shetland Islands, which runs in a NE–SW direction (Zandomeneghi et al. Reference Zandomeneghi, Barclay, Almendros, Ibáñez, Wilcock and Ben-Zvi2009). The second fault system, which trends approximately east–west, coincides with the alignments of Mount Kirkwood, eruption of 1842 and alignments of underwater cones inside the caldera (Fig. 1). The third system has NNW–SSE orientations, which include Costa Recta, the Mount Pond system, sub-parallel faults along the Fumarole Bay area and the Black Glacier, and the eruptive fissures of 1969. In support of the model that the island is basically driven by these three fault systems, Rey et al. (Reference Rey, Somoza and Martínez-Frías1995) and Martí et al. (Reference Martí, Vila and Rey1996) noted the absence of ring-shaped circular fault sections and radial dykes inside the caldera. These authors based their ideas on the fact that most of the recent eruptions have followed previously described alignments and have taken place outside the hypothetical ring fault. One implication of this model is that the caldera is supported by much less extensive, discontinuous reservoirs of magma, quite the opposite to the caldera collapse hypothesis. In more recent research, Smellie et al. (Reference Smellie, López-Martínez, Thomson and Thomson2002) suggested that the caldera did collapse but took into account pre-existing faults, and suggested that the caldera was formed by a mixture of volcanism and tectonics, and not only as a passive response to regional tectonics.
Apart from the three most important fault systems, various authors have noted the presence of other fault systems, using different techniques such as geological observations on the surface, geophysical data, bathymetric information, morphological analysis of the digital elevation model, morphological alignments produced by recent volcanic activity etc. (Maestro et al. Reference Maestro, Somoza, Rey, Martínez-Frías and López-Martínez2007, Barclay et al. Reference Barclay, Wilcock and Ibáñez2009). These studies revealed the presence of numerous faults in many orientations.
The eruptions on Deception Island, for which we have a historical record, were relatively small (e.g. < 0.1 km3 for each of the last three eruptions) and occurred near the coast of the inner bay. There are references to at least six eruptions since the island was visited for the first time about 160 years ago. The first of these eruptions took place in 1842, when sailors on whaling ships told of a Strombolian wall of fire below Mount Kirkwood in the south-west part of the island (Roobol Reference Roobol1973). The ice record in James Ross Island suggests that there was a large eruption in the 17th century (Aristarain & Delmas Reference Aristarain and Delmas1998), perhaps the biggest eruption in the last 350 years. Also thanks to the ice record (Orheim Reference Orheim1972) a phreatomagmatic eruption was identified in Lake Kroner, near Whalers Bay between 1912 and 1917. In December 1967, two eruptions took place simultaneously at sites that were c. 2 km apart. One of these was the submarine eruption that created a new island in Telefon Bay, while the other took place inland between Telefon Bay and Pendulum Cove (Fig. 1). The eruptive products were similar in both eruptions (ash, steam and volcanic bombs). In February 1969 there was a fissural eruption in the ice on the eastern slopes to the west of Mount Pond, accompanied by pyroclastic flow emissions. The last know eruption happened in August 1970, forming a large chain of cones and altering the shape of the coastline. Roobol (Reference Roobol1973) made a comparative study between a map made by Lieutenant E.N. Kendall in 1829, and later aerial photographs and cartographic maps. Based on the testimonies of scientific and whaling expeditions he claimed that there may have been other unverified eruptive processes in 1839 in Pendulum Cove, in 1871 and 1909 in Lake Kroner, in 1927 in the south-west of the island and in 1956 in the vicinity of Mount Pond.
After the most recent eruptions, zones of elevated geothermal activity were formed around the Port Foster bay area. They are characterized by temperatures in the range 20–100°C and gas emissions with varying chemical composition (Caselli et al. Reference Caselli, Badi, Bonatto, Bengoa, Agusto, Bidone and Ibáñez2007). The most important area for gas emissions is Fumarole Bay, which has emissions that are rich in hydrogen sulphide and carbon dioxide (Ortiz et al. Reference Ortiz, García, Aparicio, Blanco, Felpeto, Del Rey, Villegas, Ibáñez, Morales, Del Pezzo, Olmedillas, Atiz, Vila, Ramos, Viramonte, Risso and Caselli1997). Caselli et al. (Reference Caselli, Santos-Afonso and Agusto2004, Reference Caselli, Badi, Bonatto, Bengoa, Agusto, Bidone and Ibáñez2007) revealed an increase in the flow of SO2 in the Fumarole Bay area after the 1999 seismic crisis (Ibáñez et al. Reference Ibáñez, Carmona, Almendros, Saccorotti, Del Pezzo, Abril and Ortiz2003b), and the 2003–04 survey, in which there was great seismic activity. This increase appears to be related to the intrusion of dykes into superficial layers and deposits of native sulphur and iron sulphide in thin layers in the fumarole systems in the bay. These two cases show the direct relationship between changes in geochemical activity and an increase in seismic activity.
Studies of the deformation of the island suggest a change in the relative movement of the island after the 1999 crisis. It changed from extension and elevation over the whole island to a compressive process with subsidence in the north and north-west areas (Berrocoso et al. Reference Berrocoso, Fernández-Ros, Ramírez, Salamanca, Torrecillas, Pérez-Peña, Páez, García-García, Jiménez-Teja, García-García, Soto, Gárate, Martín-Dávila, Sánchez-Arzola, De Gil, Fernández-Prada and Jigena2008). These authors also found that the centre of the superficial deformation that occurred after the 1999 crisis was located inside the bay near ‘Obsidianas beach’ (Fig. 1).
Different papers on the internal structure of the superficial layers of Deception Island have revealed large heterogeneities. Saccorotti et al. (Reference Saccorotti, Almendros, Carmona, Ibáñez and Del Pezzo2001) found differences in seismic velocities between the inside and the outside of the caldera. The inner part of the caldera was much slower than the outer part. Martínez-Arévalo et al. (Reference Martínez-Arévalo, Bianco, Ibáñez and Del Pezzo2003) showed a highly fractured medium in the upper few kilometres of the crust in the area inside the bay, with the presence of fluids and gases. These authors demonstrated heterogeneities trending in particular directions, filled with fluids that strongly attenuate seismic signals. Zandomeneghi et al. (Reference Zandomeneghi, Barclay, Almendros, Ibáñez, Wilcock and Ben-Zvi2009) obtained a high-resolution seismic image of Deception Island using active source tomography, and suggested the presence of a shallow magma chamber under Port Foster. Luzón et al. (Reference Luzón, Almendros and García-Jerez2011) also noticed differences in velocity for different parts of the island, indicating the presence of hydrothermal activity and compact pre-caldera materials. García-Yeguas et al. (Reference García-Yeguas, Almendros, Abella and Ibáñez2011) highlighted anomalies in seismic wave propagation across different areas inside the bay.
The seismo-volcanic activity in Deception Island is very diverse as it is for most of the world's volcanoes. This is a combination of its geographical situation within the Bransfield regional tectonic complex, the presence of permanent glaciers, aquifers, fumarole systems and the fact that it contains a shallow magmatic chamber. In this paper we analyse the seismic activity from the recent 1999 seismo-volcanic crisis until the 2010–11 survey. The objective is to study the evolution of the seismo-volcanic activity and compare it to previous analyses to reach a better understanding of Deception Island volcano.
Volcanic seismicity
Volcanic seismic signals provide us with information about some of the parameters of the source (position, seismic energy quantification, dynamics, geometry etc.) and the characteristics of the medium (velocity structure, attenuation etc.). Almost all eruptions are accompanied by some form of seismic anomaly. Volcano seismology is considered one of the most important geophysical tools for monitoring volcanic activity from the point of view of human safety and for analysing the current state of the volcano from a scientific perspective.
Tectonic earthquakes related to the dynamic processes of the volcano are known as volcano-tectonic (VT) earthquakes or “high-frequency events”. One of the key factors that enable us to distinguish them from regional earthquakes is that their hypocentral area must be in the volcanic edifice. Volcano-tectonic events are used for studying local fractures in the area of the volcano (McNutt Reference McNutt2005). These events are normally of low magnitude due largely to the effects of small fractures found in volcanic areas, as opposed to regional fracture systems which host more powerful earthquakes. Volcano-tectonic events have a characteristic waveform represented by the arrival of P and S-wave packets followed by a slow exponential decrease (the coda waves). Durations range from a few seconds for the smallest earthquakes to a few minutes for the largest ones, depending on the magnitude of the earthquake. There is broad spectral content reaching frequencies of over 30 Hz. This kind of signal may appear separately or in the form of seismic swarms, generally interpreted as a result of the destabilization of the fault system in the volcanic area (Ibáñez et al. Reference Ibáñez, Almendros, Carmona, Martínez-Arévalo and Abril2003a). In spatial terms, VT earthquakes normally appear at a wide range of depths, from tens of kilometres up to the surface of the volcanic edifice. The spatial distribution may be concentrated around a possible volcanic conduit, but can also be distributed throughout the whole volcanic system. In some volcanoes, the presence of VT seismic swarms is generally associated with the reactivation of the volcano, but this does not imply that the volcano will erupt. In other volcanoes, eruptions take place without any significant increase in this kind of seismic event (Benoit & McNutt Reference Benoit and McNutt1996).
The second type of event is known as long-period seismicity (Chouet Reference Chouet2003). It does not originate in tectonic geodynamics, but is rather the product of processes directly related to the fluid dynamics of the volcano itself. This group includes long-period (LP) or low-frequency events, tremor episodes (TR) and hybrid events (HB).
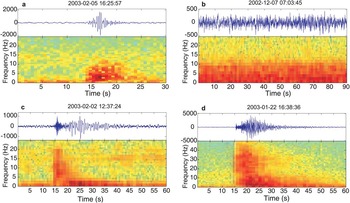
The LP events last for between just a few seconds and one minute. They usually have an emergent onset, which means that it is very difficult to define the exact moment at which the signal begins, making it difficult to locate the source. They do not show defined arrivals of any phase, either P or S, and they have a spindle-shaped envelope (Fig. 2). The spectral content of this signal may vary among volcanoes, and sometimes even within the same volcanic system, although as a general rule LP events normally have a very monochromatic spectrum with one or various peaks below 5 Hz. This is the most characteristic signal of volcanic environments together with the tremor. Again, LP events may occur in isolation, but most commonly happen in the form of swarms. As with VT earthquakes, the presence of swarms is not always a clear indicator of a possible eruption, although in many volcanoes there is a close relationship (Chouet Reference Chouet2003). Various authors have produced theoretical models for this kind of activity. One of the most frequently used is the fluid-driven crack model (Chouet Reference Chouet2003). This model is based on fractures or cracks being filled with fluids which at first are in equilibrium. It proposes that pressure builds up in these cracks and causes a perturbation. The waveform and wave frequency depend on the geometry of the resonant cavity, the excitation mechanism and the properties of the fluids (Kumagai & Chouet Reference Kumagai and Chouet2000).
Examples of vertical-component velocity seismograms and array-averaged spectrograms recorded at Deception Island for a. a long-period (LP) event with frequency content centred at 2.5 Hz, b. a tremor episode recorded at the fumarole array, c. a hybrid event, and d. a volcano-tectonic (VT) earthquake (note the different range of the frequency axis).

The TR are monochromatic signals similar to the LP events, but of long duration, from minutes to hours and even days (Konstantinou & Schlindwein Reference Konstantinou and Schlindwein2002). They normally have spectra with one dominant peak and other subdominant ones. Some researchers have characterized the wavefield of the tremor as a complex superposition of surface waves. It has also been shown that the LP events and the tremor have very similar patterns, including the same source area, spectral content and wavenumber (Almendros et al. Reference Almendros, Ibáñez, Alguacil, Del Pezzo and Ortiz1997, Ibáñez et al. Reference Ibáñez, Del Pezzo, Almendros, La Rocca, Alguacil, Ortiz and García2000). The interpretation is that LP events and TR share the same source although the source duration is short for LP events and long for TR.
The LP seismicity also includes signals known as hybrid events. These events are related to two mechanisms: a double-couple mechanism such as VT earthquakes and another generated by fluid resonance. They are characterized by initial high-frequency arrivals similar to those of VT earthquakes, in which it is possible to identify P- and S-phases, and later arrivals of low-frequency monochromatic phases similar to LP events. The origin of the low frequencies is attributed to the same mechanisms proposed for LP events, the difference being that in hybrids the fluid resonance is triggered by the process of rupture of the faults involved (Lahr et al. Reference Lahr, Chouet, Stephens, Power and Page1994).
Seismicity of Deception Island before 1999
The first studies of the Deception Island's seismicity date back to the 1950s, when an analogue station was installed near the Argentinean base. These studies were interrupted by the eruptions at the end of the 1960s during which the island had to be evacuated. However, these eruptions were accompanied by numerous VT earthquakes (some of which could be felt), LP events, and volcanic tremor. After the last eruption in 1970, no further seismic records were obtained until 1986 when seismic monitoring recommenced. Different types of seismic instrumentation were used: from 1986–88 the instrumentation consisted of short-period analogue vertical stations with recording on thermal paper. A short-period vertical station was installed near the Argentinean base at this time (Fig. 3). Between 1989 and 1991 a seismic network made up of five short-period stations was installed, some with radio telemetry. Vila et al. (Reference Vila, Martí, Ortiz, García and Correig1992, Reference Vila, Correig and Martí1995) studied the seismic activity over this period and produced a map with epicentres of seismic activity in Deception Island. The energy of the seismo-volcanic signals registered between 1986 and 1991 was low, with low magnitude VT seismic events.
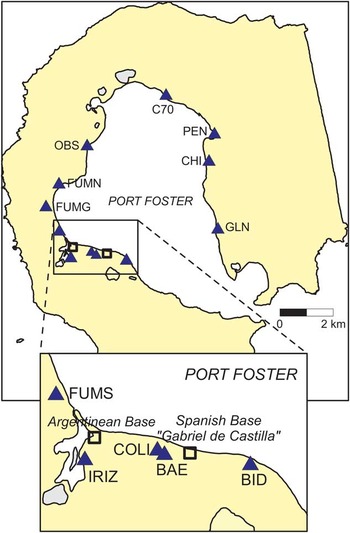
Map of Deception Island showing the locations where seismic instruments have been installed during the 1999–2011 surveys (triangles). See Table I for details. The squares indicate the positions of the Spanish and Argentinean bases.

This low seismic activity changed in January–February 1992 when activity increased (Ortiz et al. Reference Ortiz, García, Aparicio, Blanco, Felpeto, Del Rey, Villegas, Ibáñez, Morales, Del Pezzo, Olmedillas, Atiz, Vila, Ramos, Viramonte, Risso and Caselli1997). A precise epicentral map could not be made as there was only one three-component station installed near the Argentinean base, but all the evidence suggests that the seismic activity took place below Port Foster. The magnetic anomalies, the changes in the emissions from the fumaroles, together with episodes in which there were irregularities in the gravimetric observations suggest that there was an injection of magma without it reaching the surface (Ortiz et al. Reference Ortiz, García, Aparicio, Blanco, Felpeto, Del Rey, Villegas, Ibáñez, Morales, Del Pezzo, Olmedillas, Atiz, Vila, Ramos, Viramonte, Risso and Caselli1997). A total of 776 VT events were counted. Four of them, with magnitudes between 2.1 and 3.4 were felt. After the activity in 1992, new stations were deployed in the following years (1992–93 and 1993–94) between the Spanish and Argentinean bases. This control was performed using analogue and digital short-period seismic stations with 12 bits of dynamic range (Ortiz et al. Reference Ortiz, García, Aparicio, Blanco, Felpeto, Del Rey, Villegas, Ibáñez, Morales, Del Pezzo, Olmedillas, Atiz, Vila, Ramos, Viramonte, Risso and Caselli1997). The level of activity fell considerably until it returned to background levels observed prior to the crisis (Ibáñez et al. Reference Ibáñez, Almendros, Carmona, Martínez-Arévalo and Abril2003a).
Between 1994 and 1999 dense, small-aperture seismic arrays (or seismic antennas) were deployed in order to be able to study purely volcanic signals (tremor and LP) in greater detail and identify and locate them. They used a 16 bit acquisition system and 4.5 Hz Mark Products L28 sensors with extended response at 1 Hz. They were installed near the Gabriel de Castilla Spanish base (Fig. 3) with different configurations. We used 12–18 channels and array apertures in the range 300–500 m. Almendros et al. (Reference Almendros, Ibáñez, Alguacil, Del Pezzo and Ortiz1997, Reference Almendros, Ibáñez, Alguacil and Del Pezzo1999) and Ibáñez et al. (Reference Ibáñez, Del Pezzo, Almendros, La Rocca, Alguacil, Ortiz and García2000, Reference Ibáñez, Almendros, Carmona, Martínez-Arévalo and Abril2003a) described the configuration, techniques and results of the application of seismic antennas on Deception Island. Seismic activity during this period was irregular (Ibáñez et al. Reference Ibáñez, Almendros, Carmona, Martínez-Arévalo and Abril2003a). For example, we recorded 600 LP events during the 1995–96 survey, decreasing considerably to 184 LP events in the 1996–97 survey. Ibáñez et al. (Reference Ibáñez, Del Pezzo, Almendros, La Rocca, Alguacil, Ortiz and García2000) located VT earthquakes during the period 1994–98 along a north–south fracture system south of the Spanish base. These authors also studied LP events and TR obtaining an area of occurrence of these events forming a NE–SW alignment between the Argentinean and Spanish bases.
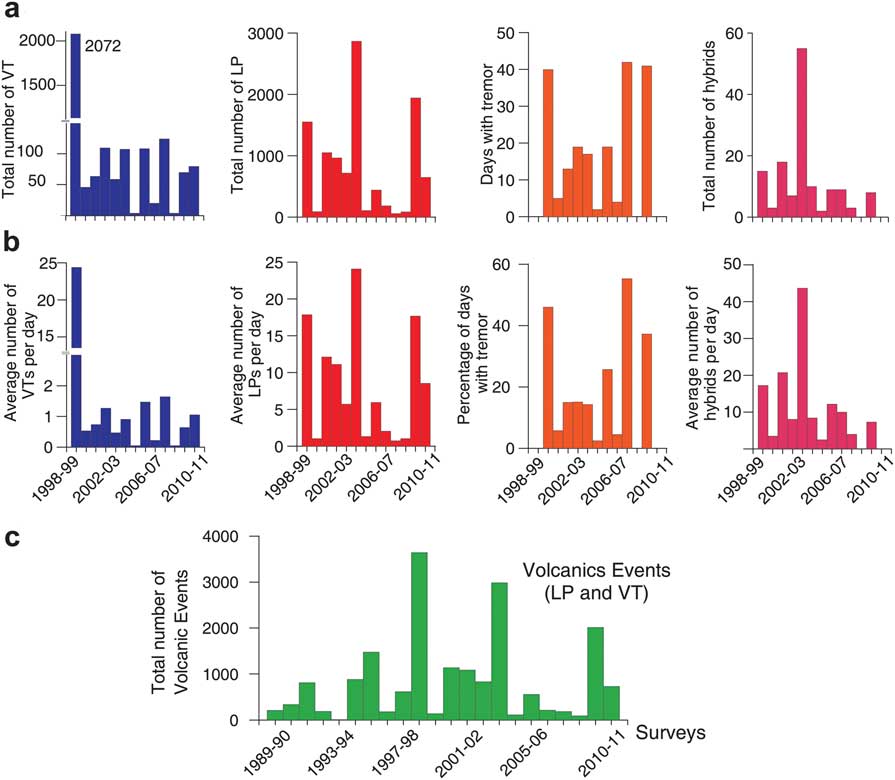
During the 1998–99 survey, there was a very noticeable increase in activity. From the beginning of January to the end of February 1999, the seismic antennas recorded a total of 3643 events of which 2072 were VT earthquakes, 1556 were LP events and 15 were HB events (Ibáñez et al. Reference Ibáñez, Almendros, Carmona, Martínez-Arévalo and Abril2003a, Reference Ibáñez, Carmona, Almendros, Saccorotti, Del Pezzo, Abril and Ortiz2003b). There was also a continuous TR with variable amplitude that reached a maximum reduced displacement of 5 cm2. The moment magnitude of these earthquakes ranged between -0.8 and 3.4 (Ibáñez et al. Reference Ibáñez, Carmona, Almendros, Saccorotti, Del Pezzo, Abril and Ortiz2003b). The two largest earthquakes in the series, with magnitudes of 2.8 and 3.4, occurred on 11 and 20 January 1999 respectively and were felt by personnel from the Gabriel de Castilla base. The VT earthquakes were located using array techniques to estimate the apparent velocity of the first P-wave arrivals. Later the S-P differences were estimated visually and a ray tracing technique was used with a velocity model obtained by combining the findings of previous authors (Ibáñez et al. Reference Ibáñez, Del Pezzo, Almendros, La Rocca, Alguacil, Ortiz and García2000, Saccorotti et al. Reference Saccorotti, Almendros, Carmona, Ibáñez and Del Pezzo2001). In total 863 earthquakes were located. Two frequency bands were used for the analysis of the LP events and the volcanic tremor episodes, obtaining different apparent slownesses and azimuths than those obtained for the VT. These results coincide with previous research in different surveys (Ibáñez et al. Reference Ibáñez, Del Pezzo, Almendros, La Rocca, Alguacil, Ortiz and García2000) and suggest that the LP activity was of hydrothermal origin and was unrelated to the VT series. Ibáñez et al. (Reference Ibáñez, Almendros, Carmona, Martínez-Arévalo and Abril2003a) also analysed nine hybrid events, for which results similar to those for VT events were obtained. This indicated the presence of fluids in the area in which the VT events occurred. The location shows that the vast majority of VT events occurred near the seismic antenna at depths of around 2 km, although this may be an apparent effect due to their low magnitudes. Two possible alignments can be observed, one running N45°E, with focal depths of between 1 and 4 km and a second more dispersed alignment which extends N80°E. In subsequent research using precise location techniques with seismic antennas (Almendros et al. Reference Almendros, Carmona and Ibáñez2004) some of the rupture planes responsible for the VT events were found (Carmona et al. Reference Carmona, Almendros, Peña and Ibáñez2010). The strikes for most of these planes trended NW–SE while a smaller number trended NE–SW. These strikes coincide with the fracture directions mentioned above from other research done on the island (Rey et al. Reference Rey, Somoza and Martínez-Frías1995, Martí et al. Reference Martí, Vila and Rey1996). The origin of the VT crisis was probably due to a magmatic intrusion that did not reach the surface (Ibáñez et al. 2003). However, the geometry and position of these planes show that the 1999 series was influenced by regional tectonics (Carmona et al. Reference Carmona, Almendros, Peña and Ibáñez2010).
Seismicity of Deception Island during the 1999–2011 period
Instruments
Since 1998 a range of seismic instruments have been used. Technological advances have improved communications and data transmission, which are some of the most important improvements in seismic monitoring. There has also been considerable progress in acquisition systems with greater resolution in the dynamic range of A/D converters.
The use of seismometers has changed considerably over this period. During the first phase of seismic monitoring on Deception Island (end of the 1980s to end of the 1990s), short-period sensors were used, most of which were 1 Hz sensors. The advantages of stations with this kind of sensor is that they are cheap and can be installed in the field quickly and obtain high quality data, which explains their continued use especially for seismic arrays. The short-period sensors used were mainly 4.5 Hz Mark Products L28 sensors with an electronically extended response at 1 Hz and Mark Products L4C sensors with a natural frequency of 1 Hz.
The installation of broadband sensors began in 2000. The installation of this kind of sensor is more complicated due to its sensitivity to changes in temperature, levelling etc. The range of frequencies is broader than for short-period sensors, which enables an adequate recording of very low frequency signals such as teleseisms or volcanic very-long-period signals. From the 2000–01 survey to the 2007–08 survey, we mainly used short-period sensors together with a broadband sensor. In 2008 a large number of broadband stations began to be installed together with some short-period sensors for the autonomous stations (Table I). In addition, in January 2008 an Eentec SP400 permanent broadband (16 s) station with an Eentec DR400 data logger of 24 bits was installed. It has been recording continuously from 2008–11. This is the first time that seismic data have been recorded during the winter on Deception Island.
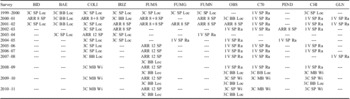
Instruments and locations used during the 1999–2011 surveys.
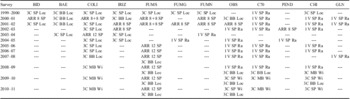
Station: 3C = three-component station, 1 V = vertical-component station, ARR 12 = seismic array with 12 channels.
Sensor: SP = short-period, MB = medium band, BB = broad band.
Data transmission: Loc = local PC, Ra = radio telemetry, Wi = WiFi transmission.
The most commonly used broadband sensors before the 2003–04 survey were the Guralp CMG-40 T, with a sampling rate of 100 sps (samples per second). From 2008–09 to 2010–11 we used Eentec SP400 three-component electrolytic sensors with DR4000 data loggers, with local record on a hard disc at 100 sps. We also used what we call medium-band sensors (Table I), which have a frequency somewhere between the broadband and the short-period sensors. These are 1-second Lennartz sensors with three components with an extended response at 5 sec. Data loggers were 24 bit SARA SR04 acquisition systems. They worked with SEISLOG software (Utheim et al. Reference Utheim, Havskov and Natvik2001) in a PC with embedded Linux, at a sampling rate of 100 sps.
There have been three important phases in the acquisition and transmission of data. Up until 2000–01, data was recorded locally on field computers. Following this survey, we installed short-period stations with telemetric transmission via radio. This was a significant step forward in the monitoring of the volcano. The data was received in real time from three key sites on the island and from the autonomous station near the Spanish base (Fig. 3). The telemetry system consisted of a radio-frequency transmitter with a directional antenna which sent the sensor signal to the base, where it was received and recorded digitally using a de-modulator and A/D converter. The third phase began with the 2008–09 survey with a test of data transmission by WiFi, which improved the signal considerably. In the next survey, the radio telemetry was replaced by WiFi transmission and by 2009–10 all data was transmitted in this way. With this new set-up the stations transmitted in real time using the SEISCOMP (Seismological Communication Processor by GFZ Potsdam) system, thus improving the quality of the data and the monitoring of volcanic activity on the island.
Seismic antennas have been installed on the island in most surveys since 1994. Nearly the same sites have been used each year, as happened with the network stations, so ensuring continuity in the acquisition of data (Table I). The site used most regularly was to the south of Fumarole Bay (Fig. 1). Arrays offer various advantages compared to network. They can be used as just another station in the seismic network or they can be used independently for locating low magnitude VT events and above all for estimating the azimuths and apparent velocities of the long-period seismicity.
From the 1999–2000 survey to the 2002–03 survey, the acquisition systems used for the seismic arrays were 16 bit systems with sampling of 200 sps and trigger-recording (Havskov & Alguacil Reference Havskov and Alguacil2004). During the 2003–04 survey an acquisition system was created that was designed specifically for the seismic antennas with a 24 bit A/D converter, sampling of 100 sps and most important of all, continuous recording. The continuous recording of seismic activity at all the stations is an important tool for establishing reliable protocols for volcanic monitoring. It also improves the study of volcanic tremor episodes and above all of low energy seismic signals. The number of channels in each array varied depending on the acquisition system from eight channels for the 16 bit arrays to 12 channels for the 24 bit systems (Table I).
It has not always been possible to install the seismic stations in exactly the same places each year because of the different kinds of instrumentation used and the specific logistics of their installation (Fig. 3). However, ever since the first seismic stations were installed two areas have always been monitored continuously in all surveys: the first near the Gabriel de Castilla Spanish base (see stations ‘COLI’ and ‘BAE’ in Fig. 3) and the second to the south of Fumarole Bay (see station ‘FUMS’ in Fig. 3). These two sites have been used to compare the seismic activity from one year to the next. The areas known as ‘Obsidianas beach’, ‘Craters of 1970’, and ‘Chilean Hut’ have also been monitored in practically all the surveys (Fig. 1).
The stations were installed each year for different periods depending on when the Gabriel de Castilla Spanish base was opened. This was always during the summer, beginning in late November or early December and ending before March.
Seismicity
Seismic activity on the island can essentially be grouped into four types of event: VT earthquakes, LP events, volcanic tremor, and hybrid events (Fig. 2).
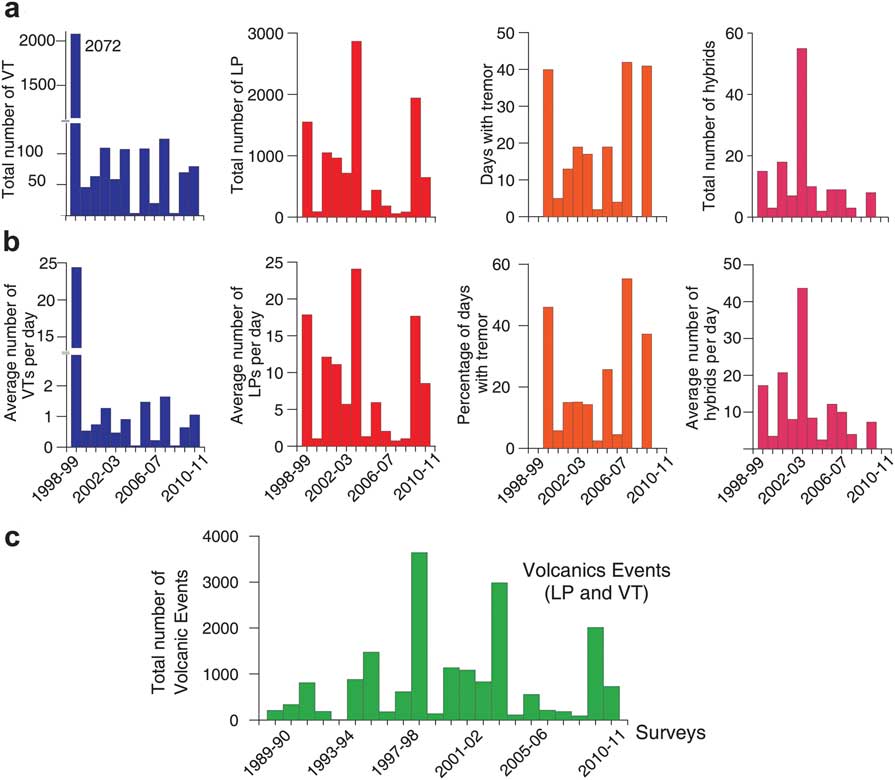
We have analysed the seismic activity in each survey since the 1999 crisis, from the perspective of both time and space. Figure 4 shows the histograms of volcanic events since the 1989–90 survey, and the LP events and VT earthquakes from the 1998–99 survey to the 2010–11 survey. The first thing to be observed is the predominance of LP events. There were more LP events than VT events every year, except in the crises of 1992 and 1999. If we observe the total number of volcanic events since the crisis of 1999, we can see that the years in which there were peaks of activity were followed by four or five surveys with much lower activity levels. Taking into account all data since 1989 (Fig. 4), there seems to be a recurrence period of three to six years in the LP activity. This period was shorter (about three years) before 1999, but apparently is longer now.
a. Histograms of the total number of events recorded in the Gabriel de Castilla Station area in the period 1998–2010. We show the number of volcano-tectonic (VT) earthquakes, long-period (LP) events and hybrids. For tremor we show the number of days with significant tremor episodes. b. Same as a., normalized by the number of days of each survey. c. Histogram of the total number of volcanic events in the same area from 1989–2011.
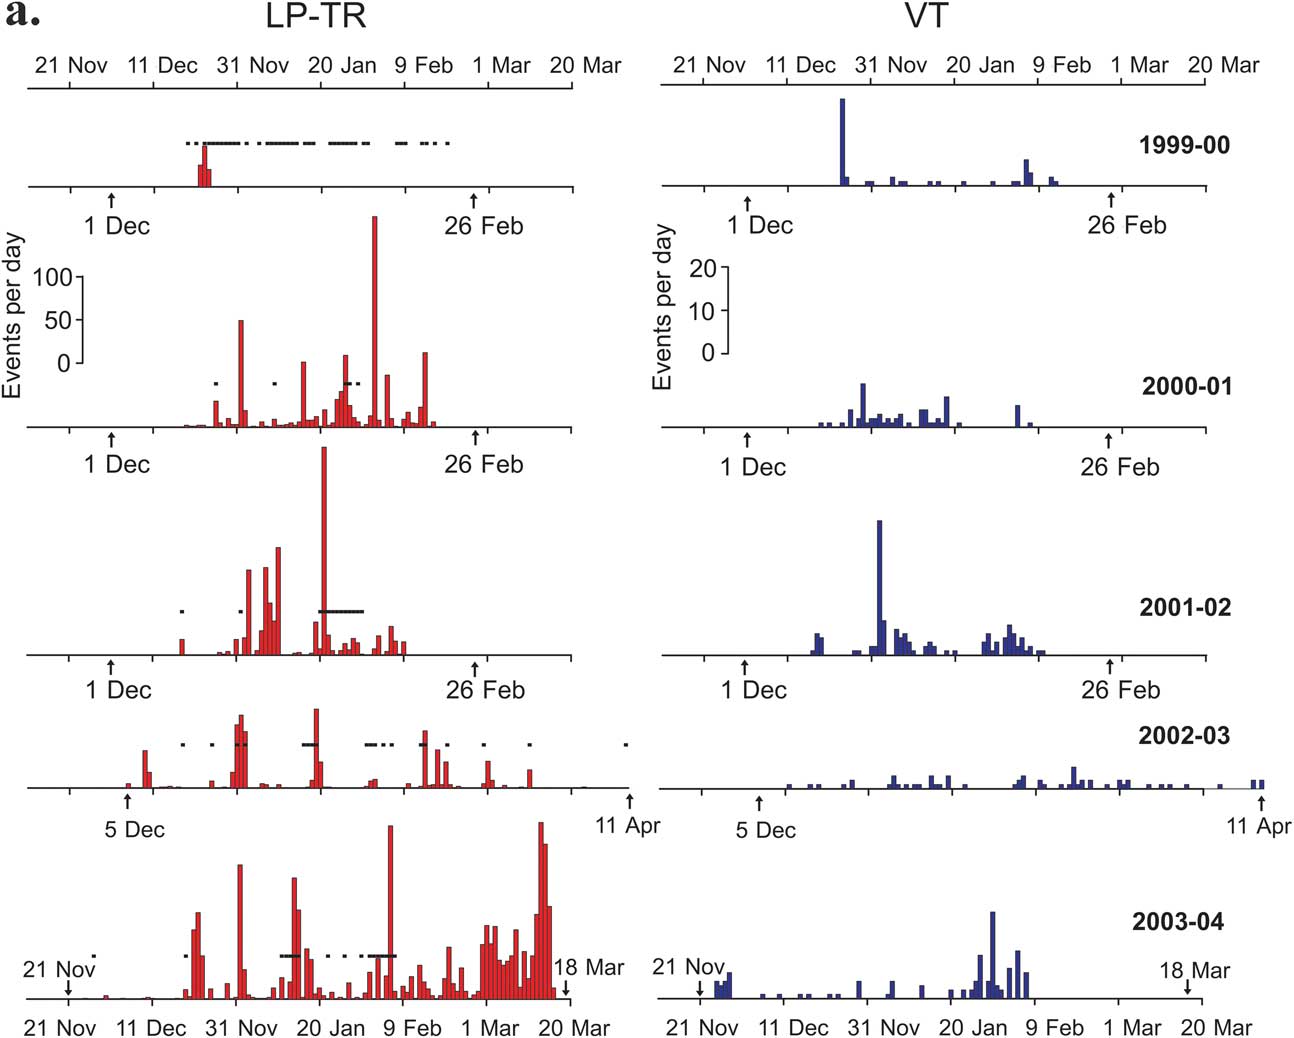
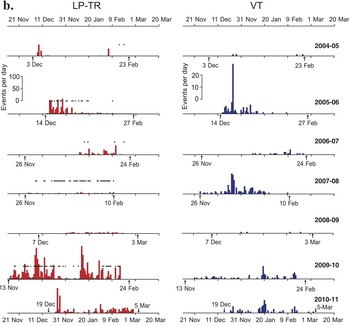
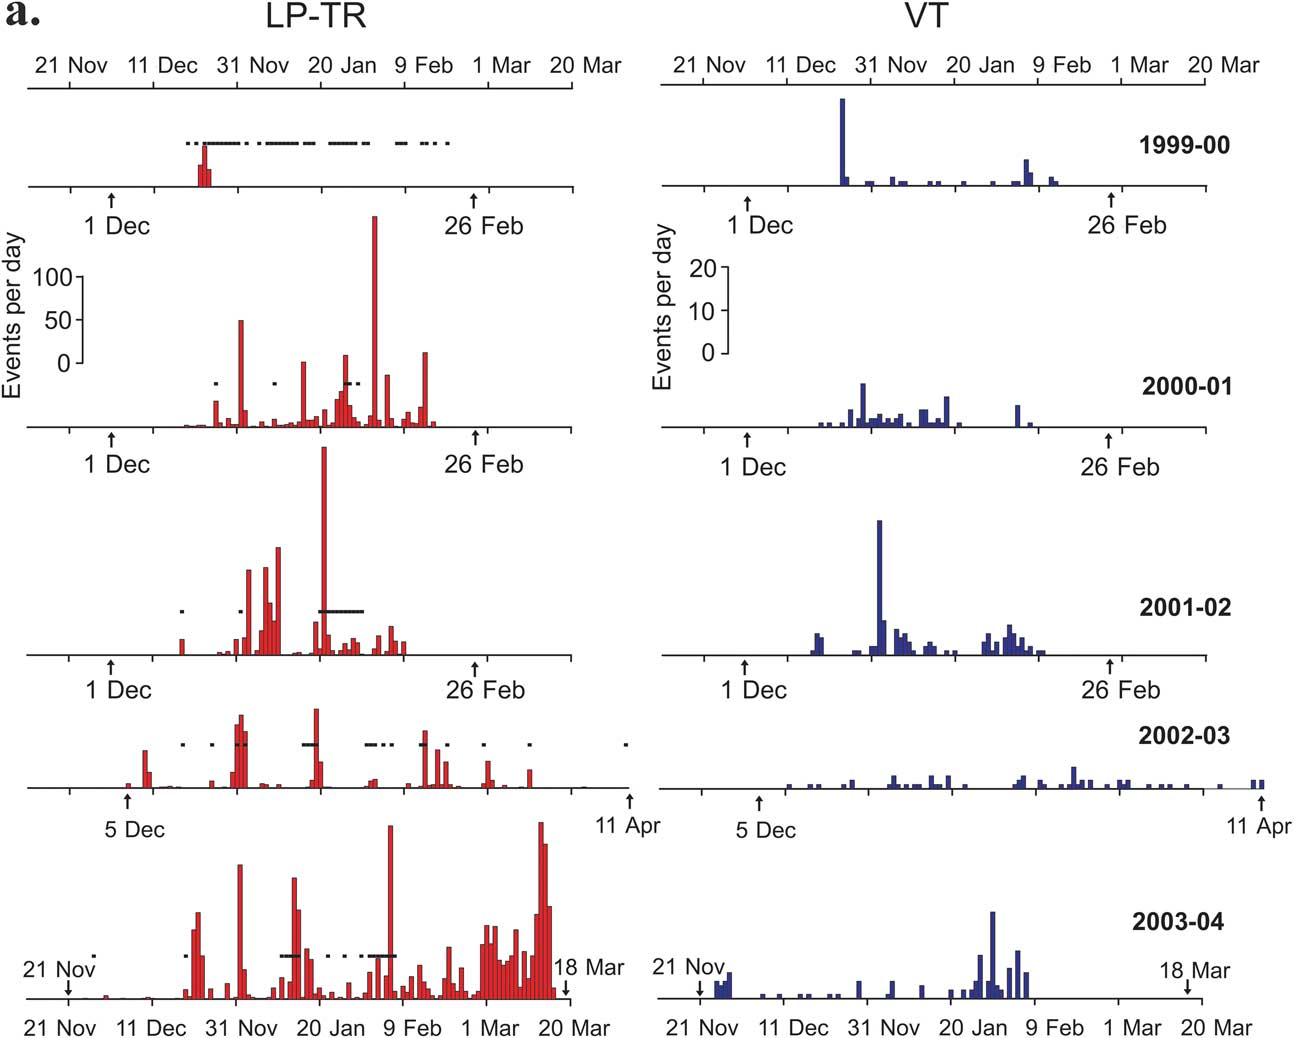
With regard to the temporal distribution of VT events over the surveys from 1999–2011, we can see that the level of activity varies over time (Fig. 5a & b). There are peaks of activity on specific days. Examples occur on 24 December 1999 (20 VT events), 2 January 2002 (31 VT events) and 24 December 2005 (39 VT events). Swarms can also be observed in some surveys, such as 54 VT events in 23 days (2000–01 survey), 62 VT events in 11 days (2001–02 survey), 69 VT events in 14 days (2003–04 survey), 106 VT events in a month (2005–06 survey), or 116 VT events in just over a month (2007–08 survey). By contrast, there are some surveys in which there are no obvious peaks or swarms but which have a very constant number of VT events, such as in the 2002–03, 2006–07, 2009–10, and 2010–11 surveys (Fig. 5). In practically all the surveys there were between 20 and 125 VT events except for the 2004–05 and 2008–09 surveys, in which there were as few as four VT events. The total numbers of VT events are small compared with the two periods of maximum activity in the 1991–92 and 1998–99 surveys produced by the seismo-volcanic crises (Fig. 4).
Histograms of the daily number of seismo-volcanic events recorded in the Gabriel de Castilla Station area during the summer field surveys in the period 1999–2011. Left: long-period (LP) events and tremor episodes (black dots). Right: volcano-tectonic (VT) earthquakes. Arrows show the beginning and end of the surveys.
continued

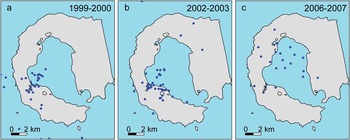
It is not always possible to locate VT earthquakes because they are often local, low magnitude events that are not recorded at a sufficient number of stations. For the locations to be considered reliable, they must be recorded by at least four autonomous stations or by a seismic antenna. Two types of spatial distribution of the VT events can be observed, one in which they are concentrated in one area or form alignments and another more scattered distribution. When the VT events occur in seismic swarms, they tend to be grouped, either near Fumarole Bay as happened in the crises of 1992 and 1999 (Ortiz et al. Reference Ortiz, García, Aparicio, Blanco, Felpeto, Del Rey, Villegas, Ibáñez, Morales, Del Pezzo, Olmedillas, Atiz, Vila, Ramos, Viramonte, Risso and Caselli1997, Ibáñez et al. Reference Ibáñez, Carmona, Almendros, Saccorotti, Del Pezzo, Abril and Ortiz2003b), or in other areas of the island. This can be observed for the 1999–2000 and 2003–04 surveys, in which there was a small swarm of VT events which formed a cluster in the same area of occurrence of the 1992 and 1999 crises (Fig. 6a & b). These two examples of spatial distributions of the VT events were detected by a seismic network in the case of the 1999–2000 survey and a seismic array in the case of the 2002–03 survey. This illustrates that the source location methodology does not significantly affect the results. However, when seismicity occurs in the form of discrete VT events (and not a swarm), the source distribution is spatially scattered, as obtained during the 2006–07 survey (Fig. 6c). These findings coincide with the first seismicity maps for the period 1986–91 drafted by Vila et al. (Reference Vila, Martí, Ortiz, García and Correig1992, Reference Vila, Correig and Martí1995).
Epicentral locations of the volcano-tectonic (VT) earthquakes. We find two different distributions: a. & b. clustered epicentres located by network (a.) and by the Fumarole Bay seismic antenna (b.), and c. scattered distributions located by network.

The LP events in Deception Island have been interpreted as evidence of active hydrothermal systems (Almendros et al. Reference Almendros, Ibáñez, Alguacil, Del Pezzo and Ortiz1997, Ibáñez et al. Reference Ibáñez, Del Pezzo, Almendros, La Rocca, Alguacil, Ortiz and García2000). They are always present on the island, although they are mostly local events, very rarely detected at more than one station. They match the general characteristics of LP events of other volcanoes, such as short duration (<60 sec) and monochromatic spectral content with peaks from 1–10 Hz. Their arrival is not particularly impulsive which makes them difficult to locate. In some studies the LP events and the volcanic tremor on Deception Island have been shown to have the same origin (Almendros et al. Reference Almendros, Ibáñez, Alguacil, Del Pezzo and Ortiz1997).
As occurs with the VT events, the time distribution of the LP events varies a great deal from one survey to another (Fig. 4). The highest number of LP events per survey since we began seismic monitoring on the island was 2868 (2003–04 survey). By contrast the minimum number of LP events was 58 (2007–08 survey). An observation of the LP events for the different surveys since 1989 shows that in most cases, after a peak of LP events in one survey, activity falls considerably the following year. This trend is most obvious in the 2003–04 and 2004–05 surveys in which a peak of 2868 LP events in the first year was followed by a low of 111 LP events in the next. This low level of LP activity continued in subsequent surveys until 2009–10 when there was another peak of 1487 LP events (Fig. 4).
Figure 5 shows that, as occurs with the VT events, there are days with notable peaks of LP activity with more than 100 events, especially during the 2000–01, 2001–02, 2003–04 and 2009–10 surveys. This occurred for example on 2 February 2001 (243 LP events), 21 January 2002 (240 LP events), 1 January 2004 (155 LP events), 6 February 2004 (200 LP events), 13 and 14 March 2004 (204 and 179 LP events, respectively) etc. We can see that in most surveys after a peak of LP activity, the number of LP events falls sharply in the days thereafter. By contrast there are surveys in which there are no obvious peaks of activity, such as the 2006–07, 2007–08 and 2008–09 surveys, in which the number of LP events was always <50 per day (Fig. 5).
The histograms of the total number of events per survey (Fig. 4) show that in the crisis of 1999, a peak of VT events coincided with a peak of LP events. This is the general rule, although in some surveys the LP activity appears in the form of volcanic tremor instead of discrete LP events. Tremors occurred in almost all the surveys except for those with the lowest activity, 2004–05 and 2008–09 (Fig. 5). Apart from long lasting continuous signals, we also considered as volcanic tremor any series of overlapping LP events where individual signals cannot be distinguished. This generally occurs when more than three or four LP events are produced per minute. In any case, a peak of LP events does not imply the occurrence of VT earthquakes. For example, during the 2003–04 survey there was a high number of LP events but the VT events remained at normal levels. In surveys with low levels of VT activity (such as 2004–05 and 2008–09), there was also low LP activity (Fig. 4).
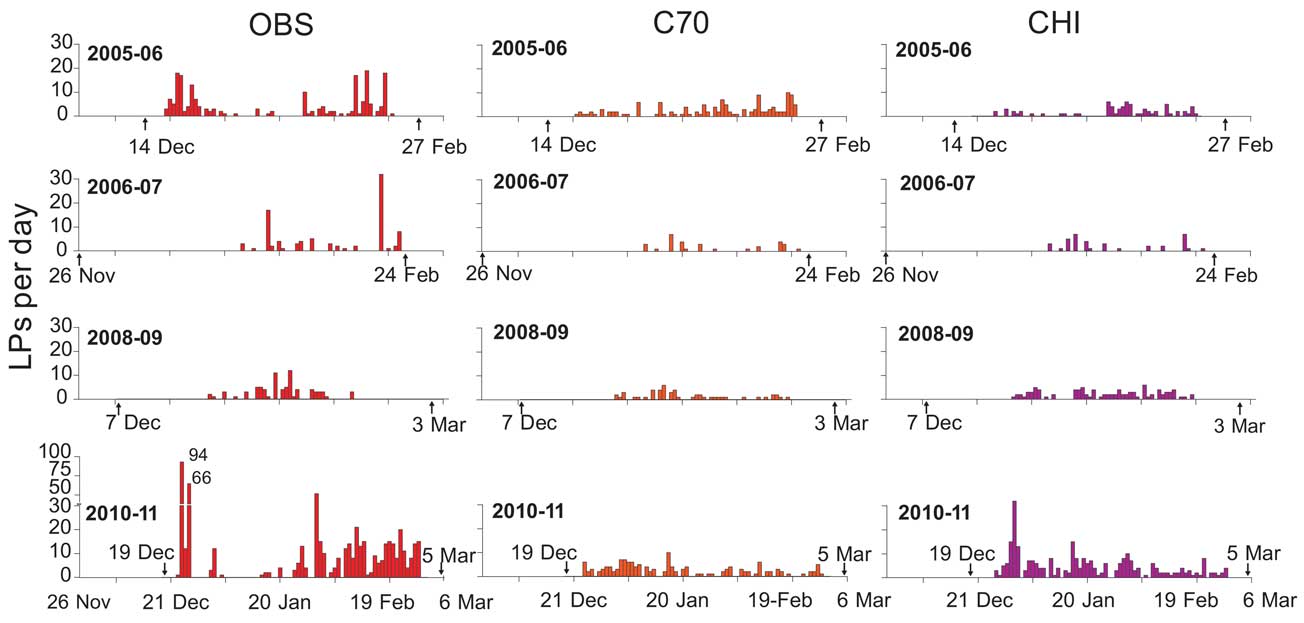
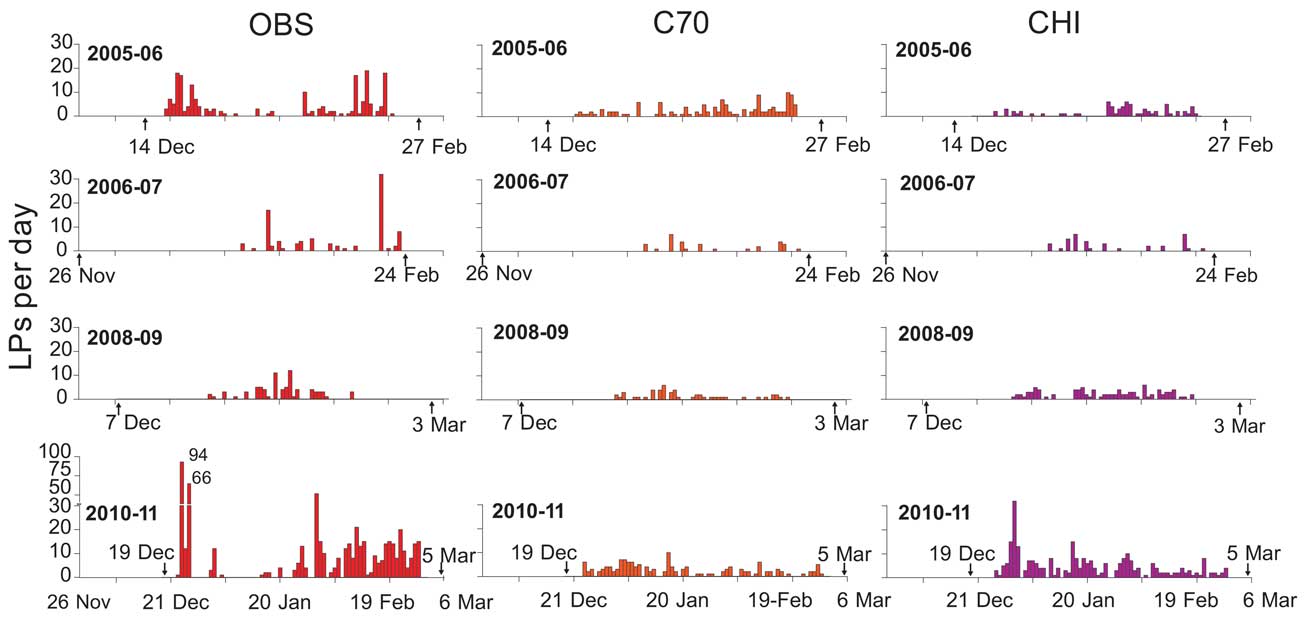
Two methods were used to identify the areas in which LP seismicity occurs. Firstly, those events that were only detected by one station were considered to be local events that took place in that area. Secondly, in some cases registered by seismic antennas, it was possible to calculate the slowness and the azimuth of the LP events, so obtaining the directions from which they came. The LP and tremor events generally took place in areas with geochemical and thermal anomalies. The areas in which the stations detect more of this kind of local LP events are mostly southern Fumarole Bay and to a lesser extent in the northern Fumarole Bay and ‘Obsidianas beach’. Figure 7 shows the histograms of LP events detected at the ‘OBS’, ‘C70’ and ‘CHI’ stations during some surveys. We can see that the different stations have different peaks of activity, so confirming the local nature of most of these events. In the case of the ‘Obsidianas beach’ and Fumarole Bay areas, intense seismic activity in the form of LP events and tremors was registered in all the surveys. This activity has been consistently higher than at the CHI and C70 stations (Fig. 3), where the lowest number of LP events was recorded (Fig. 7).
Histograms of the daily number of long-period (LP) events recorded at Deception Island during the summer field surveys 2005–06, 2006–07, 2008–09 and 2010–11 for the ‘OBS’, ‘C70’ and ‘CHI’ stations. Arrows show the beginning and end of the surveys.
In general, in all these surveys there have been very few hybrid events compared with the numbers of VT and LP events, although there was a significant increase in the 2002–03 survey. Apart from this isolated peak of activity, the number of hybrid events remained stable with an average of ten per survey. In addition to volcanic events, regional earthquakes have also been detected with S-P times of >4 sec. They are related with the regional tectonics of the Bransfield Strait. Teleseisms have also been detected. There are also signals caused by the presence of glaciers. These events, known as icequakes, originate in the micro-cracks within the glacier ice. They are short-duration signals lasting barely 1 sec and with a spectral content extending up to 20 Hz (Ibáñez et al. Reference Ibáñez, Del Pezzo, Almendros, La Rocca, Alguacil, Ortiz and García2000).
Discussion
To assess and compare seismic activity in different surveys, we must take into account various parameters. One of these is the continuous upgrading of the instrumentation deployed on the island since 1994, which has led to improvements in data transmission and data quality. The stations have changed from being short-period, trigger-detection systems to continuous recording stations. This has produced an enormous volume of data for processing which makes analysis more laborious. In addition, apart from a few false triggers, if the system was triggered it was considered that an event had occurred. The system detected the events and the operator classified them. Now both tasks are performed by the operator. This operator, who is not always the same person, decides whether an event has been detected and what type it is. Although there are common, objective conditions defining the characteristics of each event, this fact always influences the final decision on the classification of events.
Another parameter to take into account was that although for logistical reasons the stations have not always been installed in exactly the same places in all the surveys, we have attempted to use fixed sites from one survey to another. In order to correct the fact that we did not always use the same sites and taking into account the local nature of the seismic activity, we established a detection zone which has been monitored permanently throughout this period. This zone covered the area near the Spanish base and the south Fumarole Bay area, where stations were installed every year. Our results for this paper were obtained at these stations, as were the histograms of the events.
We analysed the spatial and temporal distributions of seismicity. For example, the number of VT events per survey varies from one year to the next. There are two main forms of temporal distribution. In some periods the earthquakes are distributed homogeneously, generally with a low level of activity, while in others there are peaks of VT activity which last a few days. These two patterns could correspond to different processes, involving regional tensions and the destabilization of local tectonics induced by volcanic activity.
The temporal distribution of LP events is heterogeneous. Ibáñez et al. (Reference Ibáñez, Almendros, Carmona, Martínez-Arévalo and Abril2003a) put forward the theory that there was more LP activity on days in which temperatures were higher (beginning of January). They explained that this was due to the increased supply of water to the aquifers caused by melting ice. In this paper it can be seen that this seasonal increase in LP events continued until the 2001–02 survey. However, after this survey there was no relationship between the season and the number of events, something that can be seen very clearly in the 2003–04, 2005–06 and 2009–10 surveys (Fig. 5). This is confirmed by the results from the continuous recording station that has been recording during the winter months in the island and has not shown any seasonal influence on the timing of LP events.
We have observed that there is no direct relationship between the number of VT events and LP events recorded during a survey. During the crisis of 1999, there were a lot of VT events and a lot of LP events. However, there have also been surveys in which, although there have been a high number of LP events, there have been relatively few VT events (2003–04 survey). This confirms the results of Ibáñez et al. (Reference Ibáñez, Almendros, Carmona, Martínez-Arévalo and Abril2003a, Reference Ibáñez, Carmona, Almendros, Saccorotti, Del Pezzo, Abril and Ortiz2003b), who concluded that the LP events and the VT events had independent sources. However, as can be seen in the histograms, when there are very low levels of VT events there are also very few LP events. This suggests some kind of link between them or perhaps a common dependence with an external process.
Seismic activity on Deception Island is of a very local nature, as manifested by the fact that although the stations are only 2 km apart, most events are only recorded at one station. There are two main reasons for this, namely the low magnitude of the events and the high seismic attenuation on the island. For example, Martínez-Arévalo et al. (Reference Martínez-Arévalo, Bianco, Ibáñez and Del Pezzo2003) measured a Q coda value around 150. Thus, the source areas for these seismic events have to be estimated as being close to the vicinity of the station where the events were detected.
To locate VT events, they have to be recorded by a minimum of four autonomous stations or by a seismic antenna. In our research since the crisis of 1999 we were able to locate the position of some of these VT events. They reveal two kinds of spatial distributions (Fig. 6). On the one hand, there are isolated VT events whose epicentres tend to be scattered throughout the volcanic edifice of the island with no area of maximum occurrence. The source of this kind of activity may be the local response to regional stresses. This would confirm the findings of Vila et al. (Reference Vila, Martí, Ortiz, García and Correig1992, Reference Vila, Correig and Martí1995) and Martí et al. (Reference Martí, Vila and Rey1996) in the first seismicity maps for the period 1986–91. On the other hand, when earthquakes appear in the form of seismic swarms, they are concentrated along very localized fracture zones, as can be seen in the research by Almendros et al. (Reference Almendros, Ibáñez, Alguacil and Del Pezzo1999), Ibáñez et al. (Reference Ibáñez, Del Pezzo, Almendros, La Rocca, Alguacil, Ortiz and García2000, Reference Ibáñez, Carmona, Almendros, Saccorotti, Del Pezzo, Abril and Ortiz2003b), and Carmona et al. (Reference Carmona, Almendros, Peña and Ibáñez2010). One example is the 1999–2000 survey in which a swarm of VT events took place in the same area of occurrence (Fumarole Bay) as the crises of 1992 and 1999 (Ortiz et al. Reference Ortiz, García, Aparicio, Blanco, Felpeto, Del Rey, Villegas, Ibáñez, Morales, Del Pezzo, Olmedillas, Atiz, Vila, Ramos, Viramonte, Risso and Caselli1997, Ibáñez et al. Reference Ibáñez, Almendros, Carmona, Martínez-Arévalo and Abril2003a, Reference Ibáñez, Carmona, Almendros, Saccorotti, Del Pezzo, Abril and Ortiz2003b). In the 2002–03 survey the area of occurrence was in the Irízar and Crater Lake areas, as found in previous research by Ibáñez et al. (Reference Ibáñez, Del Pezzo, Almendros, La Rocca, Alguacil, Ortiz and García2000). The reason is that when a swarm of VT earthquakes appears it is due to a destabilization of local fault systems. These VT events tend to be grouped in small areas mainly because the fractures involved are also small. For example, research by Carmona et al. (Reference Carmona, Almendros, Peña and Ibáñez2010) on the crisis of 1999 studied some faults that were <100 m long.
The location of the LP seismicity (both LP events and tremor) requires different techniques than those used with a seismic network. Long period events tend to be very low energy events which are difficult to detect in more than three stations. In this paper the areas in which the LP events occurred have been estimated on the basis of the location of the station that recorded the events and in some cases by using array techniques, for events detected by seismic arrays. In the latter case, the arrays provide us with azimuths to the position of the source and an apparent velocity. The LP and tremor events occurred in the same areas as in the surveys prior to the crisis of 1999. These sources are located mainly at sites of geochemical and thermal anomalies, for example the southern end of Fumarole Bay. In some cases they have also been detected with seismic antennas, such as in the Fumarole Bay and Mount Irízar areas (Fig. 1). This is the site of the most important fumarole system on the island, and where most volcanic events have been detected. It is the same source area identified in previous surveys (Ibáñez et al. Reference Ibáñez, Del Pezzo, Almendros, La Rocca, Alguacil, Ortiz and García2000, Reference Ibáñez, Almendros, Carmona, Martínez-Arévalo and Abril2003a, Reference Ibáñez, Del Pezzo, Almendros, La Rocca, Alguacil, Ortiz and García2003b). Our research has shown that in addition to the Fumarole Bay area, the seismic activity histograms show two areas in which, albeit to a lesser extent, a large number of LP events have been detected, namely the area to the north of Fumarole Bay (Fig. 1) and the ‘Obsidianas’ area. This kind of activity in the northern Fumarole Bay and ‘Obsidianas’ areas is probably due to the presence of CO2 gases throughout the area running from Punta Murature area to ‘Obsidianas beach’ (Fig. 1).
If we compare the VT events in all these surveys to those recorded in previous years, they have very similar wave-forms with clear P- and S-phases, and similar S-P times. The VT earthquakes produced in the volcanic edifice of Deception Island during this period of study have been of low magnitude, normally <1. In previous surveys, however, there were larger earthquakes. Examples are the magnitude 3.4 VT earthquake during the crisis of 1999 (Ibáñez et al. Reference Ibáñez, Carmona, Almendros, Saccorotti, Del Pezzo, Abril and Ortiz2003b) and the magnitude 5.6 earthquake located at 30 km west of Deception Island (Pelayo & Wiens Reference Pelayo and Wiens1989). The VT events still have the same content in frequencies as those registered in surveys prior to 1999–2000. Since the crisis of 1999, we have not detected a sufficient number of VT events to enable us to make comparisons of magnitude or depth.
In the case of LP events, most of the events have similar characteristics to those recorded in the crisis of 1999 and previous surveys. For example LP frequencies are in the range 1–4 Hz. However, from the 2009–10 survey onwards, a few LP events appear with spectral peaks at around 8 Hz. This would suggest the activation of a new source with smaller dimensions or different fluid properties. As regards the hybrid events, we have observed that as in previous surveys the P- and S-phases of the local earthquakes are very hard to distinguish, so making hybrid events very difficult to locate.
The generations of the VT earthquakes and the LP seismicity have a different mechanism. The VT events on Deception Island are the result of local fractures in the volcanic edifice that are exposed to the tensions created by regional tectonics and volcanic dynamics. These small faults, sometimes <100 m long (Carmona et al. Reference Carmona, Almendros, Peña and Ibáñez2010), create micro-seismicity. The stresses produced by volcanic dynamics are principally due to the different mechanisms resulting from two activation regimes. In the first, the magmatic chamber causes destabilizations in the heterogeneous fault systems. This destabilization may result from the exsolution of gases from the magma, leading to a decompression of the magmatic system and as a result, tectonic instability in the area. The magmatic intrusion also produces a deformation of the upper part, so destabilizing the system of fractures. This explains the crises of 1992 and 1999, in which the number of VT events increased considerably. The second regime may have two mechanisms. One is the partial sealing of the aquifers leading to an increase in pressure in the micro-fracture systems (Caselli et al. Reference Caselli, Santos-Afonso and Agusto2004), and the other is the direct product of regional stresses. These two mechanisms produce moderate VT seismicity compared with the crises of 1992 and 1999, the type of seismicity detected during the surveys analysed in this paper.
In order for LP events to be generated on Deception Island it is necessary to have on the one hand, fluid confined in cavities and on the other a perturbing system such as a heat source, increased gas supply etc. The fluids are subject to a build-up in pressure caused by different mechanisms. As a consequence, there is a perturbation in the walls of the conduit that propagates as seismic waves. The fluid filled cavity is characterized by a resonance frequency that depends on the structure of the cavity and the characteristics of the fluid. In this study we have shown that, given the local nature (only detected by one station) and high apparent slowness values of the LP seismicity, its source must be very shallow, at a depth of probably only a few hundred metres. This finding coincides with those of Almendros et al. (Reference Almendros, Ibáñez, Alguacil and Del Pezzo1999). If we take into account the high degree of fracturing of the medium, it is possible to conclude that the geometry of the resonant cavity is a crack. Due to the geological and hydrothermal conditions of the island, in which there are many aquifers, the cracks are full of water with gaseous components. The LP signals recorded by the sensors are therefore originated by the resonance of cracks filled with gasified water.
Although the VT earthquakes and the LP seismicity have different sources, they may be related due to the sealing of small fractures in the aquifer areas. According to Caselli et al. (Reference Caselli, Badi, Bonatto, Bengoa, Agusto, Bidone and Ibáñez2007), when a certain pressure is reached, the micro-cracks are activated creating small, much localized VT events. When these micro-cracks are open, the release of gases to the surface gives rise to volcanic LP events and a decrease in the number of VT events. This does not mean that the VT and LP events necessarily take place in the same source area. The LP events do not occur in the volume where brittle fractures open the way to the gas, but only when this gas interacts with the shallow aquifer. The energy release through the micro-cracks could be very slow until normal levels are reached. This could explain the fall in the number of events in the next survey until pressure builds up in the area again, so increasing the number of events.
There have been few hybrid events during these surveys compared to VT and LP events. These events, a combination of a high-frequency event followed by a low-frequency one, are difficult to identify and to locate. Sometimes when the event takes place some distance away from the stations, the high frequencies are filtered out. Or simply the characteristics of local rupture systems and dynamic fluid systems did not have the necessary conditions to produce a significant number of these events.
Two general models could be applied to analyse the way in which tremors are generated. They may be produced by oscillations of the volcanic conduits related to non-linear fluid flow or by resonances of fluid filled volcanic cavities. We think that the tremors recorded at Deception Island were generated by the second mechanism. During the 1999–2011 period tremor amplitudes are generally small, with reduced displacements below c. 1 cm2. There have been no tremor episodes of sufficient energy to make us think that they were caused by the direct action of the movement of the magma and that instead they were produced by the same model of generation as the LP events.
The source of perturbation that causes the build-up in pressure in the cavities or cracks of the LP and tremor episodes may have various causes. Firstly as seen earlier it may be produced by hydrothermal processes. It may also be generated directly by the pressure produced by the magmatic chamber which causes a destabilization. The perturbations may also result from external influences, such as the effect of oceanic microtremors (Stich et al. Reference Stich, Almendros, Jiménez, Mancilla and Carmona2011).
Conclusions
In this paper we have shown that LP events are the dominant form of seismicity in Deception Island in terms of numbers. However, the fact that there have been surveys with an even higher number of LP events than in the crisis of 1999 but with almost no VT events (2003–04 survey) suggests that the reactivation of the Deception Island volcano produces not only the appearance of LP and tremor events, but also an important destabilization in local fault systems that generates a large number of VT events. In fact, the reports by personnel from the Chilean base about the last eruption on the island in 1970 tell of felt earthquakes, some of them large, prior to the eruption. Since then the only felt earthquakes have been in the surveys classified as seismic crises of the volcano (1992 and 1999). This suggests that local faults are involved in or near to volcanic activity. According to our data, since 1999 the level of seismic activity on the island has ranged from low to moderate and has never reached sufficiently high levels to indicate a reactivation of the volcano.
As a result of the study of all the seismic surveys on Deception Island, two regimes of seismic activity can be established. They correspond to different states of volcanic activity, dormant and restless, which refer to the absence and presence respectively of evidence of a volcanic reactivation.
The dormant state is the most common, and is mainly characterized by the occurrence of shallow, low energy LP events and volcanic tremor episodes caused by the circulation of fluids in the hydrothermal system. In this state, some VT and hybrid events may also take place as a response to regional tectonics.
The restless state is characterized by a high number of VT earthquakes, which may be relatively energetic and even felt by people at the island. They can be accompanied by many LP events, large enough to be detected at most stations of the seismic network. The restless state was reached during the crises of 1992 and 1999. These two episodes have been explained as the consequence of a possible magmatic intrusion that did not reach the surface but caused the destabilization of the fragile tectonic system.
Since the crisis of 1999, Deception Island volcano has so far remained in a dormant state of activity. Nonetheless, Deception is probably among the most active volcanoes in Antarctica. Moreover, with the presence of two scientific bases and increasing tourism, it is necessary both to continue and improve seismic monitoring of the volcano and to conduct further research into the mechanisms that generate volcanic activity.
Acknowledgements
We thank Steve McNutt, Mario Castellano, and Alan Vaughan for their useful comments and suggestions. We also thank all the participants in the surveys at Deception Island from 1999–2011, including M. Abril, F. Lorenzo, J.A. Peña, C. Martínez-Arévalo, J.A. Esquivel, M. Bretón, J.B. Martín, M. La Rocca, J.L. Pérez-Cuadrado, M. Feriche, F. Torcal, G. Saccorotti, D. Zandomeneghi, F. Carrión, N. Sánchez, A. Bidone, F. Fernández-Ibáñez, L. Buontempo, L. Zuccarello, G. Badi, R. Pérez, A. Jiménez, N. Rossi, A. Ontiveros, A. García-Yeguas, C. Bengoa, J.J. Redondo, A. Villaseñor, R. Martín, B. Gaite, P. Danecek, and J. Galeano. We acknowledge the support of the Spanish Army at the Gabriel de Castilla Antarctic base, Spanish Navy on the RV Hespérides and RV Las Palmas, Marine Technology Unit, and remaining institutions involved in the Spanish Antarctic Research Programme. This work has been partially funded by projects ANT98-1111, REN2000-2897, REN2001-3833, CGL2005-05789, POL2006-08663, CGL2007-28855, CTM2008-03062, CGL2008-01660, CTM2009-07705, CTM2009-08085, CTM2010-11740 and CGL2011-29499-C02-01.