Descriptive representation in the United States is at an all-time high.Footnote 1 Multiracial candidates, or candidates who may now be categorized with two or more races, are part of this transformation—yet they have always been part of our politics (Hochschild and Weaver Reference Hochschild and Weaver2007, 650; Powell Jr. Reference Powell2002; Swain Reference Swain1993, 26).Footnote 2 Describing Senator Kamala Harris’s 2020 presidential campaign rally in Oakland, California, in January 2019, a reporter wrote, “Her life story gives her not only entree to black voters who make up a significant share of the Democratic primary electorate but also Asian American voters whose ranks are growing” (Viser Reference Viser2018). Other reporters have pointed to her Black and Asian American background as a good omen for electoral success, referring to her as “half-black and half-Indian” and "embod[ying] several parts of … the voting bloc that was so important to President Obama’s rise" (Henderson Reference Henderson2015). Yet, some South Asian groups have doubted her sincerity to represent them and her motivations for showcasing her Indian American background (Fuchs Reference Fuchs2019). In her memoir, Harris discusses how she was socialized to pay attention to how others would see her: “My mother understood very well that she was raising two black daughters. She knew that her adopted homeland would see Maya and me as black girls, and she was determined to make sure we would grow into confident, proud black women” (Harris Reference Harris2009, 13). Although Harris is no longer a presidential candidate, her story illustrates the complex ways that multiracial candidates must manage how others see them (Carter and Dowe Reference Carter and Dowe2015, 113; Citrin, Levy, and Van Howeling Reference Citrin, Levy and Howeling2014, 1126; Masuoka Reference Masuoka2017, 150): pundits treat her as multiracial, some South Asians doubt her, and she was raised Black. This study focuses on voter responses to multiracial candidates and is among the first generation of political science scholarship on the multiracial population in the United States (Davenport Reference Davenport2016a, Reference Davenport2016b, Reference Davenport2018; Hochschild and Weaver Reference Hochschild and Weaver2010; Hochschild, Weaver, and Burch Reference Hochschild, Weaver and Burch2012; Masuoka Reference Masuoka2008, Reference Masuoka2011, Reference Masuoka, Barreto and O’Bryant2015, Reference Masuoka2017).
Although the idea of “multiracial” candidates would not have been applicable to earlier Black candidates (Davis Reference Davis1991), today, nearly 23% of elected officials describe their backgrounds as nonsingular in some way (Hardy-Fanta et al. Reference Hardy-Fanta, Lien, Pinderhughes and Sierra2013, 11). Thus, nearly one in four elected officials may be multiracial–a stark contrast to the general population estimate of around 3% (US Census Bureau 2018c). Three of the four women of color currently serving in the US Senate are multiracial (Kamala Harris, Catherine Cortez Masto, and Tammy Duckworth), and two multiracial Congresswomen sought the 2020 presidential nominations (Harris and Tulsi Gabbard). Whereas Harris and Gabbard represent high-profile cases, members of Congress begin their political careers in lower-level, lower-information races (Mariani Reference Mariani2008)—precisely the places where candidate race may condition vote choice (McConnaughy et al. Reference McConnaughy, White, Leal and Casellas2010) and ultimately may constrain future electoral opportunities. The current prominence of these representatives raises an important question: Do voters prefer just any descriptive representative?
Studying multiracial candidates and elected officials helps us address numerous issues. First, they represent the future of American democracy. The two-or-more races population is among the fastest-growing groups in the United States (US Census Bureau 2012), projected to number 25 million people by 2060 (US Census Bureau 2018a): that is almost the size of the population of the entire state of Texas in 2019 (US Census Bureau 2019). The median age of the two-or more races population is about 20–21 years (US Census Bureau 2018b), and these individuals are future city council members, state legislators, and members of Congress. Second, voter responses to these candidates may be used as a gauge of US race relations (Davenport Reference Davenport2018; Hochschild, Weaver, and Burch Reference Hochschild, Weaver and Burch2012; Masuoka Reference Masuoka2017). In a country with a history of terrorism levied against Black men falsely accused of raping White women (Wells-Barnett 2005; Squires Reference Squires2015), it was inconceivable that someone like Barack Obama could become president and showcase his White mother to White voters. Voter reception of these candidates offers one way to measure where we stand. Third, these candidates help us envision the prospects and limitations for multiracial coalitions, because they descriptively represent multiple racial groups simultaneously. As the country inches toward majority-minority status, these candidates may be attractive to voters, as well as party leaders seeking to maximize their reach to voters (Williams Reference Williams2006).
In addition to these nominal issues, studying multiracial candidates and elected officials helps us address conceptual, theoretical, and methodological issues. Current conceptions of descriptive representatives do not reflect the reality of race as a social construction (Davenport Reference Davenport2018, Reference Davenport2020; Masuoka Reference Masuoka2017; Sen and Wasow Reference Sen and Wasow2016). Traditional research on minority representation typically conceives of descriptive representatives as monoracial, monoethnic, or monogender (Barreto Reference Barreto2010; Broockman Reference Broockman2013; Casellas Reference Casellas2011; Dovi Reference Dovi2002; Fraga Reference Fraga2016; Grose Reference Grose2011; Holman Reference Holman2014; Holman, Schneider, and Pondel Reference Holman, Schneider and Pondel2015; Juenke Reference Juenke2014; Mansbridge Reference Mansbridge1999; McConnaughy et al. Reference McConnaughy, White, Leal and Casellas2010; Merolla, Sellers, and Lemi Reference Merolla, Sellers and Lemi2017; Rouse 2013; Shah Reference Shah2014; Stout Reference Stout2018; Swain Reference Swain1993; Tyson Reference Tyson2016; but see Adida, Davenport, and McClendon Reference Adida, Davenport and McClendon2016; Bejarano Reference Bejarano2013; Brown Reference Brown2014; and Masuoka Reference Masuoka, Barreto and O’Bryant2015). Scholars of representation typically omit multiracial candidates (Silva and Skulley Reference Silva and Skulley2019), or they do not conceive multiracial elites as descriptive representatives of multiple racial groups (Barreto Reference Barreto2010, ch. 7; Grose Reference Grose2011, 47). Explicitly engaging with multiracial candidates moves this scholarship toward race as a social construction and challenges scholars to be more precise with measurement.
Methodologically, multiracial representatives introduce a new layer of variation in research designs that correlate race with substantive representation. For example, few in-depth studies of descriptive representatives allow the explanatory variable—ascribed race—to vary by sampling multiple racial groups and incorporating multiracial representatives (Lemi Reference Lemi2018a). By using multiracial cases, we may observe the intermediate between a representative who is Asian and a representative who is White—one who may identify as Asian, White, or something else (Harris Reference Harris2019).
Theoretically, multiracial candidates offer harder cases by which to test the strength of shared identity between voters and candidates: they are simultaneous insiders and outsiders. By belonging to multiple racial categories, these cases offer solutions to causal inference challenges (Adida, Davenport, and McClendon Reference Adida, Davenport and McClendon2016) and raise questions about the limitations of social identity theory (Tajfel and Turner Reference Tajfel, Turner, Austin and Worchel1986) in explaining voter preferences for descriptive representatives. The absence of multiracial representatives has likely led to studies and research designs that undertheorize and overestimate the effects of any descriptive representative on some substantive outcome. Incorporating multiracial candidates challenges the idea in public discourse that voters, particularly voters of color, engage in “identity politics” and simply select any candidate who shares their race (Burge, Wamble, and Cuomo Reference Burge, Wamble and Cuomo2020; Wamble Reference Wamble2018).
Normatively, how voters respond to multiracial candidates has implications for our efforts to recruit “preferable” descriptive representatives (Dovi Reference Dovi2002). Scholars have not seriously interrogated what a growing multiracial population means for normative criteria for representatives (Dovi Reference Dovi2002, 732). Although ideal descriptive representatives are defined by their social ties (Dovi Reference Dovi2002), purposefully analyzing individuals who belong to multiple racial groups forces scholars and practitioners to think carefully about whether representatives who “stand for” (Pitkin Reference Pitkin1967) multiple racial groups may legitimately “stand as” descriptive representatives. If voters deem multiracial candidates more preferable than their monoracial counterparts, then we must pay serious attention to whether the growth of this population contributes to racial inequality and further marginalizes non-White, non-multiracial, and darker-skinned people (Bonilla-Silva Reference Bonilla-Silva2004; Davenport Reference Davenport2016a). If voters deem multiracial candidates less preferable than their monoracial counterparts, then we must consider what the growth of this population means for the ability of our electoral institutions to truly reflect the United States. Practically, the increasing size of this population raises questions about party leaders’ strategies for recruiting these candidates to advance party platforms, even those that are regressive on civil rights (Philpot Reference Philpot2009; Williams Reference Williams2006).
I opened this line of research to address these issues of the day. In this article, I demonstrate that future research on identity and representation must engage multiracial elites. I advance theories of voter preferences for descriptive representatives and call on scholars to reconsider who counts as a descriptive representative in American democracy. I draw on the social identity theory of leadership (Hogg Reference Hogg2001) to develop a general theory of evaluations of attribute-atypical candidates and use multiracial candidates to test this theory. I theorize that cueing an atypical group categorization provides mixed information about how a candidate self-identifies and therefore adheres to group norms of racial identity (Brunsma Reference Brunsma2006). The result of this cue is that co-racial constituents withhold support, but non-co-racial constituents increase their support when confronted with a multiracial candidate. This is because multiracial classification impedes the efficiency of race as a heuristic for same-race monoracial voters with strong racial identities, and it signals exceptionality to outsiders. Thus, when appealing to same-race monoracial voters, multiracial candidates are “not really” a full member of the group, resulting in loss of support. For that same reason, multiracial candidates are attractive alternatives to their monoracial counterparts among voters outside their own communities. I conducted a conjoint survey experiment on 786 White, Black, Asian, and Hispanic respondents, in which candidate racial categorization was manipulated to be monoracial or multiracial, and I analyzed data from the 2016 National Asian American Pre-Election Survey (NAAS; Ramakrishnan et al. Reference Ramakrishnan, Lee, Lee and Wong2017). I demonstrate that multiracial categorization has systematic effects across racial groups. Overall, those with stronger racial identities tend not to support multiracial candidates to the same extent as they do monoracial candidates. This study indicates that in the face of a growing multiracial population and a diversifying democracy, preferences for monoracial representatives are likely to persist.
This research is generative and raises questions about how we study demographic categories and representation. What does the presence of candidates who defy gender binaries mean for American democracy (Jones et al. Reference Jones, Brewer, Young, Lambe and Hoffman2018)? How do representatives who occupy multiple descriptive categories legislate (Brown Reference Brown2014)? How might phenotypic expressions used to denote social categories like race and gender blur how we recognize descriptive representatives (Flores et al. Reference Flores, Haider-Markel, Lewis, Miller, Tadlock and Taylor2018; Lemi Reference Lemi2018a)? This research marks the beginning of a new agenda on identity and representation.
“Multiracial” Candidates: Then and Now
The study of multiracial identification is relatively new in political science, and work on multiracial descriptive representatives is nearly nonexistent. In contrast, other disciplines examine the many types of multiracial identity (Renn Reference Renn2008), its determinants (Davenport Reference Davenport2016b; Harris and Sim Reference Harris and Sim2002; Rockquemore and Brunsma 2008), and its consequences for social life (Campbell Reference Campbell2009; Doyle and Kao Reference Doyle and Kao2007; Shih and Sanchez Reference Shih and Sanchez2005). Such scholars are concerned about the broader meaning of multiracial identity for the US racial order (DaCosta Reference DaCosta2007; Daniel Reference Daniel2001; Hochschild and Weaver Reference Hochschild and Weaver2010; Hochschild, Weaver, and Burch Reference Hochschild, Weaver and Burch2012; Squires Reference Squires2007; Thornton Reference Thornton2009; Williams Reference Williams2006). Recent scholarship considers multiracial identity’s implications for political attitudes (Davenport Reference Davenport2016a; Davenport et al. Reference Davenport, Franco, Iyengar and Westwood2015; Masuoka Reference Masuoka2008, Reference Masuoka2011), but we know little about its implications for candidate choice.
Historically, “multiracial” candidates were unimaginable, but candidates with multiracial ancestry are not new (Hochschild and Weaver Reference Hochschild and Weaver2007, 650; Powell Jr. Reference Powell2002; Swain Reference Swain1993, 26). Today’s public and scholarly discourse on interracial intimacy and racial classification (DaCosta Reference DaCosta2007; Dalmage Reference Dalmage2000; Davenport Reference Davenport2018; Lee and Bean Reference Lee and Bean2010; Masuoka Reference Masuoka2017; Spencer Reference Spencer1999; Williams Reference Williams2006) is a response to and product of the social, political, and economic hierarchies that White colonizers and enslavers engineered (Davis 1999; McRae Reference McRae2018; Pascoe Reference Pascoe2009). Today, being a multiracial candidate may seem advantageous—one has more attributes to present herself as “one of” her voters (Fenno 1978, 58). Although most Americans say they would vote for a co-partisan multiracial candidate (Campbell and Herman Reference Campbell and Herman2010, 1519–20, 1530), few studies have tested the extent to which people actually do support multiracial candidates relative to monoracial ones.
There are three possible outcomes for voter preferences for multiracial candidates relative to monoracial ones: they may be more preferable than outsider monoracials, less preferable than same-race monoracials, or somewhere in between.Footnote 3 The latter two possibilities are rarely explored in studies of race and candidate evaluation (but see Adida, Davenport, and McClendon Reference Adida, Davenport and McClendon2016). The literature on voter preferences for same-race candidates finds that, relative to an outside monoracial candidate, voters tend to prefer candidates from their own racial group (Ansolabehere and Fraga Reference Fraga2016; Barreto Reference Barreto2010; McConnaughy et al. Reference McConnaughy, White, Leal and Casellas2010). This preference is known as the co-racial or co-ethnicity effect.Footnote 4 The co-racial/co-ethnicity effect suggests that, in contests between a same-race candidate and an outsider monoracial candidate, voters lean toward same-race candidates. Applying this to multiracial candidates suggests that a multiracial candidate should be more preferable than an outsider monoracial candidate: any descriptive representative is better than no descriptive representative.
However, multiracial candidates complicate the co-racial/co-ethnicity effect because they are simultaneously a member of the voter’s racial group and of an outsider group. There is arguably a degree of “racial distance” between multiracial candidates and the monoracial voters evaluating them that does not necessarily exist between same-race monoracial candidates and the monoracial voters evaluating them (Harris Reference Harris2019, 8–10). One study found that when a Black/White candidate identified as “biracial,” White voters rated him lower on civil rights competence than a Black/White candidate who identified as African American (Masuoka Reference Masuoka, Barreto and O’Bryant2015, 97). As studies on Barack Obama demonstrate, having a White mother did not shield him from racism from White voters (Piston Reference Piston2010; Tesler Reference Tesler2013). Multiracial candidates may not be viewed as “full” members of the racial group compared to monoracial candidates who can draw on their backgrounds more “authentically” (Lerman, McCabe, and Sadin Reference Lerman, McCabe and Sadin2015, 59; McIlwain and Caliendo Reference McIlwain and Caliendo2011, ch. 3). Thus, relative to same-race monoracial candidates, a second outcome is that multiracial candidates may be less likely to collect votes when appealing to voters from their racial parts.
A third alternative is that multiracial candidates may be more preferred than outsider monoracial candidates, largely because they may be viewed as exceptional or exotic. Whereas the discourse on representation often focuses on politicians of color and their monoracial backgrounds, multiracial categorization is a stark contrast (Brewer Reference Brewer1991, 478). Lighter-skinned candidates, who in the minds of voters could be classified as multiracial, enjoy an evaluative advantage (Ahuja, Ostermann, and Mehta Reference Ahuja, Ostermann and Mehta2016; Kinder and McConnaughy Reference Kinder and McConnaughy2006, 159; Terkildsen Reference Terkildsen1993; Weaver Reference Weaver2012). Multiracial people are fetishized as “attractive” (Sims Reference Sims2012; Skinner, Perry, and Gaither Reference Skinner, Perry and Gaither2019), receive more attention in the online dating scene (Curington, Lin, and Lundquist Reference Curington, Lin and Lundquist2015), have higher socioeconomic statuses (Davenport Reference Davenport2016b), and live in less segregated neighborhoods than do monoracial people (Bennett Reference Bennett2011). Public-audience books portray multiracial persons as genetically superior to monoracial persons (Ziv Reference Ziv2016). Thus, multiracial candidates may enjoy an advantage when appealing to voters completely outside of their racial parts. Although these alternatives are plausible, we need an explanation for why they exist and a test of whether multiracial candidates fare differently than monoracial candidates.
Theory and Hypotheses
I use the social identity theory of leadership (Abrams and Hogg Reference Abrams and Hogg1990; Hogg Reference Hogg2001; Hogg, Knippenberg, and Rast Reference Hogg, van Knippenberg and Rast2012) to develop a general theory about how voters react to multiracial candidates. Whereas social identity theory concerns how motivations to maintain self-esteem shape intergroup behavior (Tajfel and Turner Reference Tajfel, Turner, Austin and Worchel1986), the social identity theory of leadership is about who gets to represent the group (Hogg Reference Hogg2001). People nested in group identities “cognitively represent social categories as prototypes,” or exemplars of what it means to be a member of a social group (Hogg and Reid Reference Hogg and Reid2006, 10). As Hogg (Reference Hogg2001, 189) notes, when an identity becomes “salient,” those who are more prototypical naturally rise to leadership because others defer to them because they are prototypical. The theory laid out by Hogg (189, 190) is that those who most closely resemble the group prototype are likely to be viewed as “legitimate” leaders: they “embody” the group. This theory is concerned with how well group leaders fit into group prototypes, and it is an ideal tool to explain how voters respond to multiracial candidates who are partially members of their constitutive racial groups. I theorize that multiracial categorization by an external source—be it the media, a candidate list, or another elite—provides mixed information to voters about how well a candidate adheres to group norms of identity, resulting in a lower probability of securing votes from co-racials, but a greater probability of securing votes from all other groups. Although this framework focuses on multiracial candidates, it may be applied to other candidates who have atypical attributes, such as second-generation US candidates who hold connections to foreign-born immigrants and native-born Americans, or even to ideological moderates.
A candidate’s fit with a group category, in this case a racial category, is important for securing votes. Applying the logic of Hogg and colleagues (Reference Hogg, van Knippenberg and Rast2012, 269) to race, how well a person conforms to what constitutes an individual’s picture of the “typical Hispanic” or “typical Asian” will shape how someone who has already subscribed to an “Asian” or “Hispanic” identity receives her. If candidates are classified as multiracial by others, regardless of their identity, that external classification signals they are not prototypical. In the language of Fenno (1978, 58), the signal is “I am not one of you.” Thus, we might expect that multiracial categorization weakens one’s chances for gaining status as a group leader, because it communicates explicitly that one is not prototypical of the group (Harris Reference Harris2019).
I theorize that attribute-atypical candidates—here, candidates categorized by two races— violate norms of group prototypes, in this case, norms of identity. For Hogg and Reid (Reference Hogg and Reid2006, 11), norms and prototypes are one and the same. Norms of racial group identity may be understood as stereotypes (Hogg and Reid Reference Hogg and Reid2006, 10–11; Masuoka and Junn Reference Masuoka and Junn2013, ch. 3; Omi and Winant Reference Omi and Winant1994), such as the importance of speaking Spanish for being Latino (Monforti, Michelson, and Franco Reference Monforti, Michelson and Franco2013). Thus, I define group norms of racial identity as expectations of how individuals classified in a group “should” identify (Bunyasi and Rigueur Reference Bunyasi and Rigueur2015, 196; White, Laird, and Allen Reference White, Laird and Allen2014).
Multiracial categorization of candidates, absent information about their own self-identification, may result in sanctioning from group members, because it creates ambiguity about where those individuals stand with respect to the group (Hogg, Knippenberg, and Rast Reference Hogg, van Knippenberg and Rast2012, 282). Among multiracial persons, the commonly asked question “What are you?” (Bernstein and la Cruz Reference Bernstein and De la Cruz2009; Pew Research Center 2015, 55) is arguably the beginning of enforcement from others who try to assess their identities and allegiances. Experiencing microaggressions from family related to one’s multiracial background is not unusual (Nadal et al. Reference Nadal, Sriken, Davidoff, Wong and McLean2013). According to interviews with multiracial legislators, this ambiguity stems from the knowledge that they may be classified as members of two races, which raises questions about their self-identification (Lemi Reference Lemi2018a, Reference Lemi2018b).
At the same time, multiracial candidates’ atypical backgrounds may yield benefits. This is because these candidates represent less of the negative stereotypes attached to being a member of any one group (Purdie-Vaughns and Eibach Reference Purdie-Vaughns and Eibach2008, 382–83). Indeed, this is the logic behind arguments that use an intersectional framework to assess the candidacies of women of color (Bejarano Reference Bejarano2013, 8). Applying this logic to multiracial candidates, they may be exceptional because they are “only” partially some other race—they are not “really” Black, White, Asian, or Hispanic. Thus, voters across racial groups may prefer multiracial candidates relative to outsider monoracial candidates because they represent a novelty: they do not fully fit outsider group prototypes (Hogg Reference Hogg2001; also see Skinner, Perry, and Gaither Reference Skinner, Perry and Gaither2019).
Race is a heuristic for candidate evaluation and political behavior (Dawson Reference Dawson1994; McConnaughy et al. Reference McConnaughy, White, Leal and Casellas2010; Sanchez and Masuoka Reference Sanchez and Masuoka2010; Schildkraut Reference Schildkraut2013, Reference Schildkraut2017). I theorize that multiracial categorization impedes the use of race to select a candidate. If individuals are identified with two racial groups, group members may question whose politics they support and then sanction their choice by withholding votes. This is because multiracial categorization is inconsistent with dominant understandings of racial categories (Omi and Winant Reference Omi and Winant1994, 59). Voters from multiracial candidates’ own racial groups may doubt and subsequently punish multiracial candidates for not fitting the group prototype by not voting for them, whereas outsiders may give votes to multiracial candidates for the same reason. The preceding discussion leads me to two hypotheses about preferences for multiracial and monoracial candidates.
-
H1: Racial proximity between the voter and the candidate will have a monotonically positive effect on vote choice, such that same-race monoracials are more preferable than same-race multiracials, who in turn are more preferable than outsider monoracial candidates.
-
H2: Outsider multiracial candidates will be more preferable than outsider monoracial candidates.
Heterogeneity by Linked Fate and Group Identity
Linked fate and social identification with a group are relevant to candidate evaluation (McConnaughy et al. Reference McConnaughy, White, Leal and Casellas2010). Even though scholars have debated how well the concept of linked fate applies to different racial groups (Gay, Hochschild, and White Reference Gay, Hochschild and White2016; Sanchez and Vargas Reference Sanchez and Vargas2016), the idea captures one’s sense of political interconnectedness with one’s racial group (Dawson Reference Dawson1994; Junn and Masuoka Reference Junn and Masuoka2008; Masuoka Reference Masuoka2006; Sanchez and Masuoka Reference Sanchez and Masuoka2010; Wong et al. Reference Wong, Ramakrishnan, Lee and Junn2011).
Although earlier work shows that those with linked fate are those more likely to prefer candidates from their own racial groups (McConnaughy et al. Reference McConnaughy, White, Leal and Casellas2010; Schildkraut Reference Schildkraut2013, Reference Schildkraut2017), we do not know whether and to what extent linked fate even matters for evaluations of multiracial candidates. However, this work does suggest that because multiracial candidates are group atypical, group members may not feel a sense of linked fate with them (Adida, Davenport, and McClendon Reference Adida, Davenport and McClendon2016, 830; Kinder and McConnaughy Reference Kinder and McConnaughy2006, 157, 159, 163).
Heterogeneity by social identification with a group may also differ (McConnaughy et al. Reference McConnaughy, White, Leal and Casellas2010). Although linked fate speaks to how those with politicized identities may evaluate multiracial candidates, voters who simply strongly identify with their own racial group may discriminate against multiracial candidates because of a heightened tendency to distinguish who truly belongs to the group (Harris and Findley Reference Harris and Findley2014). Alternatively, those who strongly identify with the racial group may be more likely to favor any candidate from their group, including multiracial candidates, than those with weaker identities (Tajfel and Turner Reference Tajfel, Turner, Austin and Worchel1986). The literature is thus agnostic: multiracial candidates may activate a sense of linked fate or strong group identity among their own groups and cultivate support, or those with linked fate and strong group identities may punish multiracial candidates.
Data and Method
I tested the two main hypotheses and explored heterogeneity by linked fate and group identity with a conjoint experiment that manipulated exposure to a candidate’s race (Hainmueller, Hopkins, and Yamamoto Reference Hainmueller, Hopkins and Yamamoto2014).Footnote 5 The conjoint allowed me to manipulate candidate race and numerous other candidate characteristics relevant to vote choice (Hainmueller, Hopkins, and Yamamoto Reference Hainmueller, Hopkins and Yamamoto2014, 2).Footnote 6 The design allows for comparisons between monoracial candidates and multiracial candidates of specific combinations. Alternative approaches, such as manipulating racial ancestry and racial identity (Masuoka Reference Masuoka, Barreto and O’Bryant2015), are beyond the scope of this article.Footnote 7
Procedures
The experiment was conducted online in May 2016 on a sample of White, Black, Asian, and Hispanic respondents contracted through Qualtrics survey panels.Footnote 8 This sample leans Democratic, liberal, and relatively young. There is little evidence that experiments on convenience samples are less valid than nationally representative samples (Coppock and McClellan Reference Coppock and McClellan2019), and this sample consists of the kind of people likely to be confronted with a multiracial candidate, because the multiracial population leans Democratic (Davenport et al. Reference Davenport, Franco, Iyengar and Westwood2015). At least 200 participants per racial group were targeted for subgroup analysis (Orme Reference Orme2010, 65). After dropping multiracial respondents and those who did not provide permission to use their data, 190 White, 203 Black, 186 Hispanic/Latino, and 207 Asian or Pacific Islander (API) respondents remained, for a total sample size of 786.Footnote 9
To examine heterogeneity by linked fate and group identity (Harris and Findley Reference Harris and Findley2014; McConnaughy et al. Reference McConnaughy, White, Leal and Casellas2010), two measures of identity were asked pre-treatment: the common measure of racial linked fate (Sanchez and Vargas Reference Sanchez and Vargas2016) and the Identification with a Psychological Group Scale (IDPG; Mael and Tetrick Reference Mael and Tetrick1992), a measure of social identity that has been used in earlier work (Greene Reference Greene2004; Huddy, Mason, and Aarøe Reference Huddy, Mason and Aarøe2015).Footnote 10 Although other measures of social identity exist, such as closeness to a racial group, the IDPG is specifically based on social identity theory (Tajfel and Turner Reference Tajfel, Turner, Austin and Worchel1986) and is thus appropriate for this study.
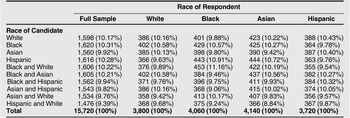
For the conjoint, respondents read a vignette about a congressional election for 10 pairs of candidates pitted against each other.Footnote 11 Candidate profiles were completely randomly generated and varied in race (Black, White, Asian, Hispanic, Black and White, Asian and White, Hispanic and White, Black and Asian, Asian and Hispanic, Black and Hispanic) and attributes correlated with race: gender (male, female), party (Democrat, Republican, Independent), ideology (liberal, moderate, conservative), and political experience (served in city council, served in the state legislature, served in Congress (Davenport Reference Davenport2016b; Lee Reference Lee2008; Sen and Wasow Reference Sen and Wasow2016; Sigelman et al. Reference Sigelman, Sigelman, Walkosz and Nitz1995). For example, candidates of color tend to be liberal and Democrats (Lee Reference Lee2008) and may have less political experience because of their general underrepresentation in political institutions. Women with interracial parentage are more likely to disclose multiracial backgrounds than men with interracial parentage (Davenport Reference Davenport2016b). Candidates of color, particularly Asian and Hispanic candidates, may also raise questions about nativity (Masuoka and Junn Reference Masuoka and Junn2013). All of these attributes are thus relevant to adequately capturing the effect of race on the outcome because they are directly related to race. Table 1 reports the distribution of each category of candidate race in the full sample, as well as across each racial group. The profiles are roughly evenly distributed throughout the entire sample and each racial group.
Distribution of Candidate Race Profiles by Race of Respondent

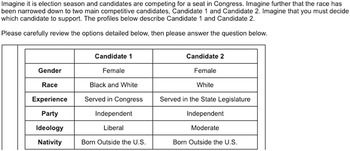
After reviewing the candidate profiles, respondents were asked, “Which candidate would you vote for?” and then they selected between Candidate 1 or Candidate 2. Figure 1 is an example of what respondents read about each candidate. Multiracial categorization is cued via the label of the candidate’s race.
Example of a Vignette

Features of this Design
A challenge faced by scholars studying race is articulating what exactly is race (Roth Reference Roth2016; Sen and Wasow Reference Sen and Wasow2016). Although the study could have only included labels for candidate race, absent all other information, by manipulating race perhaps we are also manipulating party (Lee Reference Lee2008; White, Laird, and Allen Reference White, Laird and Allen2014), nativity (Visalvanich Reference Visalvanich2017), or gender (Davenport Reference Davenport2016b). My study design provides this information in addition to race, so there is little question about these other attributes. As a result, the deck is stacked against finding effects of multiracial categorization.Footnote 12 If after including these attributes, multiracial categorization still has statistically significant effects on vote choice, the evidence for the argument will be stronger.Footnote 13
Findings
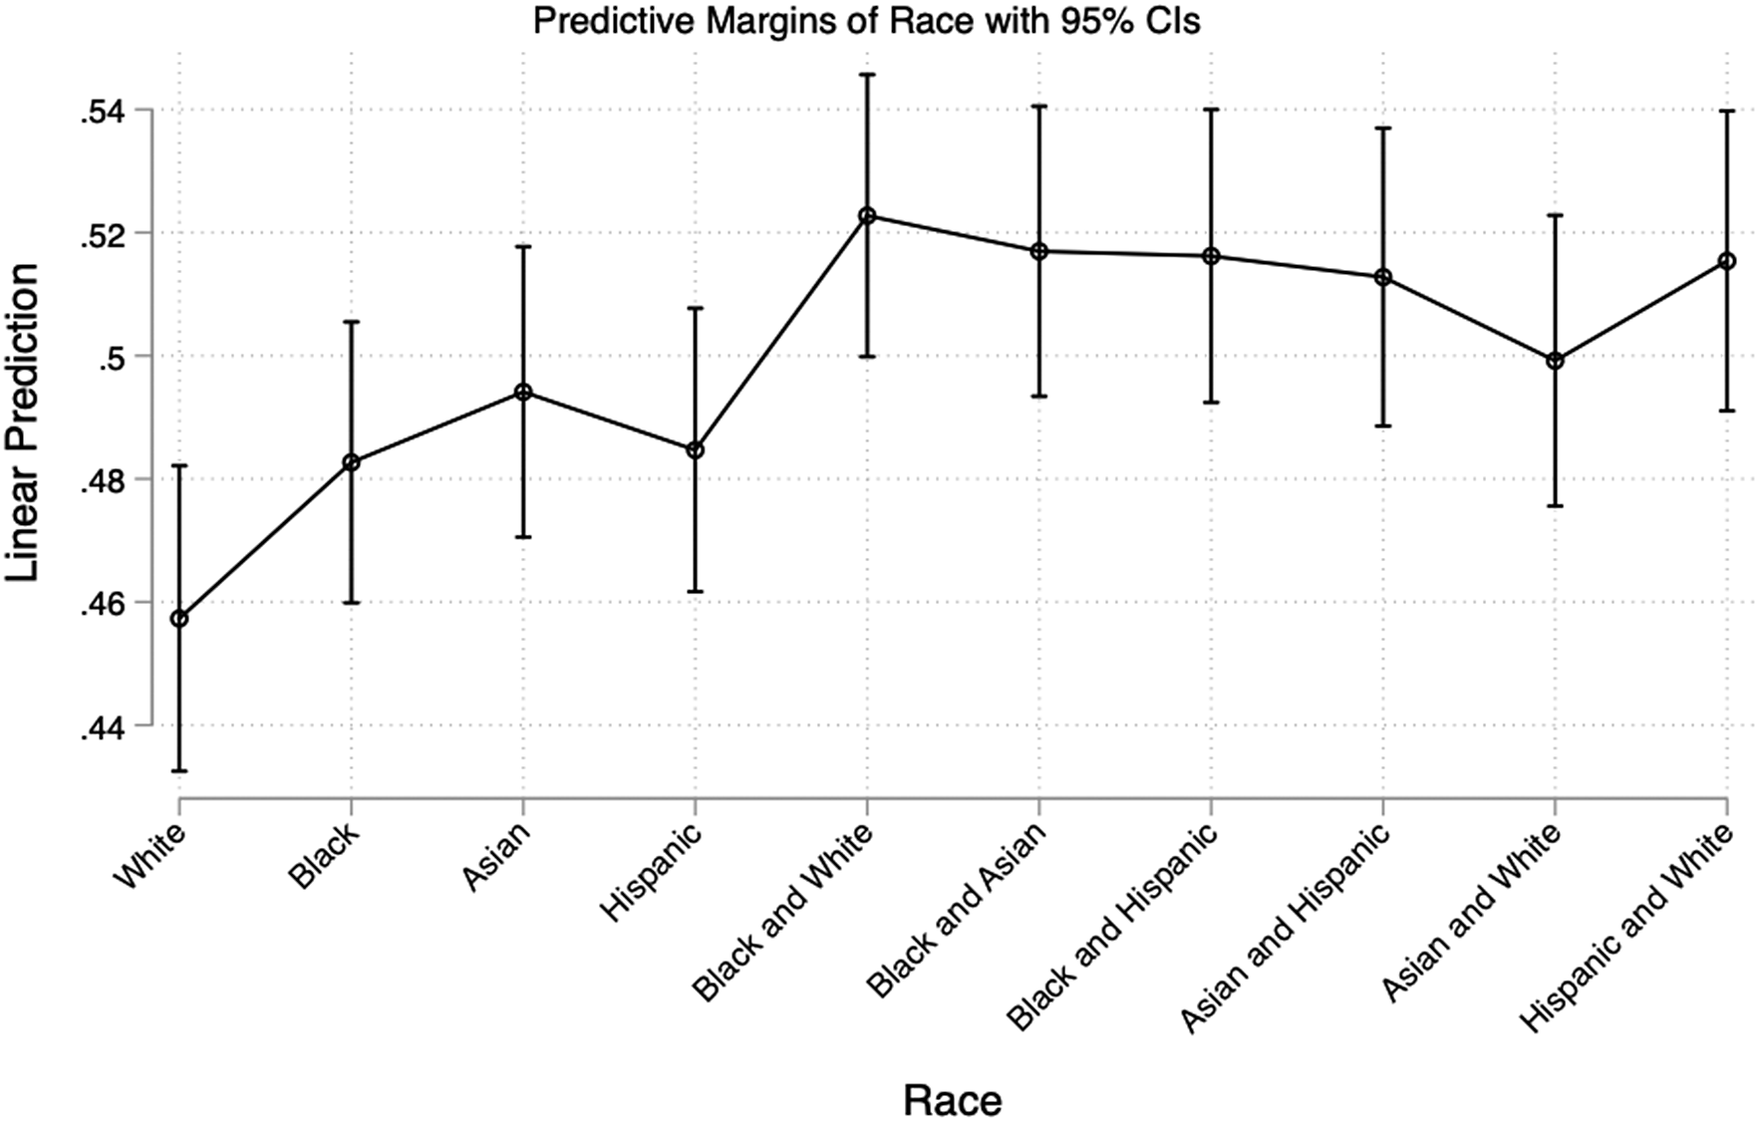
I report these findings according to recommendations from Leeper et al. (Reference Leeper, Hobolt and Tilley2020) and Hainmueller and colleagues (Reference Hainmueller, Hopkins and Yamamoto2014) using Stata I/C 15, with clustered robust standard errors by respondent. I begin with a description of the marginal means of candidate race in the entire sample and then as disaggregated by race of the voter.Footnote 14 Figure 2 reports the marginal means of candidate race from a linear regression model with all other candidate attributes, clustered standard errors by respondent, and a control variable for shared partisanship (Merolla, Sellers, and Lemi Reference Merolla, Sellers and Lemi2017). The bars indicate 95% confidence intervals. As Figure 2 shows, the marginal means of selection of any given candidate range from about 46% to about 52%. For multiracial candidates, the means hover between about 50% and 52%.
Marginal Means of Candidate Race
Notes: Bars are 95% confidence intervals, and results are clustered by respondent.

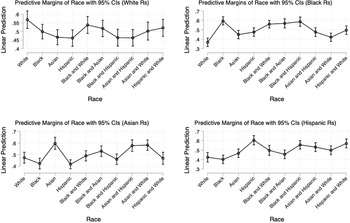
Figure 3 reports the marginal means of candidate race by race of respondent with 95% confidence intervals. These marginal means were calculated from separate regression models for each racial group. As the figure shows, the predicted margins of selection ebb and flow for each racial group according to whether the candidate shares a racial background with the respondent. For example, for Asian respondents, the marginal means of selecting any Asian candidate range from about 53% to 60%, but they dip to 42% for a monoracial Black candidate and 47% for a monoracial White candidate.
Marginal Means of Candidate Race by Race of Respondent
Notes: Bars are 95% confidence intervals, and results are clustered by respondent.

Testing H1 and H2
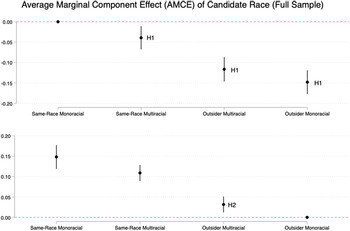
I tested H1 and H2 by collapsing the combinations of candidate race into same-race multiracials, same-race monoracials, outsider multiracials, and outsider monoracials based on the race of the voter. For example, for White voters, a White candidate is a same-race monoracial candidate; Black/White, Asian/White, and Hispanic/White candidates are same-race multiracial candidates; and all other candidates are either outsider monoracial or outsider multiracial candidates. Collapsing allows for easier interpretation of treatment effects by racial proximity (H1). The average marginal component effect (AMCE) of candidate race, or the average change in the probability of being selected given a candidate’s race, across the entire sample is reported in Figure 4 with 95% confidence intervals.Footnote 15 Estimates indicate the average change in percentage points that a candidate was more or less likely to be selected, relative to a base category. Confidence intervals that do not cross zero indicate statistically significant differences from the baseline category. These estimates are from a model that contains all the attributes, including an indicator variable for whether a voter shared partisanship with a candidate. The top panel tests H1, and the bottom panel tests H2.
Average Marginal Component Effect of Candidate Race (Full Sample)
Notes: Markers at 0 are the base categories.

In the top panel, I find support for H1. The baseline category is same-race monoracial candidates. Same-race multiracial candidates are about 4 percentage points less likely to be selected than same-race monoracial candidates (p =.007), with a downward trend for outsiders, supporting H1. Turning to H2 in the bottom panel, the baseline category is outsider monoracial candidates. Relative to an outsider monoracial, outsider multiracial candidates are more likely to be selected by about three percentage points (p =.001), supporting H2.
Testing H1 and H2 by Race of Voter
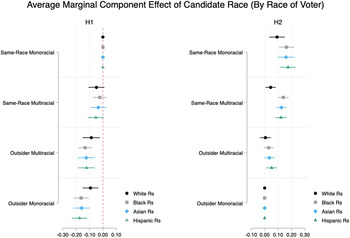
In Figure 5, I assess these findings across racial groups. Voters of different racial groups occupy different structural positions in American politics, such that the power of group identity itself depends on the sociopolitical significance of one’s own racial classification, which differs for each racial group (Masuoka and Junn Reference Masuoka and Junn2013). Due to variation in the historical construction of racial categories (i.e., the one-drop rule), different racial groups may respond to multiracial candidates differently, such that White voters are less amenable to multiracial candidates, for instance. Of course, disaggregating results in smaller sample sizes and the loss of power. Nonetheless, I find consistency in Figure 5. On the left side, relative to a same-race monoracial, same-race multiracial candidates are less preferred, and all other estimates are in the expected direction of H1. On the right side, relative to an outsider monoracial candidate, outsider multiracial candidates are more preferred, supporting H2. Figure 5 suggests that, generally, multiracial categorization works similarly across racial groups.Footnote 16
Average Change in Probability of Selection by Voter Racial Group
Notes: Markers at 0 are the base categories. Same-race monoracial is the base category on the left; Outsider monoracial is the base category on the right. Bars are 95% confidence intervals, and results are clustered by respondent.

Testing H1 and H2 by Race of Voter and Candidate Combinations
One of the findings in the literature on multiracial identity is that combinations matter, such that those with multiracial Black backgrounds experience race and identity in fundamentally distinct ways (Lee and Bean Reference Lee and Bean2010): multiracial-Black people are subjected to more discrimination than non-Black multiracial people (Pew Research Center 2015, 8). Because of the historical formation of racial categories and racial hierarchy in the United States (Masuoka and Junn Reference Masuoka and Junn2013), voters from different groups may favor each combination of multiracial candidates differently from their monoracial counterparts. I thus explore how specific multiracial candidates will be treated, with a general expectation that multiracial Black candidates will be treated differently than non-Black multiracial candidates.
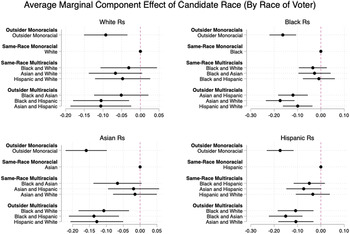
In Figure 6, I test H1, which is the difference between same-race monoracial candidates and all other candidates. It shows that relative to a same-race monoracial candidate, the estimates for all other candidates trend negative, supporting H1 across all groups of voters. Among Black respondents, the estimates for multiracial-Black candidates do not reach statistical significance, and the effect sizes for multiracial-Black candidates range from about one to three percentage points. By contrast, White, Asian, and Hispanic respondents reject specific same-race multiracial candidates. Relative to a White candidate, White respondents are marginally statistically significantly less likely to select an Asian/White candidate (−.07, p = .067). Relative to an Asian candidate, Asian respondents are marginally statistically significantly less likely to select a Black/Asian candidate (−.07, p = .066). Relative to a Hispanic candidate, Hispanic respondents are marginally statistically significantly less likely to select an Asian/Hispanic candidate (−.07, p = .053).
Average Change in Probability of Selection by Voter Racial Group and Multiracial Combinations of Candidates
Notes: Markers at 0 are the base categories. Bars are 95% confidence intervals, and results are clustered by respondent.

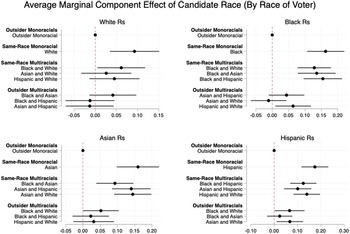
Figure 7 tests H2, which is the difference between outsider monoracials and outsider multiracials. Specific outsider multiracial candidates are more preferable than outsider monoracial candidates, offering contextual support for H2. Among White respondents, the only outsider multiracial candidate who trends with a positive estimate is the Black/Asian candidate (.04, p = .142). Among Black respondents, the Hispanic/White candidate is the only outsider multiracial who reaches statistical significance (.06, p = .022). Among Asian respondents, the only outsider multiracial with a positive and statistically significant estimate is the Black/White candidate (.05, p = .047). Among Hispanic respondents, the Black/White (.07, p =.043) and Asian/White (.07, p = .020) candidates are more likely to be selected than any outsider monoracial candidate.
Average Change in Probability of Selection by Voter Racial Group and Multiracial Combinations of Candidates
Notes: Markers at 0 are the base categories. Bars are 95% confidence intervals, and results are clustered by respondent.

Whereas Figure 6 showed that same-race multiracials have negative effects on vote choice relative to same-race monoracials, Figure 7 shows that, relative to outsider monoracials, same-race multiracials benefit from their racial proximity to voters (H1). Relative to a non-White monoracial candidate, the only multiracial candidate whom White respondents are more likely to select is the Black/White candidate (.06, p = .033). Black respondents are about 13 percentage points more likely to select a Black/White candidate than a non-Black monoracial candidate (p =. 000). Relative to an outsider monoracial candidate, Black and Asian respondents are statistically significantly more likely to support Black/Asian candidates by about 14 (p = .000) and 9 (p = .001) percentage points, respectively. Black and Hispanic respondents support Black/Hispanic candidates by about 15 (p = .000) and 12 (p = .000) percentage points, respectively. Asian and Hispanic respondents support Asian/Hispanic candidates by about 14 (p = .000) and 10 (p = .001) percentage points, respectively.
Figures 6 and 7 together suggest that, relative to outsider monoracial candidates, Black/White candidates are attractive to all voters and ideally positioned to build bridges between multiple groups—a potential Obama effect. Figure 7 also shows that same-race multiracial combinations matter when comparisons are made to outsider candidates. Relative to an outsider monoracial candidate, support for the Black/Asian candidate from Asian respondents is not as forthcoming as it is for the other multiracial-Asian candidates. Of the multiracial-Hispanic candidates, Hispanic respondents tend not to gravitate as much toward the Asian/Hispanic candidate. Thus, relative to an outsider monoracial candidate, any same-race multiracial candidate is preferred, but non-White respondents implement a hierarchy of preferences for multiracials that is consistent with their own place in the racial hierarchy (Lee and Bean Reference Lee and Bean2010; Masuoka and Junn Reference Masuoka and Junn2013). The Black/Hispanic candidate ranks highest among Black respondents, the Asian/White candidate ranks highest among Asian respondents, and the Hispanic/White candidate ranks highest among Hispanic respondents. These preferences may be in line with perceptions of commonality with the outside group that the multiracial candidate represents (Adida, Davenport, and McClendon Reference Adida, Davenport and McClendon2016; Ramakrishnan Reference Ramakrishnan2014; Wilkinson Reference Wilkinson2014).
Heterogeneity by Linked Fate and Group Identity
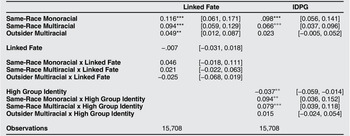
I now explore group heterogeneity by linked fate and group identity.Footnote 17 The left column in Table 2 shows the effect of being a same-race monoracial, same-race multiracial, or outsider multiracial does not depend on the presence of linked fate. Due to the small sample size, this finding should be treated with caution.
Exploring Heterogeneity by Linked Fate and Group Identity

Notes: 95% confidence intervals in brackets. * p < 0.05; ** p < 0.01; *** p < 0.001.
On the right column of Table 2, high identification with one’s racial group conditions the selection of same-race monoracial and same-race multiracial candidates, relative to an outsider monoracial. When candidates are same-race monoracial and voters strongly identify with their own group, voters are about 9 percentage points more likely to select those same-race monoracial candidates (p = .002). By contrast, voters are only about 8 percentage points more likely to select same-race multiracials (p = .000). A Wald test shows there is no statistically significant difference between voting for same-race monoracial candidates and same-race multiracial candidates among high-group identifiers (Prob > F = .607). Nonetheless, this suggests that, relative to an outsider monoracial candidate, multiracial identification impedes race as an efficient heuristic for assessing candidates on the basis of race, even when other information about their politics is provided.
Of course, other factors may matter. It is possible that by varying race, voters make inferences about the candidate’s qualifications (McConnaughy et al. Reference McConnaughy, White, Leal and Casellas2010), phenotype or attractiveness (Abrajano, Elmendorf, and Quinn Reference Abrajano, Elmendorf and Quinn2018; Ahuja, Ostermann, and Mehta Reference Ahuja, Ostermann and Mehta2016; Banducci et al. Reference Banducci, Karp, Thrasher and Rallings2008; Lawson et al. Reference Lawson, Lenz, Baker and Myers2010; Lerman, McCabe, and Sadin Reference Lerman, McCabe and Sadin2015; Pauker et al. Reference Pauker, Carpinella, Lick, Sanchez and Johnson2018; Terkildsen Reference Terkildsen1993), language ability (Monforti, Michelson, and Franco Reference Monforti, Michelson and Franco2013), fit with racial stereotypes (Bejarano Reference Bejarano2013), or even “Americanness” (Visalvanich Reference Visalvanich2017). Another explanation may be a belief that the candidate, by being multiracial, is generally more progressive than monoracial candidates (Davenport Reference Davenport2016a), though partisanship was built into this experiment. Multiple pathways may explain these results (Weller and Barnes Reference Weller and Barnes2016).
External Validity
Assessing external validity requires finding a scenario in which a multiracial candidate’s presentation was manipulated in the heat of an election. I use the case of Kamala Harris’s run against Loretta Sanchez for the US Senate in 2016 to further explore H1 and heterogeneity by group identity.
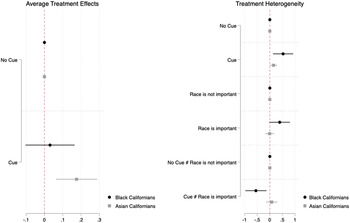
In 2016, the NAAS surveyed multiple racial groups around the country about politics. The data useful for this study are derived from questions that Black and Asian Californians were asked about who they supported for the US Senate election: Kamala Harris or Loretta Sanchez, both Democrats. Half the sample received no information about Harris’s and Sanchez’s backgrounds, whereas the other half received information about Harris as being “of Black and Asian American descent” and Sanchez being “of Latina descent.”Footnote 18 This survey took place during an election, and race is the only differentiating attribute between the two Democrats. Harris is known as a Black politician (Sullivan Reference Sullivan2019), and we may plausibly assume that, absent information that she is Asian, voters recognize her as Black. The structure of the questionnaire allows me to measure how Black and Asian Californians treat Harris when they learn she is Black and Asian, relative to an unspoken categorization as Black (H1). This scenario is not exactly the same as the conjoint study; however, these are the questions that are on the NAAS. Before being asked to indicate a choice for senator, all respondents were asked, “How important is being [RACE] to your identity?” and given the option to say extremely important to not important at all, as well as to decline to answer.Footnote 19
Figure 8 reports OLS models reflecting the average treatment effects (left) and treatment group interaction with the strength of identity (right). These models contain an indicator variable for shared partisanship. The dependent variable is 1 = selected Harris, 0 = selected Sanchez. Racial identity is coded so that 1 = respondent placed any importance on their race and 0 = else. On the left, relative to no cue, there is no statistically significant effect on Black Californians. Asian Californians are statistically significantly more likely to select Harris when she is presented as multiracial (.175, p = .002). On the right, Black Californians in the treated group who viewed their racial identities as important are statistically significantly less likely to select Harris relative to selecting Sanchez when Harris is cued as multiracial (−.552, p = .010). This result reflects the difference between Harris generally being viewed as a Black politician and Harris being framed as multiracial: it indicates that Black Californians with strong racial identities punish Harris when she is framed as multiracial. I argue that this is because the cue raises questions about Harris’s adherence to norms of group identity among those who say their racial identity is important to them. I do not find a statistically significant interaction among Asian Californians.
Testing H1 and the Heterogeneity in the 2016 NAAS
Notes: Dependent variable: 1 = Selected Harris, 0 = Selected Sanchez. Bars are 95% confidence intervals.

These findings suggest that categorizing Harris as multiracial, relative to her unspoken baseline categorization as Black, creates distance between Black voters and her (H1). Her identification as Black and Asian may do nothing for Asian Americans with strong identities, likely because there currently does not exist a strong, uniform Asian identity (Junn and Masuoka Reference Junn and Masuoka2008). Furthermore, this suggests that even someone as well known as Harris can be undermined by the mere association with two racial categories—even though she identifies as Black. These findings show why external atypical group categorization is arguably more important than a candidate’s self-identification or strategic self-presentation. Harris is widely known as a Black politician and positions herself as such (Sullivan Reference Sullivan2019), yet classifying her in two racial categories pushed Black voters with strong racial identities away.
Discussion and Conclusion
This study examined the effect of attribute-atypical candidates on vote choice among a diverse set of voters. I used multiracial candidates as a case of attribute atypicality to examine how monoracial White, Black, Asian, and Hispanic voters respond to their candidacies. I show that generally, voters prefer candidates of closer racial proximity (Harris Reference Harris2019), and multiracial candidates are penalized by this preference. Yet relative to outsider monoracial candidates, multiracial categorization has a positive effect on vote choice across groups. My analysis of national survey data suggests that multiracial categorization may weaken support from monoracial co-racial voters with strong racial identities.
This research makes several contributions to how we study representation and voter behavior. First, previous research has yet to uncover how voters from different racial groups respond to multiracial candidates of different combinations. This study indicates that multiracial categorization has systematic effects on voter behavior, and we can no longer exclude multiracial candidates from studies of representation and candidate evaluation. In close election races, multiracial categorization may make the difference between winning and losing. These findings suggest that incorporating multiracial candidates into models and studies of voter preferences for descriptive representatives offers a more accurate estimate of voter preferences. There are degrees of preferable descriptive representatives (Dovi Reference Dovi2002), and monoracial ones are the most preferred. Given voter preferences for monoracial candidates, scholars of democratic theory and representation may ask whether multiracial representatives should qualify as legitimate representatives of marginalized racial groups (Dovi Reference Dovi2002; Mansbridge Reference Mansbridge1999). Dovi (Reference Dovi2002) raises this question—this study demonstrates we must engage it.
Second, being a multiracial candidate does not yield the utility that one might expect. These issues are likely to be realized as the Democratic Party absorbs the multiracial population (Davenport et al. Reference Davenport, Franco, Iyengar and Westwood2015). This research raises questions for future work on whether various campaign strategies are available to multiracial candidates (Austin, Wright, and Middleton Reference Austin and Middleton2004; Collet Reference Collet2008; McIlwain and Caliendo Reference McIlwain and Caliendo2011; Perry Reference Perry1991). As Wamble and Laird (Reference Wamble and Laird2018, 12–14) show, Black candidates who use “post-racial rhetoric” incur gains from White voters, but multiracial people themselves are often treated as the epitome of “post-racial” America (Thornton Reference Thornton2009, 112–13). Given the tendency for multiracial women to self-identify with two categories (Davenport Reference Davenport2016b), whether multiracial women face specific constraints in appealing to their racial and gender constituents is also an open question (Holman, Schneider, and Pondel Reference Holman, Schneider and Pondel2015). This work raises questions about how a candidate’s race will matter for voter behavior as the electorate and pool of candidates become more diverse.
This study was about the “demand side” of candidate evaluation rather than the “supply side” (Carnes Reference Carnes2016; Juenke and Shah Reference Juenke and Shah2015). Candidates have many ways to approach race and identity (Collet Reference Collet2008; McIlwain and Caliendo Reference McIlwain and Caliendo2011), and multiracial candidates, such as Barack Obama and Kamala Harris, may identify as monoracial. Regardless of a candidate’s own identity, voters will racially classify candidates (Citrin, Levy, and Van Howeling Reference Citrin, Levy and Howeling2014; Sims Reference Sims2016). Much like early research on women candidates (Dolan and Lynch Reference Dolan and Lynch2014, 659), studying multiracial candidates is challenging because of their small numbers. However, the high rate at which politicians identify with nonsingular categories (Hardy-Fanta et al. Reference Hardy-Fanta, Lien, Pinderhughes and Sierra2013, 11) gives more reason to continue studying multiracial candidates. Future research should integrate photographs to communicate race and racial identity (Lemi Reference Lemi2019).
What should we make of this research for the future of US race relations? Media often use the multiracial population to mark the supposed progress of race relations in the United States (Squires Reference Squires2007; Thornton Reference Thornton2009). As we become more multiracial, race will cease to be relevant, so the common story goes. Scholars of multiracial identity have arrived at opposite conclusions: multiracial identity may be a symptom of growing inequalities in racial status despite increased diversity (Davenport Reference Davenport2016a, 64), which has been termed the diversity paradox (Lee and Bean Reference Lee and Bean2010). I contend that multiracial candidates occupy a paradoxical position. On the one hand, multiracial candidates appear to have an advantage over monoracial candidates, particularly Black/White candidates, for fostering coalitions. This suggests an enduring multiracial advantage harkening back to the advantages of lighter skin for Black Americans (Hochschild and Weaver Reference Hochschild and Weaver2007). Those multiracial candidates whose backgrounds are higher in the racial order (Bonilla-Silva Reference Bonilla-Silva2004; Masuoka and Junn Reference Masuoka and Junn2013)—or those who are less Black (Yancey Reference Yancey2003)—may be more electorally popular than Black candidates. On the other hand, some multiracial candidates are penalized by their own racial groups, who may prefer candidates whose backgrounds are more prototypical. Although the discourse on diversity focuses on intergroup diversity, I contend that increasing intragroup diversity may lead to more internal conflicts that erupt in the candidacies of multiracial politicians. Thus, identity boundaries within groups may harden and pose challenges to multiracial people with political ambition. As the growing multiracial population comes of age and runs for electoral office, multiracial candidates may encounter challenges to using their backgrounds strategically to secure their racial constituencies. Ultimately, those challenges may come from members of their own groups.
Supplementary Materials
To view supplementary material for this article, please visit http://dx.doi.org/10.1017/S1537592720001280.