





1. Introduction
More than 80% of the global trade is delivered by ships (UNCTAD, 2022). Subsequently, any disruptions in ports or shipping lanes has a significant impact on food, energy, medicine and key essential items, which will not reach those in need, as well as a major impact on the whole supply chain, survival of organisations, and the market in the form of increase prices for producers and consumers.
The Gulf and African regions have a wide range of desert land. Sandstorms frequently occur during the period of the year and subsequently affect most planned trip decisions, and the practical decision is to stay grounded until the sandstorm finishes or passes the affected area. This is because the sandstorm is usually riskier than fog, snow and high wind; specifically, because the sandstorm blocks the complete visibility and has a high air density that can manoeuvre any heavy objects because of the soil particles and dust contained in the air. Thus, on sandstorm occasions, the safest decision to be taken is to delay or reschedule any planned trip for safety purposes.
On March 23, 2021, a high-wind sandstorm occurred in north-eastern Egypt, affecting the busiest seaport in the world, the Suez Canal. On that day, 12 ships had navigated successfully through the canal while a high-wind sandstorm was affecting the vision clarity and ship navigation control. However, one of the giant ship containers in the world (Ever Given) was lined up in the queue to be the 13th ship to navigate through the canal sailing on its way to Rotterdam, Netherlands. Unfortunately, a few miles after entering the canal, the captainship lost control of the Ever Given ship, causing a diagonal wedge ship position that blocked the entire waterway of the Suez Canal, as illustrated in Figure 1. This blockage affected the maritime traffic for more than three weeks and it has been reported that the waiting ship numbers increased from 5 to 122 during that time (Harun-Al-Rashid et al., Reference Harun-Al-Rashid, Yang and Shin2022), which caused a significant global trade disruption.
Egyptian Suez Canal on the left, and Ever Given container ship grounded in the Suez Canal on the right (Forti et al., Reference Forti, d’Afflisio, Braca, Millefiori, Willett and Carniel2022).

Risk of grounding and collision is one of the major failure modes in the navigation of vessels (Bakdi et al., Reference Bakdi, Glad, Vanem and Engelhardtsen2020). Moreover, approximately 46% of collisions occurred in restricted waters; rivers or fairways (Fan et al., Reference Fan, Yang, Wang and Marsland2022). Hence the analysis in this paper provides a set of integrated tools that can help in analysing the causes of many similar accidents for both prevention and mitigation of risk.
This paper contains eight sections. Section 1 provides a general overview of the research background, sources of data and the scope of this paper. Section 2 provides a literature review related to grounding and risk assessment. Section 3 discuss the background of the case study of the Suez Canal grounding incident. Section 4 presents the hybrid modelling approach. Section 5 presents the fault tree analysis, reliability block diagram, cut set analysis and bowtie modelling. Section 6 presents discussion and lessons learnt. Section 7 presents strengths and limitations of the used techniques. Finally, Section 8 presents the conclusion and future research directions.
2. Literature review
Ship grounding is a marine accident that describes the impact of a ship on either the seabed or waterway side, where such a failure mode can impact the ship’s hull, and can compromise the structural integrity of the ship and its stability (Mazaheri et al., Reference Mazaheri, Montewka and Kujala2014). Based on the European Maritime Safety Agency (EMSA), the total number of reported ship accidents from 2014 to 2019 is 3,174. The accident classifications and rates were identified as grounding (12.9%), contact (15.3%) and collisions (26.2%) of total reported accidents. Hence, navigation failure is rated to be related to more than half of the accidents. It is crucial to investigate and identify the causal factor of ship accidents to prevent such events since the outcome’s impact on humans, the environment and the economy can be very serious, and it is essential to minimise the risk of the incident to reduce financial losses and negative impacts (Sakar et al., Reference Sakar, Toz, Buber and Koseoglu2021). With engineering reliability and technology development, the understanding of accidents becomes more crucial for both industry and academia, especially when the risk and hazard are of a cascading nature (Suppasri et al., Reference Suppasri, Maly, Kitamura, Pescaroli, Alexander and Imamura2021).
There is a wide range of literature related to risk assessment methods and techniques to analyse ship grounding. This includes the works of Mazaheri et al. (Reference Mazaheri, Montewka and Kujala2014) and Pedersen (Reference Pedersen2010). Pineau et al. (Reference Pineau, Conti, Le Sourne and Looten2022) present a finite-element-based numerical simulation tool to analyse damage due to ship grounding. A machine learning method for evaluating risk of ship grounding is presented by Zhang et al. (Reference Zhang, Kujala and Hirdaris2022), where the proposed method uses different data sources such as the Automatic Identification System (AIS) among others, and considers environmental conditions such as hydro-meteorological conditions and traffic conditions. Fault trees have been used in combination with Bayesian networks (BNs) in the work of Sakar et al. (Reference Sakar, Toz, Buber and Koseoglu2021), in combination with fuzzy logic (FL) in the work of Senol et al. (Reference Senol, Aydogdu, Sahin and Kilic2015), and in combination with human factors analysis and classification system (HFACS) in the work of Zhang et al. (Reference Zhang, Zhang, Goerlandt, Yan and Kujala2019).
The above literature tend to focus on using different methods for ship grounding in terms of risk assessment, but in a rather fragmented approach. The majority of the papers also tend to use either a single or a dual approach in performing the analysis. The focus of this paper is to promote the use of a ‘rich’ and ‘systematised’ modelling approach using a hybrid of integrated methods with the objective of systematising the identification process of safety barriers, and recommendations to prevent and mitigate against similar incidents. Nevertheless, such hybrid modelling still maintains simplicity in provision of a visual representation of causal factors and their relationships as well as safety barriers needed for provision of recommendations. In our choice of the hybrid model approach, we highlight the benefits from using each technique, which subsequently demonstrates its contribution to the overall learning outcome form using the proposed framework.
When modelling sources of uncertainty in risk, one can classify such sources into either aleatory (the intrinsic randomness nature of a phenomenon) or as epistemic (due to lack of knowledge) (Taarup-Esbensen, Reference Taarup-Esbensen2020). As will be shown later, we develop our classification of the causal factors of the chosen incident based on such categorisation.
Fault Tree Analysis (FTA) has drawn attention for both sectors by systematically structuring trees investigating the casual factors and their associated relationships. Another distinguished reliability technique is the Reliability Block Diagram (RBD), which expresses the graphical analysis technique to demonstrate the area of concerns of system connection components with their associated reliability of logical relation. Hence, the RBD signifies the system performance based on the effect of component failures. Each of the components is categorised into two boxes, which can be described as operating or failing. The RBD has two main classifications: parallel RBDs and series RBDs (Kim, Reference Kim2011). Additionally, employing a number of techniques to strengthen the investigation analysis has been proposed by using FTA to identify direct causes and their associated contributing factors to simulate the interaction with each other, and use it as input to the RBD analysis to measure the effectiveness and the improvement of the overall system reliability (Labib, Reference Labib2021).
Moreover, a bowtie framework is a broad analysis technique that tends to demonstrate FTA to an integrated analytical model to analyse the causal factors of the event at one side (the left-side) and the event consequence at the other side (right-side). The bowtie framework has proven its capability for analysing both retrospective and prospective incidents. Such an integrated structure of analysis will be able to signify system reliability improvement and prevent further reoccurrence of undesired incidents (Mokhtari et al., Reference Mokhtari, Ren, Roberts and Wang2011). The traditional trend in bowtie modelling is to have a Fault Tree Analysis (FTA) on the left-side, and an Event Tree Analysis (ETA) on the right-side of the bowtie model. The first objective of such modelling is to graphically present a structure that shows the causal factors that led to the incident on the left-side, the incident itself in the middle (knot of the bowtie) and the consequences at the right-side. The second objective is to map safety barriers for prevention on the left-side, and mitigation on the right-side of the model.
Based on the literature review above, it is crucial to incorporate more than one reliability technique to investigate and analyse a recent or previous incident to structure a comprehensive model analysis. Therefore, a hybrid technique will be structured to investigate the recent incident (Suez Canal Incident) that occurred on March 23, 2021.
3. Problem context: the Suez Canal and the Ever Given grounding incident
The Egyptian Suez Canal operation started in 1869. The Suez Canal’s dimensions are 120 miles (193 km) long, 205 metres wide and 28 metres in depth. In addition, the Suez Canal connects the Mediterranean Sea to the Red Sea with a crucial trading waterway between Asia, Africa and Europe, as illustrated in Figure 1. In 2020, the canal usage estimated capacity was averaged at approximately 19,000 ships per year with a total tonnage of 1.7 billion tonnes. The canal controls up to 13% of the world’s maritime trade, with approximately 2 million barrels of oil routed through it each day accounting for 10% of oil trade that passes through the channel (Li, Reference Li2022; Lloyd’s, 2021).
In 2014, the Egyptian authority launched a new $5 billion project to expand the Suez Canal to create a parallel channel and the expansion was fully completed in 2015. The canal’s estimated traffic was averaged around 49 ships per day before the expansion project. The Suez Canal was expected to accommodate 97 ships per day following the completion of the expansion project. In addition, the vessel transit and waiting times have been reduced. For instance, the southbound transit time has been reduced from 18 to 11 hours. Furthermore, the vessel waiting time has also been reduced from 11 to 3 hours (Rusinov et al., Reference Rusinov, Gavrilova and Sergeev2021).
The Suez Canal blockage is considered one of the recent incidents that has put the resilience of the global economy to the test, together with incidents such as the 2010 Gulf of Mexico oil spill disaster, the 2011 Great East Japan tsunami and Fukushima nuclear power disaster, Covid-19 pandemic, and the Russian-Ukraine conflict (Di Paola et al., Reference Di Paola, Cosimato and Vona2023).
The final report about the Ever Given’s Suez canal grounding incident has concluded that the ‘root cause’ of this case of grounding can be attributed to a ‘loss of manoeuvrability of the ship’ caused by wind speed, and the hydrodynamic effects of squat and bank effects that were amplified by excessive speed, which was recorded at 12–13 knots versus the 8 knots limit. These bank effects can be categorised into ‘bank suction’, which occurs when the stern is drawn towards the bank due to a low-pressure, fast-flowing water zone, and ‘bank cushion’, which is the high-pressure, water-cushioning effect that pushes the bow away from the bank. Squat effect is a hydrodynamic phenomenon where a moving ship in shallow or confined water experiences increased draft and change in trim, causing it to sink deeper and closer to the seabed. The damage cost was estimated at approximately $US1 billion, making it one of the most expensive ship damages claim in recent history (Wood, Reference Wood2023). It is also claimed, according to a Lloyd’s List Intelligence data (Lloyd’s, 2021), that almost US$10 billion worth of global trade had been held for the six-day blockage, which caused major disruption to the global supply chain.
The named cargo ship (Ever Given) was built by a Japanese shipbuilder, Imabari Shipbuilding, in 2018. Currently, the vessel is sailing under the flag of Panama and the vessel is considered one of the 10th largest ships globally. The ship’s container specifications are 400 metres long, 60 metres wide, speed 22.8 knots and ability to carry 18,000 containers, with a gross tonnage of 220,000 (Wood, Reference Wood2023; Li, Reference Li2022). The ship accommodates up to 25 sailing crew, the majority from India. It is considered as a major hazard type of ship according to the terminology set by the AIS data ‘cargo ship (HAZ-A)’ (IMO, 2021).
At the time of writing this work in August, 2024, the Egyptian Suez Canal incident is still under investigation by the International Maritime Organization (IMO). A report by the Panama Maritime authority has been published in March, 2021 (Panama, 2021). In addition, an independent investigation is also ongoing by Suez Canal Authority (SCA) since the incident occurred in late March, 2021. Unfortunately, various information is still unavailable until this moment. Therefore, a secondary source of information collection will be used through a widely proven research method to structure the incident.
On March 23, 2021, at 5:40 UTC, Ever Given was sailing northbound through the Suez Canal, heading on its way to Rotterdam. The weather condition at the sailing time was not ideal due to a severe sandstorm with high-speed wind estimated at approximately 40 knots (Forti et al., Reference Forti, d’Afflisio, Braca, Millefiori, Willett and Carniel2022). According to the Suez Canal Authority (SCA), in this kind of weather condition, the SCA usually leaves the final decision to the captainship to decide to navigate the ship or wait until the weather condition becomes ideal. Ever Given was queued at number 13 on that date, where 12 vessels were ahead to be sailed before Ever Given, and the 12 ships decided to float and made it through the canal, and then headed to the Mediterranean Sea.
Initially, the Ever Given decided to sail through the Suez Canal despite the severe weather condition. The SCA usually assign an experienced Egyptian pilot to support any ship entering the canal, and provide instruction and advice to the captainship while sailing through the canal. However, the pilot will not have complete control to steer the ship. Therefore, the ship should always be fully steered and managed by the captainship.
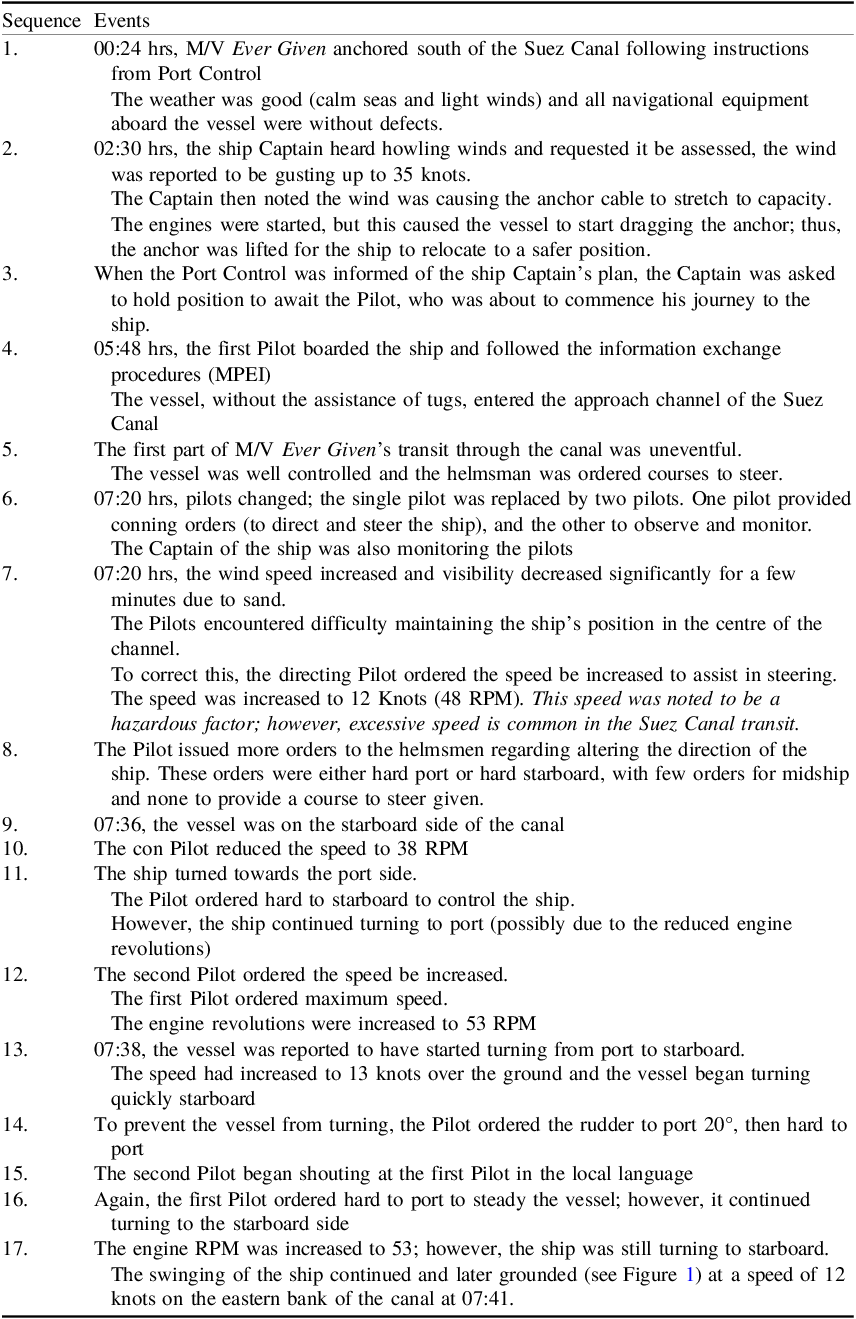
Furthermore, once the ship entered the narrow one side canal, the sandstorm with a high-wind speed reached 40 knots (74 km per hour) caused the vessel to swing back and forth. Table 1 provides an outline of the sequence of events that led to the blockage of the Suez Canal due to the grounding of M/V Ever Given. Note that the canal’s recommended speed is 8 knots.
Sequence of events leading to M/V Ever Given’s Suez Canal Disaster.

Table 1. Long description
A table outlining the sequence of events during M/V Ever Givenʼs transit through the Suez Canal. The table has two columns: Sequence and Events. It contains 17 rows detailing the timeline and specific events from 00:24 hrs to 07:41 hrs. Row 1: Sequence 1, Events 00:24 hrs, M/V Ever Given anchored south of the Suez Canal following instructions from Port Control. The weather was good (calm seas and light winds) and all navigational equipment aboard the vessel were without defects. Row 2: Sequence 2, Events 02:30 hrs, the ship Captain heard howling winds and requested it be assessed, the wind was reported to be gusting up to 35 knots. The Captain then noted the wind was causing the anchor cable to stretch to capacity. The engines were started, but this caused the vessel to start dragging the anchor; thus, the anchor was lifted for the ship to relocate to a safer position. Row 3: Sequence 3, Events When the Port Control was informed of the ship Captain’s plan, the Captain was asked to hold position to await the Pilot, who was about to commence his journey to the ship. Row 4: Sequence 4, Events 05:48 hrs, the first Pilot boarded the ship and followed the information exchange procedures (MPEI). The vessel, without the assistance of tugs, entered the approach channel of the Suez Canal. Row 5: Sequence 5, Events The first part of M/V Ever Given’s transit through the canal was uneventful. The vessel was well controlled and the helmsman was ordered courses to steer. Row 6: Sequence 6, Events 07:20 hrs, pilots changed; the single pilot was replaced by two pilots. One pilot provided conning orders (to direct and steer the ship), and the other to observe and monitor. The Captain of the ship was also monitoring the pilots. Row 7: Sequence 7, Events 07:20 hrs, the wind speed increased and visibility decreased significantly for a few minutes due to sand. The Pilots encountered difficulty maintaining the ship’s position in the centre of the channel. To correct this, the directing Pilot ordered the speed be increased to assist in steering. The speed was increased to 12 Knots (48 RPM). This speed was noted to be a hazardous factor; however, excessive speed is common in the Suez Canal transit. Row 8: Sequence 8, Events The Pilot issued more orders to the helmsmen regarding altering the direction of the ship. These orders were either hard port or hard starboard, with few orders for midship and none to provide a course to steer given. Row 9: Sequence 9, Events 07:36, the vessel was on the starboard side of the canal. Row 10: Sequence 10, Events The con Pilot reduced the speed to 38 RPM. Row 11: Sequence 11, Events The ship turned towards the port side. The Pilot ordered hard to starboard to control the ship. However, the ship continued turning to port (possibly due to the reduced engine revolutions). Row 12: Sequence 12, Events The second Pilot ordered the speed be increased. The first Pilot ordered maximum speed. The engine revolutions were increased to 53 RPM. Row 13: Sequence 13, Events 07:38, the vessel was reported to have started turning from port to starboard. The speed had increased to 13 knots over the ground and the vessel began turning quickly starboard. Row 14: Sequence 14, Events To prevent the vessel from turning, the Pilot ordered the rudder to port 20°, then hard to port. Row 15: Sequence 15, Events The second Pilot began shouting at the first Pilot in the local language. Row 16: Sequence 16, Events Again, the first Pilot ordered hard to port to steady the vessel; however, it continued turning to the starboard side. Row 17: Sequence 17, Events The engine RPM was increased to 53; however, the ship was still turning to starboard. The swinging of the ship continued and later grounded at a speed of 12 knots on the eastern bank of the canal at 07:41.
Note: Authors-generated table, adapted from Panama Maritime Authority, 2021.
Consequently, a diagonally 40° ship position in the middle of the canal caused a total closure of the southern waterway of the Suez Canal. Subsequently, the blockage caused a traffic jam for more than 360 ships and held more than $9.6 billion of maritime global trade for seven days (Forti et al., Reference Forti, d’Afflisio, Braca, Millefiori, Willett and Carniel2022).
On March 24, the Egyptian SCA announced a deceleration of emergency due to Suez Canal blockage and suspension of navigation through the canal. Moreover, all the ships were diverted to the old canal channel.
On March 25, an operation centre was framed by the SCA to perform an immediate risk assessment to re-float the Ever Given ship and clear the water pathway of the Suez Canal. The SCA operational rescue plan was consistent with three main options:
first, dredging and digging at the bow of the ship;
second, tugboats pull and push the ship;
third, offload the ship containers to lighten the vessel.
According to the SCA, the ship owners hired a Dutch firm called Smit, considered to be one of the preeminent rescue ship firms in the world. Nevertheless, the rescue operation was managed by the SCA and there was not much involvement by Smit in the ship rescue operation.
The SCA tend to avoid as much as they can the third option since it is a highly risky and extremely expensive approach, and all the cranes and equipment are not available at the site. In addition, such an approach might take weeks or months to complete the offload of the ship containers Therefore, the SCA focused on the first and the second options.
On March 25–26, the SCA worked simultaneously on the first and the second options and continued dredging, digging, and tugboats pull and push activities, which resulted in freeing the ship’s back by 4 metres from the bank. Moreover, on March 27–28, significant progress was accomplished by the SCA where the gap between the bank and the ship’s back was increased by 102 metres. However, the bow of the ship was still wedged.
On March 29, the SCA decided to use 15 tugboats to pull and push the ship with the association of the high tidal peaks that occurred due to the supermoon on that day, which contributed to increasing the water level in the canal. Furthermore, at 13:30 UTC, Ever Given was completely freed from both sides and the Suez Canal resumed its normal operation.
3.1. Consequences of Suez Canal incident
Suez Canal blockage: the seven days of blockage and ten days of canal maintenance restoration was claimed to cost more than $100 million.
Vessel disruption: more than 360 vessels were delayed in or out of the canal due to the blockage, which held up more than $15–17 billion of global maritime trade for seven days.
Vessel renavigation: due to the canal blockage, several vessels were diverted to use another longer channel through the Cape of Good Hope, which was estimated to be an approximately fifteen days delay for each journey.
Salvage reward: the Egyptian SCA claimed a settlement of $1 Billion for a salvage reward. However, the compensation was later reduced to $550 million.
Death: in June, 2021, the SCA stated that one person had died during the six-day salvage operation (Ankel, Reference Ankel2021).
4. Hybrid modelling approach
When proposing a hybrid approach to modeling, the following important question can be posed. Why is the hybrid model required? Incidents and disasters become more complicated each day, which might be due to the system integration with various advanced designs and technologies. Such complexity has been framed as coupling by Perrow (Reference Perrow1981) and envirotechnical by Pritchard (Reference Pritchard2012). Therefore, a standalone technique might not achieve all the requirements to identify the primary issue of the incident or the disaster since each technique has its capabilities and limitations to reach a particular investigation analysis. In addition, multiple approaches in modelling provide multiple world views that can minimise (or debias) unintentional cognitive biases in risk (Montibeller and von Winterfeldt, Reference Montibeller and von Winterfeldt2015), which in turn improves our understanding of the situation.
A hybrid modelling approach provides a wide range of terminology to support the investigation team in analysing and reviewing the event from different angles. For instance, many things can happen during the incident due to a specific factor that can be identified through a particular technique of analysis, which makes this factor the main root cause for the incident to occur. However, in terms of causality analysis, in a hybrid modelling approach, the primary factor might not necessarily be the main factor that led to the incident, as it can reveal through further analysis two or three sub-factors to the primary factor, and these can then be identified as the real root cause of the incident. In addition, a hybrid approach to modelling provides a better mental representation of disasters. This is due to the fact that using just one technique for analysis has its inherent limitations that, by default, exist in every tool used. This is particularly evident in analytical tools such as FTA, RBD and FMECA, where they have limitations due to the existence of linear causality and inability to deal with nonlinear relationships such as feedback (Leveson, Reference Leveson2004). In addition, using a single model such as FTA, for example, with its limitations, may lead into trying to manipulate the problem in hand to ‘fit it’ to the method instead of vice versa. Subsequently, relying on just one model for analysis may distract people who are carrying out the accident investigation, as they attempt to fit the accident to the model (Kletz, Reference Kletz2007).
Moreover, modelling a case study by using just one technique can lead to a simplified unrealistic version of the incident or the situation of the ‘narrative fallacy’, a term introduced by Taleb (Reference Taleb2010) to describe how flawed stories of the past shape our views of the things around us. Such flawed stories arise from the narrative fallacies due to our continuous attempt to make sense of the world, and that according to Taleb, we humans constantly fool ourselves by constructing biased accounts of the past and believing they are true. According to Kahneman (Reference Kahneman2012), such a misleading assumption that one has fully understood the past, using one technique to simplify and model the problem, can feed into a further illusion that everything is simple, predictable and coherent, and that one can predict and control the future, and in Kahneman’s view, this need for a false reassurance message has been observed in many business books that are designed to satisfy this need. Therefore, it is argued that a hybrid approach to modelling, as presented in this paper, can potentially overcome such criticism, as different tools have different types of limitations, and the use of different tools in an integrated way provides more richness to the modelling process. This is also evident from previous works (Labib and Read, Reference Labib and Read2013; Labib and Read, Reference Labib and Read2015; Stephen and Labib, Reference Stephen and Labib2018; Bendiksby and Labib, Reference Bendiksby and Labib2023).
5. FTA and RBD for Suez Canal incident
A comprehensive analysis has been conducted using the FTA technique to analyse, review and identify the main causal factor for the Suez Canal blockage caused by a wedge-grounded Ever Given ship. In Figure 2, FTA of Suez Canal blockage shows two primary causal factors, which are Loss of Ship Control and Ship Block Canal. Both casual factors have been contributed simultaneously to the canal blockage. Hence, an AND gate has been linked to the FTA.
FTA analysis of Suez Canal Incident.

Notice that these two broad factors share similarity with the categorisation of causal factors of risk, as proposed by Taarup-Esbensen (Reference Taarup-Esbensen2020) as either based on the intrinsic randomness nature of the phenomenon (aleatory) or due to lack of knowledge (epistemic). In our case, loss of ship control was mainly due to bad weather conditions – there was a high-wind sandstorm that was estimated at approximately 40 knots and the pilot lost control of ship, whereas the ship blocking the canal was due to either ship mechanical failure or ship grounding, which is due to ship collision with a side of the canal and not considering the impact of winds on the vessel.
Two intermediate events were identified showing that the loss of ship control was contributed by bad weather conditions and pilot loss of control of ship. Hence, an AND gate have been linked to these two factors. Moreover, the pilot loss of control of the ship was caused by poor decision making, incompetence to operate vessel and the captain did not maintain control. Thus, an AND gate has also been linked to these three factors.
In addition, the poor decision making can be attributed to either not consulting with the captain, or not being trained for such a poor weather situation and such a large ship. The incompetence to operate the vessel was again either due to not being trained for this duty or it not being the pilot’s role, as the pilot decided, in these conditions, to accelerate the speed of the vessel in such a narrow canal and high-wind conditions. Additionally, the captain did not maintain control due to either a poor understanding of the role or poor communication. Thus, an OR gate has been assigned to those three events.
Finally, the ship grounding was due to the ship colliding with the side of the canal and not considering the impact of winds on the vessel (hence, an AND gate between them). The height of the cargo of such a large stack of containers caused the vessel to behave like a ship with a sail against the wind, which affected the full control of the ship.
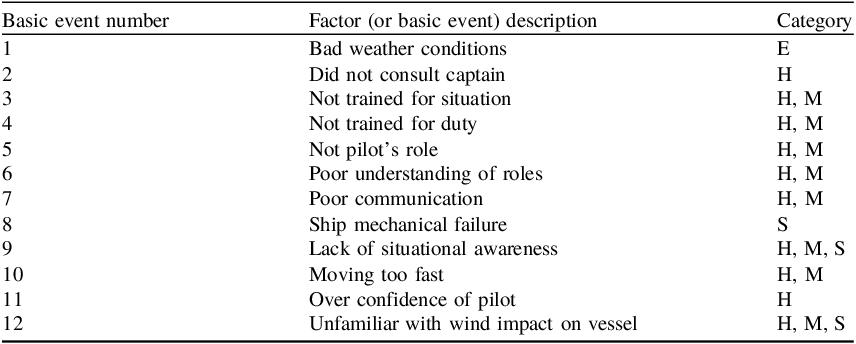
The basic events (leaves of the tree) are at the bottom level of the FTA and are twelve factors in total. These factors are of different types and can be grouped into different categories using those used by Chen et al. (Reference Chen, Di, Shi, Shu, Wan, Song and Zhang2020) as Management (M), Environmental (E), Human (H) and Ship (S) factors. These factors may be overlapped and complicated, and the intention of the FTA is to simplify complexity and to focus on the most significant factors.
More specifically, management factors (M) are primarily reflected in the SCA of management of ship companies and captains, and their own staff such as tugboat pilots, and related safety procedures and protocols. Environmental factors (E) are mainly related to natural weather and sea conditions, such as storm, and visibility. Human factors (H) are mainly related to competence, attitude and communication skills. Ship factors (S) are mainly attributed to its structure, size and control equipment on board, for example, speed limits in certain conditions. Table 2 shows categorisation of basic events into Environmental (E)-, Human (H)-, Management (M)- or Ship (S)-related factors
Categorisation of basic event factors.

Table 2. Long description
A table categorizing basic event factors into different categories. The table has three columns: Basic event number, Factor (or basic event) description, and Category. It contains 12 rows. Row 1: Basic event number 1, Factor description Bad weather conditions, Category E. Row 2: Basic event number 2, Factor description Did not consult captain, Category H. Row 3: Basic event number 3, Factor description Not trained for situation, Category H, M. Row 4: Basic event number 4, Factor description Not trained for duty, Category H, M. Row 5: Basic event number 5, Factor description Not pilotʼs role, Category H, M. Row 6: Basic event number 6, Factor description Poor understanding of roles, Category H, M. Row 7: Basic event number 7, Factor description Poor communication, Category H, M. Row 8: Basic event number 8, Factor description Ship mechanical failure, Category S. Row 9: Basic event number 9, Factor description Lack of situational awareness, Category H, M, S. Row 10: Basic event number 10, Factor description Moving too fast, Category H, M. Row 11: Basic event number 11, Factor description Over confidence of pilot, Category H. Row 12: Basic event number 12, Factor description Unfamiliar with wind impact on vessel, Category H, M, S.
5.1. Sequence of events and the FTA
The Suez Canal shipping disaster of March 23, 2021 arose due to both the blockage of the Suez Canal and the loss of control of the ship. Had only one of these two events taken place, the disaster may not have been of the prescribed magnitude; thus, the use of the AND gate at the top of the FTA (Figure 2).
The loss of the ship’s control based on the Panama Maritime Authority et al. (2021) was due to both the poor weather conditions and the Pilots concurrently losing control of the vessel, thus the AND gate connected to basic event 1. Further analysis of the Pilots losing control of the vessel revealed that it was due to the simultaneous poor decision making, the Pilots’ incompetence to operate the vessel and the Captain not maintaining control of the vessel. Had any of these factors not taken place, the total loss of the ship’s control may have been circumvented, preventing the top event; thus, the AND gate connecting these three factors in the FTA. Lastly, poor decision making was attributed to the Pilots not consulting the Captain or not being trained for the situation they were in. The incompetence to operate the vessel factor was associated with the Pilot not being trained for that function and operating the vessel not being the Pilot’s role. Then, the Captain not maintaining the control of the vessel was due to poor understanding of the roles by the Captain and poor communication. Basic events 2 to 7 were all connected using OR gates as the occurrence of any one of these events could have led to escalation up the tree, increasing the likelihood of the top event.
The vessel blocking the Suez Canal could have occurred due to either a mechanical failure or a ship grounding (OR gate), and as it is known to have been caused by the Ever Given grounding, the mechanical failure was not analysed further. The grounding occurred due to both the ship colliding with the side of the canal and the Pilots not considering the impact of the winds on the vessel. Since both of these events needed to occur for the ship to ground, an AND gate was used. The ship’s collision was assessed to be due to a lack of situational awareness and the vessel moving too fast, while not considering the wind’s impact on the vessel was attributed to overconfidence of the pilot and unfamiliarity with the impact the wind has on the vessel. Both of these basic events (9 and 10, and 11 and 12) were connected using AND gates as both of them needed to occur simultaneously to escalate up the chain of events.
Though these events are numbered chronologically, many of these events were concurrent, but they were presented in this manner to offer logic to the reader and to organise the analysis.
After carrying out the Suez Canal incident FTA, the Reliability Block Diagram (RBD) is a crucial technique to be used to assess the reliability of the system. The RBD technique uses the basic event generated from the FTA. Each AND gate indicates a parallel structure, and each OR gate indicates a series structure. There are other rules (tips) that can aid in mapping FTA models to their equivalent RBD and the reader may refer to previous reports for more details (Labib, Reference Labib2014; Labib, Reference Labib2015). Such mapping of the FTA to an RBD is important as it shows the overall system and the interrelationships among different factors. The configuration of the RBD highlights areas of concern (vulnerability) in the overall system, which can subsequently lead to the determination of appropriate levels of safety barriers to prevent and mitigate the risk. It can also present a visual structure of the ‘path’ of the failure scenarios, or cut sets, which will be described later. The main advantage of such an approach is that it helps to visualise and understand the relationships among causal factors that led to the incident.
The RBD can be derived from the FTA. In our framework, the FTA organises failure logic, whereas the RBD represents system success paths. An OR gate in the FTA maps to components in series in the RBD (a single failure breaks the success path), while an AND gate maps to parallel elements (redundancy must be exhausted for system failure). When data are available, the reliability of a series path is
 $${R_{sys}} = \mathop \prod \limits_i {R_{i}}$$
and of a parallel path is
 $${R_{sys}} = 1 - \mathop \prod \nolimits_i \left( {1 - {R_i}} \right)$$
This mapping clarifies where single-point vulnerabilities exist (long series stretches) and where added redundancy or barriers would be most effective.
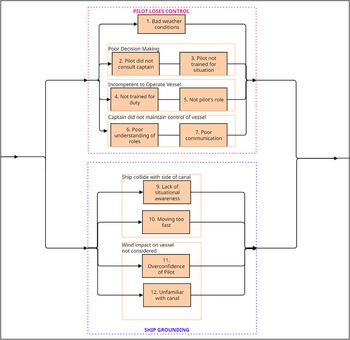
The RBD structured for the FTA Suez Canal incident in Figure 3 shows a system vulnerability due to the bad weather condition (item 1), poor decision making (items 2 and 3), incompetence to operate a vessel (items 4 and 5) and captain did not maintain control of the ship (items 6 and 7). In addition, the ship grounding was caused by many factors that occurred simultaneously (items 9–12). To increase system reliability, one can: (i) reduce the probability of basic events through training, procedures and technology; and/or (ii) introduce effective safety barriers or redundancies that convert strictly series paths into parallel/backup configurations.
RBD analysis of the Suez Canal Incident.

This shows the importance of RBD; although it has the same information as in the FTA, the RBD shows the relationships between various factors that caused the accident in a clear visual representation. If one compares the RBD with the Swiss Cheese Model (SCM), which basically illustrates layers of defense like slices of Swiss cheese and with holes in each slice representing weaknesses or failures, where when a set of holes align, this resembles an accident trajectory that passes through all defences. However, the SCM, does not clearly show the nature of the holes and their exact position in the system. In contrast, the RBD shows the various vulnerabilities in the system in a more accurate representation. Obviously, this can be more accurately determined if the data are available about the probability of each contributing event, which is unfortunately lacking in the current case study. In addition, when trying to quantify the probability of some qualitative factors such as, for example, ‘lack of training’ or ‘lack of situational awareness’, it is not feasible to obtain quantified figures for probabilities for such contributing factors. Hence, in our context, we propose the use of both FTA and RBD as a method for risk analysis, rather than for risk assessment.
Hence, it is important to increase safety barriers that can mitigate against such vital combinations of factors. The subject of the next section will specifically address safety barriers through the incorporation of bowtie modelling.
5.2. Bowtie model of Suez Canal incident
The bowtie methodology is an analysis technique, named after its shape, and this method identifies the factors that could lead to the high-risk event (Labib, Reference Labib2021). In this assessment, the Suez Canal incident will be placed at the centre of the bowtie diagram knot, which is also presented as the top event of the FTA. The structure model of the bowtie consists of two sides; the first left side of the model is to prevent the threat by constructing safety barriers, as a preventative strategy. However, the second right side of the model is the protective (can also be called mitigation or corrective) approach by controlling and mitigating the consequences of the high-risk events by creating new or additional safety barriers.
The technical logic of the bowtie model is to start with a fault tree analysis on the left side, concentrate on the causes that lead to the top event and focus on how to prevent it. Then, the right side of the model is constructed around the Event Tree Analysis (ETA) and deep focus on the consequences that occur due to the FTA top event to minimise any further escalation as a result of the top event (Labib, Reference Labib2021).
For example, Figure 4 shows the Suez Canal Incident in an integrated model of FTA incorporated in the left side of the bowtie and Figure 5 shows the full bowtie model. The left side of the bowtie model, as illustrated in Figure 4, shows the boxes where the concentration is on the causal factor’s prevention as a proactive approach, and this could be achieved through the grey safety barriers. In this case, the boxes of the Suez Canal indecent that led to the top event are insufficient weather conditions, procedure failure, lack of situational and navigation failure, and the prevention safety barriers.
Suez Canal Incident in an Integral model of FTA incorporated in the bowtie.

Bowtie model of Ever Given ship grounding in the Suez Canal Incident.

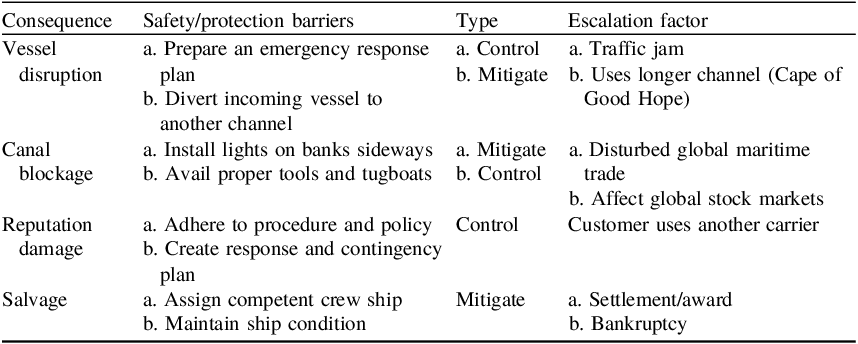
On the opposite right side are the boxes that represent the consequences that occur after the top event of the FTA: vessel disruption, canal blockage, reputation damage and salvage. Hence, barriers here are configured to act in a reactive approach to mitigate against the consequence of the hazard.
A question may arise about how the sequence of time is depicted in such modelling techniques. Although the FTA is a logic-based model, where the sequence of time is normally not captured in such analysis, one is able to capture time in terms of causality. Since causality based on the concept of cause and effect implies that a cause happens before an effect, if A causes B, then A happens before B. Then, one can say that if A AND B cause C, then both A and B happen before C. Therefore, the more we go down (vertically) in an FTA, the more we go back in time. However, when it comes to Bowtie modelling, the FTA is represented side-ways, as shown in Figure 4. Hence, time flows from left to right and the same logic can apply on the consequence side of the bowtie model. Such conceptual modelling helps to characterise ‘resilience’, which is about the ability to bounce-back after major disturbance. Such linking of bowtie and resilience modelling has been proposed by Labib (Reference Labib2021), and applied to the Covid-19 pandemic.
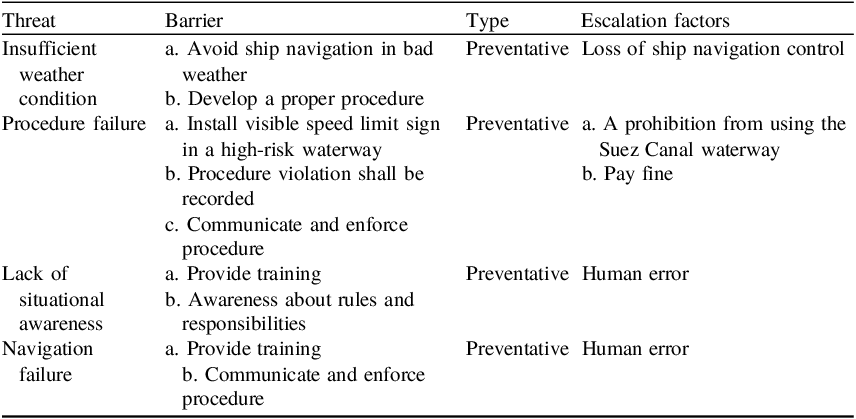
To prevent such an incident from reoccurring, sets of safety barriers have been created for each casual factor, as shown in Tables 3 and 4. These safety barriers were constructed as a recommended response to each of the identified threats. It was also based on classifying the recommendations collated from various literature and reports covered in Section 2 of this paper. The escalation factors in Tables 3 and 4 describe a condition that makes a threat more likely to lead to the top event, or makes a barrier less effective. In other words, it is a weakening factor that can undermine a preventive or mitigative control. Because it ‘escalates’ the risk, one must consider performing further studies in the future to add escalation factor controls to prevent that weakening.
Classification of safety barriers (preventative/ proactive).

Table 3. Long description
A table categorizing safety barriers into preventative types and listing escalation factors. The table has four columns: Threat, Barrier, Type, and Escalation factors. It contains four rows of data. Row 1: Threat, Insufficient weather condition; Barrier, a. Avoid ship navigation in bad weather, b. Develop a proper procedure; Type, Preventative; Escalation factors, Loss of ship navigation control. Row 2: Threat, Procedure failure; Barrier, a. Install visible speed limit sign in a high-risk waterway, b. Procedure violation shall be recorded, c. Communicate and enforce procedure; Type, Preventative; Escalation factors, a. A prohibition from using the Suez Canal waterway, b. Pay fine. Row 3: Threat, Lack of situational awareness; Barrier, a. Provide training, b. Awareness about rules and responsibilities; Type, Preventative; Escalation factors, Human error. Row 4: Threat, Navigation failure; Barrier, a. Provide training, b. Communicate and enforce procedure; Type, Preventative; Escalation factors, Human error.
Classification of safety barriers (corrective/mitigation).

Table 4. Long description
A table categorizing safety barriers by consequence, type, and escalation factor. The table has four rows and four columns. The columns are labeled Consequence, Safety/protection barriers, Type, and Escalation factor. The consequences listed are Vessel disruption, Canal blockage, Reputation damage, and Salvage. For Vessel disruption, safety barriers include preparing an emergency response plan and diverting incoming vessels to another channel, with types being Control and Mitigate, and escalation factors being Traffic jam and Uses longer channel (Cape of Good Hope). For Canal blockage, safety barriers include installing lights on banks sideways and availing proper tools and tugboats, with types being Control and Mitigate, and escalation factors being Disturbed global maritime trade and Affect global stock markets. For Reputation damage, safety barriers include adhering to procedure and policy and creating a response and contingency plan, with the type being Control, and the escalation factor being Customer uses another carrier. For Salvage, safety barriers include assigning a competent crew ship and maintaining ship condition, with the type being Mitigate, and escalation factors being Settlement/award and Bankruptcy.
Our finding agrees with related research and extends existing literature. In a paper titled ‘Could the accident of “Ever Given” have been avoided in the Suez Canal?’ (Lebedev et al., Reference Lebedev, Lebedeva and Butsanets2021), the authors perform a numerical analysis and conclude that one of the main causes was high-speed wind accompanied by a significant increase in the density of the air–dust mixture. Hence, to avoid the accident, it was recommended to be able to predict the wind speed and prohibit the ship from entering the Suez Canal if there was a danger of a sandstorm.
5.3. Incorporation of the Haddon Matrix within Bowtie model of the Suez Canal incident
The Haddon Matrix was conceptualised back in 1968 (Haddon Jr, Reference Haddon1968) as a model to guide intervention and control for resource allocation in the field of injury prevention and response (Fritch et al., Reference Fritch, Agnew, Rosman, Cadorette and Barnett2021). Since then, the model had many matrix variations and applications. In its simplest form, the matrix has two dimensions: a timing dimension of interaction with hazards in the form of three stages: ‘pre-event’, ‘event’ and ‘post-event’ phases; and the second dimension is related to types of factors and, in its least detailed form, can be divided into: ‘human’ (or ‘host’), ‘vehicle’ (or ‘vector’, or ‘equipment’) and ‘environment’, with ‘environment’ often subdivided into ‘physical’ and ‘sociocultural’ (or ‘social’) (Haddon Jr, Reference Haddon1980). Figure 6 illustrates an example of the Haddon Matrix.
An example of the Haddon Matrix.

By transposing the matrix (i.e. every row becomes a column) so that time can be along the horizontal axis, one can obtain Figure 7.
Bowtie model along the phases of the Haddon Matrix.

By further rearranging the bowtie model in Figure 5 so that the safety barriers can fit in the matrix in terms of the different types of factors, one can obtain the revised model shown in Figure 8. Different factors inspired by the Haddon Matrix include Environmental (physical) factors, where barriers are related to a safety warning of weather conditions, Human factors related to situational awareness and Equipment factors related to navigation failure.
Bowtie model incorporating both the phases and factors of the Haddon Matrix.

Such categorisation of safety barriers is of use to the decision maker as it ensures that resources spent on improving safety barriers are ‘balanced’ and ‘diversified’. Such a balanced approach prevents an unintentional bias on relying on just one type of barrier or focusing on just one phase of response. Also, diversification of types of barriers limits the possibility of having one type of failure mode that can affect all barriers even if they were designed to be independent in other ways. For example, in the case of the Fukushima nuclear power disaster, all cooling pumps were designed to act independently from each other, but all of them were placed at a low altitude. Therefore, the tsunami caused all the pumps to be submerged and not be able to function, which caused the meltdown.
The classical Bowtie modelling is effective in communicating risk and is designed for visual representation. However, in its current form, it does not provide quantitative analysis nor prioritisation in terms of order or weights to safety barriers. By using the Haddon matrix the bowtie methodology is improved through the following arrangements: by time, features and category, as discussed now.
-
(A) Time: i.e. upstream and downstream, where more importance should be given to barriers nearer to the knot of the Bowtie (the hazard).
-
(B) Feature: i.e. human, physical, software, procedures, etc. Therefore, we are not relying on one type. For example, if a cyber attack occurs, it will affect all safety barriers that rely on software.
-
(C) Category: preventative versus reactive, where more preventative (upstream) is better than being reactive, and also a balanced portfolio scenario of both preventative and reactive is a good strategy.
6. Discussion and lessons learned
The Suez Canal incident investigation is still ongoing and there is no official detailed information of what happened exactly on March 23. However, according to the recently published papers and the SAC official conferences, the initial investigation revealed that the root cause of the Ever Given Suez Canal incident is the high-wind sandstorm that caused the ship to wedge and block the canal, and there is no other information revealed by any entities to provide a framed picture of the incident, which was a big challenge to conduct this case study.
Nevertheless, the analysis conducted in this case study agrees and disagrees with the official revealed root cause. For instance, the high-wind sandstorm is a contributing factor to the incident. However, it is obvious and easy to detect through the visual or the technologies embedded in the ship or the bridge. Moreover, for some reason, the captainship has finally decided to navigate the ship in such insufficient weather going through a very narrow channel. What is certain is that the Suez incident had a major disruption on the global supply chain (Lee and Wong, Reference Lee and Wong2021).
According to News (Reference News2021) during a press conference, Osama Rabie, SCA chairman, mentioned that weather conditions were ‘not the main reasons’ for the ship’s grounding, then added that ‘there may have been technical or human errors’ and that all factors would be looked into in the investigation on the incident. This incident has exposed the need for more research into cascading risk, supply chain disruption and resilience, and impact of pandemics such as COVID-19 on global trade.
Our analysis complements a recent work conducted on the Suez Canal incident using Bayesian Network (BN) analysis, which was indented to extract lessons learned, and have identified them as being due to insufficient information, poor communication, a complacent issue and inadequate safety culture for the Ever Given organisation management (Fan et al., Reference Fan, Yang, Wang and Marsland2022).
Furthermore, the analytical techniques used in this case study identified several safety barriers recommendations in Tables 2 and 3 to prevent the reoccurrence of such an indecent. In addition, to the lessons learned can be summarised as follows.
-
• Clear communication between the captainship and the tugboat pilot was extremely important during the canal navigation.
-
• Captain of the ship shall always adhere to the Suez Canal navigation procedures.
-
• Insufficient weather can cause unpredictable consequences.
-
• Improve Suez Canalside banks design by:
-
• Installing lights to provide better vision during night, fog or sandstorm;
-
• safety signs;
-
• wind protection to minimise the wind speed.
-
Furthermore, during the analysis of the minimum cut sets, we identified four scenarios of the least combination of factors that are necessary and sufficient to cause such a major accident. Each of these scenarios can be embedded in the planning of future training simulation exercises and drills for different stakeholders. In addition, by incorporating the Haddon Matrix, one is able to ensure the balance and diversification of resources allocated to safety barriers.
7. Strength and limitation of proposed techniques
The integrated approach, as illustrated in Figure 9, has provided a reliable analytical framework to formulate the incident framework to analyse the factors that led to the Suez Canal incident. The proposed framework of hybrid tools starts with the FTA modelling which is part of a problem structuring phase that aims to help understand the causal factors. This then provides the required ingredients for visualising the relationships between factors for interdependence and vulnerability analysis using the RBD, and for safety barriers for prevention and mitigation using the bowtie modelling.
Sequence of developing and implementing the different techniques of the hybrid model.

In essence, it provides the provision to either prevent or eliminate the possible causes to avoid the reoccurrence of such an incident. The FTA was a crucial technique used in this case study to identify the specific undesirable incident event and the causal factors through AND and OR logic gates, and feed the relationships among causal factors to the RBD model with input to demonstrate the overall system reliability. Moreover, the RBD model transforms the FTA gates to parallel or series structures to underline the system vulnerability. Additionally, a minimal cut set was applied to the FTA logic gates to perform an evaluation analysis to identify any FTA combination events that can be eliminated to avoid a reoccurrence of the incident.
Note here that the use of RBD followed by cut set identification is a natural sequence, although the minimal cut sets can just be obtained directly from the FTA. The reason for having the RBD is to provide a graphical representation of the areas of vulnerability of the whole system. Such weak links are clearly shown when the configuration of the RBD tends to have a majority of series rather than parallel structures.
Furthermore, the bowtie technique has been incorporated with FTA to build a new defense strategy of the system reliability by creating a new safety barrier to control, prevent and mitigate the overall system vulnerability.
Note that in such a risk assessment framework, there are many uncertainties in practice. This is in line with the literature related to the practical challenges in risk assessment (Taarup-Esbensen, Reference Taarup-Esbensen2020) that can be itemised as follows.
-
1. The root cause is not one simple cause, but usually a combination of different events that happen simultaneously or have been affected by each other.
-
2. Risk assessment relies on assigning a probability of a given event. This assignment requires confidence by having a good statistical sample size. However, a major incident is characterised by high severity and low frequency, which makes such assignment a pure speculative exercise based on evident either from expert assessment or near misses.
-
3. Risk assessment also relies on estimating the severity of an event, which can be either an optimistic or pessimistic consequence based on a worst-scenario estimation.
-
4. In deciding to enact safety barriers for both prevention and mitigation based on the previous three challenges, it becomes a difficult decision for the organisation to have confidence in the efficacy of such barriers.
In the aftermath of any major accident, one is often faced by a messy situation, where there are many uncertainties and complexities involving fragmented information, and many stakeholders and with different types of biases. There are three lenses which influence accident analysis, as proposed by Filho et al. (Reference Filho, Jun and Waterson2019); Lens 1 is about ‘data’ in terms of its sources and collection methods; Lens 2 is about ‘method’ in terms of type of method for analysis; and Lens 3 is about ‘analyst’ in terms of background profile and biases.
Despite these challenges, it is believed that the proposed model analysis offers a comprehensive approach to carry out a systematic analysis. However, it was limited due to the lack of incident information since there are several factors that are not yet revealed by SCA or the IMO, which was a challengeable factor during the analysis of the case study. Nevertheless, more data would provide a better realistic analysis approach than subjectivity.
8. Conclusion and future work
This case study showed the influence of using a hybrid technique approach to address the prevention of the Suez Canal incident by selecting a reliability analysis technique in an integrative model. Each reliability technique has a limitation analysis, which will cause a gap in the fundamental function of reliability. The advantage of using the hybrid technique in this case study is that it tends to work in a way to determine the reliability analysis limitation by integrating hybrid techniques FTA, RBD, bowtie modelling and the Haddon Matrix, to achieve the desired reliability outcome. For instance, FTA and RBD are structured to provide the incident’s direct cause and contributing factors. In addition, FTA was incorporated in the bowtie to minimise the negative impact and maximise the system reliability by building safety barriers.
Learning from failures to prevent and mitigate against future incidents relates to two key concepts in risk and safety management; resilience and high-reliability organisations (HRO). Resilience is about the ability to bounce back, and its link to bowtie modelling has been discussed in Section 5 and previously in the work of Labib (Reference Labib2021). The concept of HRO (La Porte, Reference La Porte1996; Weick and Sutcliffe, Reference Weick and Sutcliffe2001) relies on the concept of mindfulness and five features to characterise organisational culture and structure. The measuring of degree of maturity of HRO has then been proposed through a maturity grid by Agwu et al., (Reference Agwu, Labib and Hadleigh-Dunn2019). Future work can extend this analysis and integrate it to HRO maturity assessment to assess whether lessons have been learnt and provide future directions for improvement.
The Suez Canal Blockage (SCB) has also attracted research into analysing public attitude to the maritime incident (Wu et al., Reference Wu, Chen, Gai, Liu and Cao2022), in developing a leader–follower public-opinion evolution model. Our proposed approach can provide a classification of topics of different factors for the public-opinion evolution modelling.
Acknowledgements
This work was partially supported by the project ‘Societal and Economic Resilience within multi-hazards environment in Romania’ funded by European Union – NextgenerationEU and Romanian Government, under National Recovery and Resilience Plan for Romania, contract no.760050/ 23.05.2023, code PNRR-C9-I8-CF 267/ 29.11.2022, through the Romanian Ministry of Research, Innovation and Digitalization, within Component 9, Investment I8. This work was also partially supported by the project ‘SubSeaSafe’ funded by the Lloyds Register Foundation.






 Open access

