I. Introduction
Cooperatives in Europe produce a large part of the total volume of the wine produced, more than 50% of Italian wine, about 40% in France, and around 70% of Spanish wine (Storchmann, Reference Storchmann2018). Cooperatives are considered to be an alternative to corporate firms, or so-called investor-owned firms (IOFs), as they are able to generate growth and a more equitable distribution of wealth through the union of small rural farmers (Altman, Reference Altman2015; Santos-Arteaga and Schamel, Reference Santos-Arteaga and Schamel2018). But cooperatives must face important organizational challenges to adapt to globalization, maturing markets, and climate change (Schamel, Reference Schamel2018). The existing studies on the difference in business performance between IOFs and cooperatives are inconclusive. Some of them highlight the lack of efficiency of cooperatives (Bono, Castillo Valero, and Iliopoulos, Reference Bono, Castillo Valero and Iliopoulos2012; Soboh, Oude Lansink, and Van Dijk, Reference Soboh, Oude Lansink and Van Dijk2012), others affirm that cooperatives perform a better management of resources (Sexton and Iskow, Reference Sexton and Iskow1993; Altman, Reference Altman2015), and others point out that cooperatives have a greater ability to survive in business than IOFs (Rousseliere, Reference Rousseliere2017; Valette, Amadieu, and Sentis, Reference Valette, Amadieu and Sentis2018). Thus, at least two questions arise from the point of view of the competitive advantage of cooperatives in the wine sector. The first one is: Do cooperatives and investor-owned firms (IOFs) have different business performance results? And the second question: Which factors explain the best performance in cooperatives and in IOFs?
There are two basic schools of thought regarding how a company gains a competitive advantage—best performance—The Competitive Advantage (Porter, Reference Porter1985) and The Resources and Capabilities (Barney, Reference Barney1991).
II. Development Hypotheses
In the existing literature, the issue of the differential performance between cooperatives and IOFs achieves a high consensus, since most studies point to the worse position of cooperatives due to their greater inefficiency (Amadieu and Viviani, Reference Amadieu and Viviani2010; Couderc and Marchini, Reference Couderc and Marchini2011; Bono, Castillo Valero, and Iliopoulos, Reference Bono, Castillo Valero and Iliopoulos2012; Soboh, Oude Lansink, and Van Dijk, Reference Soboh, Oude Lansink and Van Dijk2012), with many people involved in their decisions (Aiassa et al., Reference Aiassa, Baltes, Danner, Frischengruber, Horvath, Klotz and Vacca2018), “…and as well as the absence of profit orientation due to poorly specified and diluted property rights” (Fanasch and Frick, Reference Fanasch and Frick2018, p. 282). The reason for cooperatives’ inefficiency is then a consequence of the difference in ownership and development of their governance.
Hypothesis 1 Wine cooperatives will achieve a lower business performance than wine IOFs.
Innovation allows the creation of new businesses and new jobs and increases productivity, being the key to growth. There are several studies in the wine sector that defend the importance of innovation and its relationship with better performance (Nuebling et al., Reference Nuebling, Hammond, Behnke, Almanza and Sydnor2016). Regarding innovation in cooperatives, Nazzaro, Marotta, and Rivetti (Reference Nazzaro, Marotta and Rivetti2016) relate innovation to the creation of value and corporate social responsibility. Through networking and knowledge exchange, Chiffoleau et al. (Reference Chiffoleau, Dreyfus, Stofer, Touzard, Karantininis and Nilsson2006) link collaboration in innovation among cooperatives with performance improvement.
Hypothesis 2 IOFs and cooperatives that enjoy superior innovation capabilities will have a better performance.
Hypothesis 3 Wine cooperatives enjoy the same level of innovation capabilities as wine IOFs.
Several studies (e.g., Cabello Medina et al., Reference Cabello Medina, García Rodríguez, Jiménez and Ruiz Navarro2000; Song, Di Benedetto, and Nason, Reference Song, Di Benedetto and Nason2007) try to relate the generic strategies of Miles et al. (Reference Miles, Snow, Meyer and Coleman1978) to concrete actions in business management. The studies confirm that the three strategic behaviors, prospector, analyzer, or defender, are capable of achieving a good business result. Nonetheless, the reactive strategy is not related to better performance (Camisón, Simón, and Marqués, Reference Camisón, Simón and Marqués2007; Song, Di Benedetto, and Nason, Reference Song, Di Benedetto and Nason2007).
Hypothesis 4 Wine IOFs will have a positive performance as long as they use the prospector, analyzer, or defender strategies and avoid the reactor strategy.
Hypothesis 5 Wine cooperatives will have a positive performance as long as they use the prospector, analyzer, or defender strategies and avoid the reactor strategy.
III. Methodology
A. Sample and Data
The initial sample universe of wineries was 3,286. Following earlier studies (Spanos and Lioukas, Reference Spanos and Lioukas2001), the authors have eliminated lost data, defined as companies lacking location data, a valid email address, or a valid telephone number. The total number was reduced to 2,413, and the survey was sent by email with a telephone reminder provided. The entire process lasted four months, from February to May 2016. A total of 339 valid responses were received—14%. These data represent a 95% confidence level and a sampling error of 4.9%.
B. Variables
(1) Innovation Capabilities
Innovation capabilities are made up of six indicators, measured by a 5-point Likert scale in which the firm had to indicate its position relative to its competitors from one, “much weaker than the competitors,” to five, “much stronger than the competitors.”
(2) Winery Strategy
The evaluation of the business strategy was carried out using the Snow and Hrebiniak (Reference Snow and Hrebiniak1980) method of the paragraph, identifying the typology of Miles et al. (Reference Miles, Snow, Meyer and Coleman1978). In this method, company managers indicate which of the four typologies best suits their reality: prospector, analyzer, defender, or reactor.
(3) Business Performance
Business performance was analyzed following Spanos and Lioukas (Reference Spanos and Lioukas2001), assessing two dimensions, market and financial performance, and referring to the last three years of the activity. On a 5-point Likert scale, companies evaluated their position with respect to the competition, and the values of the scale were between one, “well below the average,” and five, “well above the average.”
C. Logit Model
The logistic regression model was used, in which the dependent variable (Y) is a categorical variable (dummy) that will be explained by the independent variables (Xi). In our case, Y = 1 refers to a positive business result that is better or much better than that of the firm's competitors. The independent variables are those related to innovation capabilities and strategies. To measure innovation capabilities, six variables were used: product innovation (Cip), process innovation (Cis), allocation of resources to R&D (Cir), innovation in management systems (Cim), participation in regional, national, and international R&D projects (Cii), and collaboration with public research organizations or other firms (Cic). The variables used to measure strategies are: the Miles and Snow prospective strategy (Sp), the Miles and Snow analyzer strategy (Sa), the Miles and Snow defender strategy (Sd), and the Miles and Snow reactive strategy (Sr). The constant of the equation is α.
The logarithm of the “odds” is known as the logit function.
 $$\eqalign{ \ln \left( {\displaystyle{{{\rm P}\left( {{\rm Y} = 1} \right)} \over {1-{\rm P}\left( {{\rm Y} = 1} \right)}}} \right) & = {\rm \alpha } + {\rm \beta }1{\rm C}_{{\rm ip}} + {\rm \beta }2{\rm C}_{{\rm is}} + {\rm \beta }3{\rm C}_{{\rm ir}} + {\rm \beta }4{\rm C}_{{\rm im}} \cr & \quad\, + {\rm \beta }5{\rm C}_{{\rm ii}} + {\rm \beta }6{\rm C}_{{\rm ic}} + {\rm \beta }7{\rm S}_{\rm p} + {\rm \beta }8{\rm S}_{\rm a} + {\rm \; \beta }9{\rm S}_{\rm d} + {\rm \beta }10{\rm S}_{\rm r}}$$
IV. Results
A. Differences in Business Performance Between Cooperatives and IOFs
The authors performed a Mann–Whitney U test for an independent and non-parametric sample. As shown in Table 1, there is no statistical significance to affirm that a difference exists in the business performance between cooperatives and IOFs, either in market or in financial performance, so Hypothesis 1 must be rejected.
Market Performance and Financial Performance: Mann–Whitney U Test

Source: The authors.
B. Differences in Innovation Capabilities Between Cooperatives and IOFs
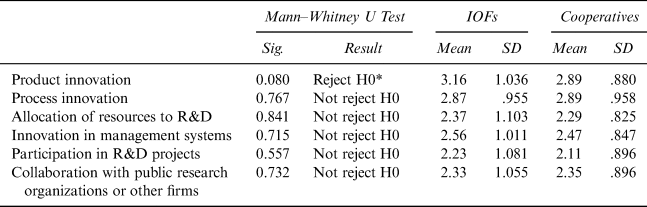
The authors performed a Mann–Whitney U test for an independent and non-parametric sample. As shown in Table 2, statistical significance was only found in the product innovation differences between cooperatives and IOFs. In this case, IOFs have higher product innovation capabilities than cooperatives. Therefore, Hypothesis 3 must be partially rejected.
Innovation Capabilities: Mann–Whitney U Test

Source: The authors. (*) Significance at the 10% level.
C. Logit Model for IOFs and Logit Model for Cooperatives
In both cases, the analysis of the logistic regression as it appears in Equation (1) was conducted. The results of the logistic regression with the variables included in the equation, as well as their beta values and their significance, are shown in Tables 3 (IOFs) and 4 (Cooperatives).
Variables in the Equation for IOFs

Source: The authors.
Variables in the Equation for Cooperatives

Source: The authors.
In the case of IOFs, it is observed that innovation capabilities are the elements that define the best performance. Therefore, the analysis confirms Hypothesis 2. However, the three positive strategies of Miles and Snow, prospector, analyzer, and defender, do not explain the better performance. Nevertheless, the study finds a significance of 0.069 (less than 0.10) between not using the Miles and Snow reactor strategy and business performance. Therefore, Hypothesis 4 must be partially accepted.
In the case of cooperatives, at the 5% significance level, it can be observed that the business performance is defined by configurative strategies, as well as by innovation capabilities. The analyzer and prospector strategies are the most important elements. The third explanatory element of business success is innovation capabilities, through the variable “allocation of resources to R&D.” However, the defender and reactor strategies are not in the equation, since they did not show significant values. Therefore, Hypothesis 2 about innovation capabilities can be partially accepted. The study also partially confirms Hypothesis 5, since the prospector and analyzer strategies are drivers of better performance, even though the defender and reactor strategies are not significant.
V. Conclusions
The main conclusion of the study is that there is no differentiation between the two groups analyzed; therefore, it cannot be affirmed that cooperatives have a lower performance than IOFs. The second question was: Which factors explain the best performance in cooperatives and IOFs?
The results report that cooperatives base their best results mainly on the analyzer and prospector strategies, more than on innovation capabilities. Nonetheless, in the case of innovation capabilities, they use the allocation of resources to R&D more than innovation in products and processes.
Regarding IOFs, the results show that the principal component of their best performance is resources and capabilities, and specifically, product and process innovation capabilities. However, none of Miles and Snow's positive configurative strategies are related to better performance, although the study reported that by avoiding a reactor strategy, an IOF can attain a better performance. The conclusions reached about the differences in business performance between cooperatives and IOFs are in line with the study by Sexton and Iskow (Reference Sexton and Iskow1993), who defended the idea that cooperatives do not have a lower performance, even though members’ return and continuity are the core objectives of cooperatives (Cadot and Ugaglia, Reference Cadot and Ugaglia2018).
In terms of innovation capabilities, cooperatives have a lower endowment of product innovation, since they find it more efficient to allocate resources to R&D in a generic way than to innovate in products and processes, which is more efficient for IOFs. The reason for this different behavior can be found in the objectives of the cooperatives, which are oriented towards their suppliers, located at the beginning of the value chain (Amadieu and Viviani, Reference Amadieu and Viviani2010; Bono, Castillo Valero, and Iliopoulos, Reference Bono, Castillo Valero and Iliopoulos2012; Soboh, Oude Lansink, and Van Dijk, Reference Soboh, Oude Lansink and Van Dijk2012). This has an impact on their innovation plans, which are located close to the producer, without focusing exclusively on products and processes (Wood and Kaplan, Reference Wood and Kaplan2005), as is the case with IOFs.