American economic historians need fresh information on the income levels that prevailed at the end of the colonial era and the dawn of independence in order to understand this country's growth process and its evolving social structure. This need keeps arising whenever we try to cast back from today to the late colonial period, or to project ahead from early colonial years, or to view American incomes in trans-Atlantic perspective.
EARLY AMERICAN GROWTH AND INEQUALITY DEBATES
The debate that tries to backcast American growth from 1840 has centered around Paul David's classic 1967 article on “New Estimates, Controlled Conjectures,” a descriptive label that should apply to this article as well. David, Robert Gallman, Thomas Weiss, and others based their plausible conjectures on the division of the economy into large sectors, each with its own labor force and labor productivity growth. All of these competing estimates have been built up from the output side in the spirit of Simon Kuznets. This article offers something quite different, building up estimates from the income side in the form of what have been called social tables. Until recently, our alternative approach has been hampered by the paucity of data on the occupations and the sector mix of the labor force before 1840. The early censuses did not help much with these, except to give indicators that should have affected labor force participation, such as sex, race, age, region, and urban/rural. Accordingly, we have long thought that a new attack on the issue of early American growth must feature new information on American occupations. Even though many household heads were simply called artisans, merchants, farmers, planters, farm hands, or slaves, it helps considerably to know what labor force shares they represented, where they lived, their average incomes, and how those incomes changed over time.Footnote 1
Economic growth across the colonial era defines more contested territory. Some have seen only extensive growth: that is, stagnant productivity, with only population growth and land settlement, and without gains in average living standards. Others have seen evidence of intensive growth: that is, considerable productivity growth, some emphasizing seventeenth-century emergence from initial hardship and mortality, and others emphasizing gains across the middle of the eighteenth century. This debate has also been hampered by lack of knowledge about labor inputs and occupational structure, and by the roughness of any estimates of productivity growth within such sectors as agriculture or shipping.Footnote 2
Our interest in American incomes around the time of the Revolution is enhanced by viewing them from across the Atlantic. Angus Maddison (2007) estimated that it was not until after the 1870s that the United States caught up with the United Kingdom in real GDP per capita, though active debate has ensued about the uncertainties of his and others' estimates. Maddison's beliefs need to be reconciled with the fact that North America attracted a significant net emigration from the mother country and that colonial and republican population growth was much faster here. In the light of current research on the Great Divergence, on the history of European incomes, and on the continued use of the Maddison world income estimates, we think the time is ripe to add data from the American side to compare with the new estimates for Europe.
We can now offer new estimates based on more archival data than were available to earlier researchers. The harvest is offered as an “open-source” presentation of our detailed data and procedures on the internet, for both negative and positive reasons. The negative reason is that many scholars might resist accepting some new estimates based on vulnerable primary data, wishing to offer their own estimates. The positive reason for open sourcing is the dynamism of the database itself. The information explosion that has offered us new data will continue to offer additional data to all scholars in the future. Maximizing the disclosure of our data and procedures accelerates the opportunities for improving the reliability of the estimates. Hence, our work is tied to a set of appendices and two downloadable sets of spreadsheet and text files. One is this Journal's archived file set, and another is an expanding data set relating to our larger project on American incomes 1774–1870.Footnote 3
Our findings confirm some common beliefs about growth and inequality in early America, yet contradict others, and also introduce some brand new issues. This article offers a clearer view of colonial American inequality and how the incomes of different classes compared with those of their counterparts in the mother country. American inequality was much lower in 1774 and 1800 than in England or Wales, especially among free whites. Inequality was also lower in the Northern colonies than in the United States today. We find higher colonial incomes in 1774 than did previous scholars, especially higher in the Southern colonies. In 1774 average colonial incomes seem to have been higher than those in England and Wales, using either exchange rates or purchasing power parity hints, though American incomes were almost certainly lower in 1800. Our estimates raise new questions about what happened between 1774 and 1800, during the Revolutionary War era and then at the dawn of the Republic.
HOW THE ESTIMATES ARE DERIVEDFootnote 4
The 1774 Colonial Evidence
Our approach starts by counting people by occupations or social classes, and mustering evidence about their average incomes. That is, we build national income and product accounts (NIPA) from the income side. This departs from all recent scholarship on early American growth, which has built its real income series from the production side, and then used price indexes to estimate nominal incomes. Historians will recognize our approach as that of building social tables,Footnote 5 in the “political arithmetick” tradition spawned by such Englishmen as Sir William Petty and Gregory King in the seventeenth century. That is indeed our approach here, as it has been in other publications of ours.Footnote 6 We are preceded by at least two early American writers who imitated Petty with their own calculations of what their region was worth—presumably to guess at its ability to pay taxes and fight wars.Footnote 7
Fortunately, the archives continue to accumulate early local returns that recorded people's occupations, including such social labels as “esquire” or “widow” in the English tradition. Reconstructing society from these sources is no easy task, however, and will continue to be challenging even as the primary data accumulate in the future.
Any social profile of Americans on the eve of the Revolution must start from local censuses, tax lists, occupational directories, and probates, all supported by the earliest national population censuses of 1790 and 1800. Fortunately, the recent electronic revolution has made local enumerations from the late eighteenth century much more accessible. While all records before 1790 were local, aggregate regional counts can be developed by assuming that proportions from one documented locality represents those of other localities in the same region, with the same population density, urbanization level, and qualitative attributes.
Our path to counting early Americans by work status, location, and living arrangement starts from basic population totals themselves, and then adds early U.S. labor force estimates (themselves constructed from labor participation rates by age-sex-slave/free cells), before dividing up that labor force by occupation and by household headship status.
Population Census Counts: The few local censuses from the colonial period are now collated and referenced in the colonial section of Historical Statistics of the United States, both in the Bicentennial Edition (1976) and in the Millennial Edition (2006). These offer detail by sex, race, free/slave status, and rough age distributions for seven colonies; we clone the demography of the other six missing colonies from these seven.
Labor Force Participation Rates: Next we derive persons in the labor force for each demographic group defined by place, sex, race, free/slave, and age. Following convention, the labor force consists of all persons generating products and services sold in significant part (or, for slaves, demanded in significant part) outside the household.
To convert population into labor force, we use the detailed labor participation rates for 1800 supplied by Thomas Weiss. It seems reasonable to assume there were no behavioral changes over these twenty-six years in the rates defined in the detailed cell-specific Weiss estimates, which give separate rates for such cell categories as urban Pennsylvania's free white females age 10–15, or rural South Carolina's male slaves over the age of 10, or small town Connecticut's free white males aged 16 and older. However, since these categories changed in relative importance over time, the regional and national labor participation rates could and did change between 1774 and 1800.
Recorded Occupations: Sketching the social makeup of the labor force requires detailed occupation counts for different localities. We draw on newly accessible counts for years near 1774, though only for a few places, only for parts of the labor force, and only with the help of some comparison of occupational mixes over time and space.
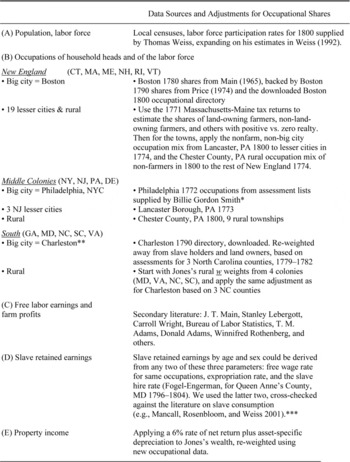
Our fresh start on the social structure of America on the eve of the Revolution uses local tax assessment lists and occupational directories, as reported in Table 1. Such lists allow us to create the following occupational groups for the free population:
Group 1 = Officials, titled, professionals
Group 2 = Merchants and shopkeepers
Group 3 = Skilled artisans in manufacturing
Group 4 = Skilled in the building trades
Group 5 = Farm operators (renters, sharecroppers, planters, owner-operators)
Group 6A = Male menial laborers
Group 6B = Female menial laborers
MAIN DATA INPUTS FOR 1774 INCOME ESTIMATES

* See Smith (1984, 1990), supported by Price (1974) on Philadelphia 1780–1783.
** The earliest Baltimore occupational directory available is for 1799, and the earliest for Norfolk, VA is for 1801. Both are posted on the http://gpih.ucdavis.edu site.
*** See the file “slave earnings retention 1774, 1800” posted on the http://gpih.ucdavis.edu site.
Notes:
For further details on the derivation of these occupational shares, see the worksheets on LW occupational weighting in the three regional “Property 1774” Excel files, posted on the http://gpih.ucdavis.edu site.
The new data reshape the occupational structure of the colonies. For example, relative to Alice Hanson Jones (1977), our estimates shift a lot of the Middle Colonies' labor force from middling farmers to less wealthy craftsmen and laborers, and to males with no stated occupation.
In the urban South, the 1790 directory for Charleston seems usable, when scaled back to the estimated Charleston 1774 population. One gets the same occupational patterns by starting with Jones's w weights for a sample drawn from four Southern states. In either case, one must adjust for the overrepresentation of absentee landowners and, especially, of slaveholders. We adjust the Jones weights, guided by some very useful local censuses from three North Carolina counties in 1779–1782. These enumerate the whole population of free household heads according to whether they held slaves or real estate or both or neither. We assume that the same adjustment of weights is required in Charleston as in the rest of the South.
For the rural South, we carried out the same adjustment away from slaveholders and landowners, giving instead more weight to ordinary farmers. One could wish, of course, for a broader sampling of the rural South than just the Jones sampling from four states, plus our new sampling from the three North Carolina counties. There are other rural Southern county assessment documents on the internet, but only very few are for dates earlier than 1798, and none of the lists we have seen record the occupations of the household head.
Unrecorded Occupations: Persons with occupations recorded by tax assessment lists or urban occupational directories fall short of the persons in the labor force. In most cases they even fail to capture all household heads, the exception being those three counties of rural North Carolina between 1779 and 1782, for which the listings seemed to have captured all free household heads.
Not all unlabeled labor force members are equal. Some lack an occupational label despite a positive amount of assessed wealth. Some lack an occupational label, and are listed as tax-exempt because they had zero or near-zero wealth. Thus, we distinguish between the following groups of household heads in the social tables:
Group 7 = free males with positive wealth but no recorded occupation,
Group 8 = free females with positive wealth but no recorded occupation, and
Group 9 = free persons recorded as having zero or near-zero wealth and no stated occupation, and others who are in the labor force but unlisted in local records.
Counting Households: One could avoid measuring household headship if we were interested only in measuring aggregate national product, since it depends only on who is in the labor force and their average income. Yet we need the headship rates by occupation to measure inequality.
Households are the income recipient units used here to measure income inequality, for both practical and theoretical reasons. Previous investigators have been forced to confront the simple fact that taxable property, such as real estate, is used by all household members, even if only one is the owner and taxpayer. The prevailing practice is to measure income inequality among households, not among individual income earners. In order to compare apples with apples, we do the same. That's the practical reason. The theory comes from Simon Kuznets (1976), who warned against measuring inequality among individual earners and emphasized the superiority of the household focus. Caring about economic inequality means caring about how unequally people consume resources over their lifetimes. Even if data constraints force us to study annual inequality rather than life-cycle inequality, Kuznets pleaded for the measurement of annual income per household member. The numerator should capture the incomes of all economically active household members, and the denominator should capture all adult-equivalent consumers in the household.
Since the early population censuses usually did not count households, some assumptions must be invoked to decide who were in fact household heads. Fortunately, historians of early America have already grappled with this issue. Following the leads of Billy Gordon Smith (1981, 1984, 1990) and the late Lucy Simler (1990, 2007) in particular, we estimate the number of household heads from population data from c. 1774 and c. 1800 invoking the following assumptions:
(1) All free white males, 21-up, were household heads, subject to (4) below;
(2) All free white widows with any indication of property ownership or of occupations were household heads;
(3) One-sixth of the free black population consisted of household heads;Footnote 8
(4) The number of free white males, 21-up, who were not household heads is matched by the number of free white females, 18-up, who were household heads, despite not being included in (2) above. That is, we assume that two errors offset each other when using the white males 21-up as household heads. Hopefully, later studies can make more headway on the headship rates by gender.
These assumptions have generated the total numbers of households by place—that is, by region and by urban versus rural.
By subtraction, we derive the number of household heads that are missed by the listed-occupation counts. The shares of heads omitted are often large when the occupational data come from the tax lists and the urban directories. As estimated in detail elsewhere, the colonial business directories and the tax lists may have missed more than 30 percent of all households.Footnote 9 Left uncorrected, such counts would underestimate total income and its inequality, since many of the unregistered were poor. In contrast, the tax lists from around 1800 are more likely to have captured something like the full population, or so it appears in our samplings from New York State property tax rolls that began around 1799, where the number of assessments approximated the estimated number of households. The same should have been true of the federal direct tax of 1798, which required a household enumeration subject to external audit.
Still, we have found significant omissions in some tax lists and business directories from the colonial era. Which groups were most frequently omitted? The literature has advanced the plausible intuition that the omitted consisted mainly of the tax-excused poor. Yet, there is also some evidence that many in the middling and rich groups may also have been omitted, or at least that their wealth was under-assessed. We have used clues from the tax assessments to divide the household heads of no recorded occupation into Groups 7–9.
Three tough questions need to be answered about those who were in the labor force (LF), according to the censuses and the Weiss estimates of labor force participation rates, yet who were not reported as household heads (HHs): First, how many of them were there for each place defined by region and by urban/rural? Second, what kinds of occupations and earnings rates did they have? Third, whose households did they live in, and share resources with? Guided by the censuses, we identify the following groups in the labor force who were not household heads:
Groups 10 and 11 = Free white males and females, respectively, ages 10–15;
Groups 12 and 13 = Free white males and females, respectively, ages 16-up, but not household heads;
Groups 14 and 15 = Free black males and females, ages 10–15;
Group 16 = Free black males ages 16-up, minus free black household heads;
Group 17 = Free black females ages 16-up;
Group 18 = White indentured servants in Maryland, the only colony that labeled them separately in a census near 1774; and
Group 19 = Slaves ages 10-up (65 percent of whom were assumed not to be household heads).
Some of these groups contained laborers who were almost surely paid only unskilled wage rates, while others could have been spread over occupations of higher earnings. Our income estimations make the following assumptions within each location:
Groups 10, 11, 14, and 15 (free non-HH heads ages 10–15) are allocated to Groups 6A and 6B, menial or unskilled, by sex;
Groups 12, 13, 16, and 17 (free non-HH heads 16-up) are allocated location-specifically across Groups 2–6 in the same proportion as are Groups 2–6;
Group 18 Maryland servants are allocated across occupations following David Galenson (1981) and Farley Grubb (1985), occupations that were relatively urban and skilled.Footnote 10
Group 19, slaves ages 10-up, uses other scholars' estimates of the amount of their earnings they were allowed to retain for consumption, specific to region and occupation. In the South, the rate varied between 41.4 percent for field hands to 52.7 percent for Charleston labor. Following Claudia Goldin (1976), Richard Wade (1964), Richard Sutch (1975), and others, we assume that slaves doing nonfarm work were artisans, construction workers, or unskilled (including servants). The nonfarm share unskilled is based on the Charleston 1848 Census, while the residual is divided equally between artisans and construction workers.Footnote 11
So far, these calculations affect our estimations of both aggregate national income and income inequality. For inequality purposes, and following Kuznets, we must further decide in whose households these non-HH head members of the labor force lived. The data are almost nonexistent on this issue. We make the following assumptions about the non-head earners “imported” into the households of others:
(1) For each region and urban/rural place (e.g., New England big cities or rural South), the non-heads and their individual earnings are absorbed into the same region and place.
(2) For the free population, within each group defined by region and urban/rural, we assume that the average earning power of each non-HH head imported into free families is the same for all free persons of that occupation in that place.
(3) Slave non-heads are taken into slave households only, leaving household income the same as the retained earnings of all slaves.
(4) This same assumption holds for the separately recorded group of Maryland servants, though the assumption is redundant here because these are one-person households.
These assumptions and the resulting allocations can certainly be challenged. We emphasize one point about data sources: For each place defined by region and by urban/rural, the aggregate “imports” of non-HH heads are driven by the census, the labor participation rates, and by the household headship rates. The allocation of non-HH heads to households by place is not yet derived from micro-studies about how households shared earnings, because there are too few such studies. Nor are the allocations simply assumed, except for the key middle-of-the-road assumption 2 above.
Labor Earnings by Occupation, Circa 1774: We are able to assign annual incomes to the most ubiquitous occupations in each location, thanks to the enormous archival gleanings of Carroll Wright, T. M. Adams, Stanley Lebergott, Jackson Turner Main, Donald Adams, Winnifred Rothenberg, and a few others.Footnote 12 Their time-consuming collection of newspaper quotes and account book entries must be used with care. Some are in the depreciated local colonial currency, whereas others are in (British) pounds sterling. Fortunately, most sources, and Main in particular, were careful to say which was which. Some of the earnings are annual, as for white-collar professionals and farmers, but others are monthly, weekly, or daily rates of pay, requiring assumptions about how many days or months they spent in gainful employment each year. We believe that for those days or months in which a person did not hold his or her main stated job, he or she nonetheless filled in with other productive work, like weaving and farming at home, and some of this output was traded on the market. Thus, our “full-time” estimates assume that daily or monthly full-time equivalent (FTE) workers performed productive work of some kind for 313 days a year (excluding only Sundays). This assumption implies, of course, that we include more nonmarket work in our income estimates than do other scholars that include only or mainly market work in their output estimates. However, to imitate the labor force behavior that other scholars may have assumed in estimating early American GDP, and as sensitivity analysis, we also calculate “part-time” estimates that use fewer labor days per year.Footnote 13
We enlarged the concept of labor earnings to include farm operators' profits, estimated by Main, plus slaves' and indentured servants' retained share of what they earned. As noted previously, we have called this labor income amalgam “own-labor incomes.”Footnote 14
Property Income in 1774 Footnote 15: Our property income estimates benefit from Jones's exhaustive and masterly study of America's wealth in 1774, based on her 919 probate inventories and supporting documents.Footnote 16 A key advantage of her data is that they identify the occupation or social status of most of the people in her colonial sample. We have examined her data and procedures in great detail, and find no flaws.Footnote 17 Jones realized that a probate-based sample ran the risk of overstating average wealth, and understating wealth inequality, because probate was more likely for the deceased rich than poor. She went to enormous lengths to adjust for this, ending with what she called w*B estimates that were meant to capture more of the poor. We have moved in the same direction, using a different procedure. Our greater weighting of the poorer households was achieved by introducing the new data on occupational structure described earlier in this section. As it turns out, our estimates imply an even greater probate-wealth markdown than did her w*B estimates.
Wealth is not property income or total income. Jones confined her income-measurement efforts to brief conjectures about wealth-income ratios, using twentieth-century aggregate capital-output ratios borrowed from the macroeconomics literature of the 1970s.Footnote 18 We have followed a different route, in order to exploit the wage data just described. Our reading of the limited evidence on colonial rates of return suggests that, on average, assets probably earned a net rate of return of 6 percent per annum.Footnote 19 Later, we will quantify the sensitivity of our income estimates for 1800 to this 6 percent rate of return.
The gross rate of return, which is more appropriate to the calculation of gross national product for comparison with other studies, equals this net 6 percent plus rates of depreciation that differed by asset. Following NIPA accounting standards, we have assumed zero depreciation on financial assets and real estate (positive depreciation offset by rapid capital gains), 5 percent for servants and slaves, 10 percent for livestock and business equipment, and zero for net changes in producers' perishables and crops.Footnote 20
Combining Own-Labor Income and Property Incomes for 1774: Here we gain from having invested so much effort in gathering occupation data. Since own-labor incomes and property incomes are both arranged by occupation, we can combine the two to get their total incomes. For farmers, the largest occupational group, we can even exploit some of the regional size distribution of property income data, dividing it into the top 2 percent of farmers, the next 18 percent of farmers, a middling 40 percent, and a bottom 40 percent. This disaggregation helps us judge the degree of income inequality within each region.Footnote 21
Households Were Practically the Whole Economy: Our calculations offer what NIPA accountants call total private income of the household sector. The colonial government sector's contribution consisted only of the wages and salaries of government employees and military personnel (already included in our occupations and own-labor earnings). There were no government corporations in 1774. Nor do we need to worry about the retained earnings of private corporations, since they amounted to little by the end of the century. The same assumptions will be made for 1800. When a future paper compares 1774 and 1800 with similar accounts for 1850–1870, the non-household sector will take a larger share of national income for the later dates.
The 1798–1800 Postrevolutionary Evidence
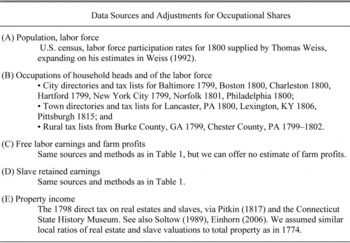
Our next benchmark for appraising national income is the census year 1800. On the labor-income side, our procedures for 1800 are roughly the same as those we applied to 1774, though the data sources are more copious and of higher quality. Table 2 sketches the mixes of sources and methods for the 1800 estimates. What is distinctive about the estimates for 1798–1800 relates not to labor incomes but to property incomes. To fund a possible conflict with France, Congress passed the first direct tax, a one-off tax levied on real estate wealth and on the numbers of slaves.Footnote 22
The 1798 direct tax returns remain the most useful source available for the property income side of 1800 national income estimation. True, one might view these returns with some suspicion: Can we trust the quality of the data extracted by tax collectors from a new nation that had just shed its royal government partly over tax issues? Such suspicion is indeed warranted, especially given some evidence that properties had already been under-assessed in tax returns of the previous two decades.Footnote 23 Before using the 1798 returns, we must identify, and adjust for, their likely biases.
MAIN DATA INPUTS FOR 1800 INCOME ESTIMATES

Note:
See the details of these data sources and their use in http://gpih.ucdavis.edu.
In New England and the Middle Colonies, the 1798 direct tax probably under-assessed market values by something like 15.5 percent, a figure based on a contemporary study of marketed real estate in Connecticut in that same year.Footnote 24 We have raised our 1800 property income estimates by this 15.5 percent underassessment in New England and the Middle colonies, and also by the 7 percent rise in average asset values from 1798 to 1800 suggested by the contemporary Samuel Blodget (1806).
The South might have under-assessed rich households' realty, and slaves, by even more than that 15.5 percent underassessment in the North. Appendix 3, in the supplementary materials,Footnote 25 lays out the peculiarities of southern assessment for the 1798 tax, and presents our preferred estimates for the extent of underassessment. The adjustment for the extra Southern underassessment raises real estate plus slave wealth values by 30.1 percent for the South Atlantic. This combined with the nationwide underassessment of real estate by 15.5 percent raises real estate plus slave wealth values by 40.4 percent for the South Atlantic, or 27.7 percent for the whole Eastern seaboard.
Since the 1798 returns covered only real estate and slaves, we had to use the same ratios of total property/(realty plus slave values) obtained from the 1774 evidence to inflate them to total property. We apply region-specific ratios to each of the three colonial regions.
There is one other important difference between the data sources on the property side between 1774 and 1798–1800. The 1798 tax returns are very handy in that they were aggregated for us at the time. But a serious drawback of the 1798 return is that it reports no data on occupation. This means that we cannot document the occupational distribution of total income for 1800, although we can document the distribution of own-labor incomes and property incomes separately, as well as the aggregate value of total income. To survey the resulting estimates, we turn first to the levels and growth of aggregate income over the quarter-century 1774–1800, and then to the income inequality of 1774 alone.
PROVISIONAL CONCLUSIONS ABOUT INCOME LEVELS AND GROWTH, 1774–1800
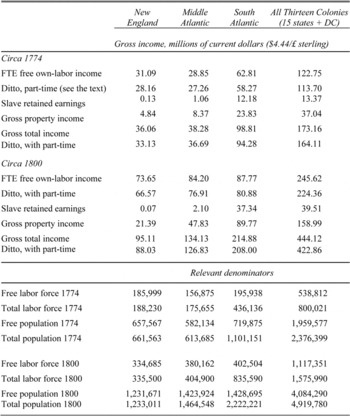
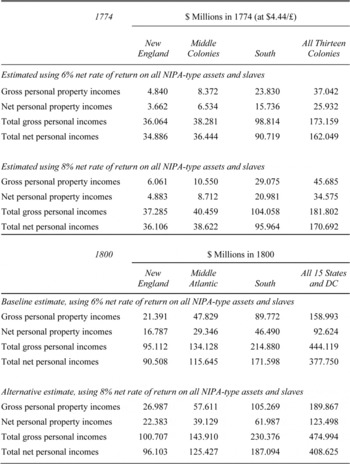
Our estimates of labor and property incomes shed new light on average income in 1774 and 1800, and the growth of income per capita over a quarter-century of war, postwar, and national emergence. The levels and composition of total personal income are shown in Tables 3–6, for the three regions used by Jones and for a geographically fixed “nation,” defined as the thirteen colonies in 1774 and the easternmost 15 states plus the District of Columbia in 1800. Table 3 can be used to calculate any of several important ratios, using the denominators in the lower half of the table and the price deflators in the notes to the table. Here we stress two key results. First, in 1774 the colonial South had about twice the income per free person as that in the Northern colonies, and was richer on the average even when one rightly counts slaves as persons. Second, these new estimates imply that real income per capita dropped seriously over that quarter-century. The 1774–1800 decline of about 20 percent looks almost as serious in per capita terms as the 1929–1933 drop into the Great Depression. If other authors are correct in reporting brisk income gains across the 1790s, then the Revolutionary disaster and Confederation turmoil could have been America's greatest income slump ever, in percentage terms. Let us first scrutinize the levels of income at each date, before searching for explanations of the implied net decline.
ESTIMATED AMERICAN PERSONAL INCOMES, 1774 AND 1800

Notes:
Notes: The estimates exclude Native Americans. The 1800 estimates currently lack any estimate of farm operators' residual incomes beyond the implicit value of their farm labor and their property incomes (see the text). The gross property incomes for 1800 are based on middling assumptions about Southern underassessment in 1798 (see the text). The baseline estimates use the full-time assumptions of 313 days per labor year, in occupations where the primary earnings data are sub-annual (e.g., daily or monthly wage rates). The part-time assumptions retain the explicitly annual income estimates for titled and professionals, for commercial proprietors, for manufacturing trades, servants, slaves, and household heads of unstated occupations having positive wealth. Part-time work years for explicit pay are assumed to have been only 280 days for construction workers, farm operators, and the rural unskilled. For urban unskilled and for household heads with zero wealth and unstated occupations, we assumed a work year of only 222 days. Delaware is here included with the Middle Colonies for both years, following Jones's sample design.
The Income Level Estimates for 1774Footnote 26
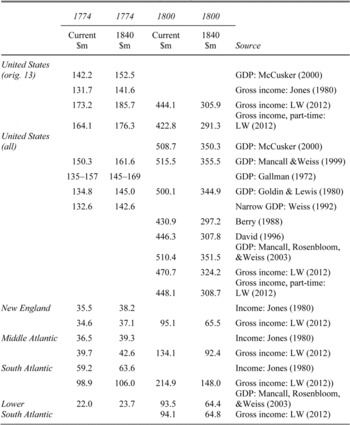
Our estimates suggest that the thirteen colonies were richer and more productive in 1774 than other estimates have implied. The left half of Table 4 underlines the contrast, focusing on the more recent and more prominent set of competing estimates. Our thirteen-colony current-price(full-time) estimate of 173.2 million dollars is 26 percent greater than the average of the Jones and John McCusker estimates (136.9 million). Yet our colonial income estimates differ greatly from those of Jones for only one region. There is little difference for New England or for the Middle Colonies. The main source of the big difference with Jones arises in the South, for which our income estimate ($98.8 million) is almost twice that of Jones ($59.2 million).
There are two gaps to confront here: The gap in estimates for the thirteen colonies as a whole, and the gap for the South alone. While there must be error components in any measures of early incomes, including our own estimates, we offer reasons for believing that the thirteen-colony gap and the Southern colonial surprise are not due to errors we have introduced.
For the thirteen colonies as a whole, the large gap is not driven by any higher estimate of wealth per household, since we rely on Jones' own work. Supplementing her data with our new occupation weights, we get a slightly lower net worth per wealth holder than she did. Furthermore, because we find many fewer households with wealth than her estimated number of “potential wealth holders,” our aggregate wealth estimate is only about 70 percent of her implied total wealth.Footnote 27
Our conversion of wealth into property income, as described earlier, involved multiplying different asset holdings by net and gross rates of return. A reader feeling that our income estimates seem too large might want to challenge both our net and our gross rates of return as being somewhat high. It seems very unlikely that our 6 percent figure overstates the net rate of return, the opportunity cost of not having lent at interest. The colonies and the early republic had a legal usury limit of 6 percent that was vigorously supported by law and custom.Footnote 28 That is, the usury constraint seems to have checked a strong demand for capital, so that the 6 percent ceiling might very well have been below market. Could the (illegal, market) rate of interest foregone by holders of directly productive assets have been higher, say 8 percent? This is a distinct possibility, especially for 1800, for which the literature suggests even greater capital scarcity than for 1774.Footnote 29Table 5 shows the impact of assuming 8 rather than 6 percent. Shifting to the higher rate of return would raise our total income estimates further above those conjectured by other scholars.
ALTERNATIVE ESTIMATES OF NATIONAL INCOME 1774 AND 1800, IN CURRENT $ AND 1840 $ (millions)

Notes:
(1) Gross income, Net income = our baseline estimates of personal income, gross and net of depreciation. For the “part-time” variant, see the text.
(2) This culled set omits very old estimates, and if a modern source offers more than one estimate, this set selects the most recent. It also selects the highest in the Jones range, as recommended by Gallman and Weiss.
(3) John McCusker's (2001) price deflators = 97 for 1774, 151 for 1800 if 1860 = 100, or 93.3 for 1774 and 145.2 for 1800 if 1840 = 100.
(4) The western states included in the LW “United States (all)” estimates are KY and TN, plus MS for labor incomes only.
One might also challenge our depreciation assumptions in deriving gross property incomes. Indeed, some might argue that depreciation should not have been included in the income estimate at all. If the reader prefers net property income estimates, ones that only include that 6 percent rate of return on wealth, then she can refer to the 1774 net household income estimate of $162 million shown in Table 5.Footnote 30 This net household income estimate would eliminate about half the gap between our gross income estimate of $173.2 million and the $136.9 million average estimate offered by Jones and McCusker. That partial convergence might seem comforting, but it should not. The debate over early American economic growth has consistently used gross national (or domestic) product, not net national product. We should conform to the same convention for purposes of comparing apples with apples. Thus our favored 1774 aggregate income estimate remains the gross income figure of $173.2 million shown in Tables 3 through 5.
So much for possible biases in property income. What about our own-labor income estimates for 1774, supported as they are by new occupation weights, full-time employment assumptions, and occupation-specific wage rates? Could these have exaggerated labor income for the thirteen colonies as a whole, thus raising our aggregate income estimates above that of previous scholars? The source of the difference cannot lie with our new occupation shares, which give greater weight to poorer and less probated whites in the North, since this would serve, once again, to make our estimates lower than Jones's, not higher. We also do not think the full-time employment assumption of 313 working days per year for those hiring out is inappropriate, given the widespread prevalence of home production and direct nonmarket consumption in the eighteenth and early nineteenth century.
ALTERNATIVE PROPERTY INCOMES AND TOTAL INCOMES, 1774 AND 1800

Note:
These Table 5 estimates use the full-time estimates of personal income. Corresponding estimates for part-time national income can be derived by applying the part-time personal gross estimates for both dates here, and deriving the other rows using the ratios and differences implicit here.
Source:
The three “Property 1774” Excel files, and the “Property totals 1798–1800” and “Own- labor incomes 1800” files.
And as we have already noted, a more conventional set of assumptions about different occupations' annual work days would cut our estimated national income by only 4.8 percent.Footnote 31
What did Jones assume about rates of pay for labor, including the earnings retained by slaves? In fact, she did not make any assumption at all, but took a single leap of faith that we have already noted: By picking up some capital-output ratios quoted in the aggregate growth literature from the 1970s, she jumped from her impressive and reliable wealth estimates to less reliable total income guesswork which stands or falls on her assumed aggregate wealth-income ratio (not necessarily the same as a capital-output ratio). The macro literature offered Jones capital-output ratios ranging from 2.5 to 10 for the nineteenth and twentieth centuries. Within this wide range, she said, “I hazard that ratios of three or three and a half to one may be reasonable.” Yet we find that the 1774 ratio of net worth (wealth) to national income was only 1.89.Footnote 32
The strikingly wide gap between Southern and Northern incomes in 1774 has a simpler explanation. In 1774, unlike 1860 and later, the South had a very different mix of free men's occupations, with a much higher propertied share and fewer poor. On the eve of the Revolution, the South was still a frontier with rich productivity in producing exportable tobacco, rice, indigo, and cotton. We find this contrast between the regional occupation mixes among free household heads in 1774:

Southern farm operators not only had higher average incomes than other farmers, but they constituted a larger share of households, while low-paying occupations took a lower share among free Southerners. The advantage of the colonial South should not seem surprising, even without any gap in wage rates for given occupations. What drove the income gap between regions was not pay differentials mysteriously unexploited by potential migrants, but rather a mix of Southern occupations featuring those for which entry required prior accumulation of wealth in a world of imperfect capital markets.Footnote 33
Other clues support the belief in a richer colonial South. Jones's wealth estimates had already shown that Southern wealth per wealth holder was 56 percent higher in the South than the average for other colonies. That again stemmed largely from her estimates of the occupational mix, even before our revisions magnified the contrast. Both her occupational mix and ours show a remarkable lack of poor Southern whites, defined as those of menial trades or those having zero assessable wealth. While our occupational calculations for the South have used only Jones's estimates plus the finding that there may have been no household heads with zero wealth in three North Carolina counties, two archival data sets from Virginia in the 1780s again suggest that there were few demonstrably poor white household heads. Tax returns from 1787 for rural Loudoun County at the north end of Virginia appear to have covered all white households, yet with very little evidence of white masses with zero net assets. Similarly, while a special census of the rural town of Richmond, Virginia in 1782 did reveal some white household heads with menial occupations or the possibility of zero wealth, their share of white household heads was no higher than in the rural towns of Chester County, Pennsylvania, and lower than the share in rural Massachusetts. More important than these comparisons within regional hinterlands, or between their respective small towns, was the interregional difference in rural and urban shares. The South was overwhelmingly countryside, where the poverty share among the free population was lowest. While the percentage of true white paupers was not zero in the South, it was not as high as in the North.Footnote 34
The Income Level Estimates for 1800
Unlike those for 1774, our 1800 total income estimates are not above those offered by other scholars. In fact, our estimates, shown on the right-hand side of Table 3, are in the lower half of several competing estimates for the nation as a whole. Our 1800 totals for the Lower South match those of Peter Mancall, Joshua Rosenbloom, and Thomas Weiss (2003), even though we used the income approach and they used the production approach. It might seem comforting that our 1800 estimates are so close to others. However, ours would have been a bit higher than most if we had been able to make all the adjustments that we feel are warranted. We are especially concerned about two such adjustments. One of these can be quantified but one cannot.
The first potential adjustment is one already mentioned in connection with Table 5: using the interest rate on public debt as a measure of the opportunity cost of assets, it appears that the net rate of return on property was higher in 1800 than in 1774, presumably in response to Revolutionary War and Confederation inflation, financial disruption, and perhaps even productivity advance.Footnote 35 As we have noted, if the interest rate tended to be 8 percent in 1800 versus 6 percent in 1774, then the 1774–1800 decline in real per capita income would be a bit less, 14 percent, using the “alternative” estimates for 1800 shown in Tables 5 and 6, rather than the bigger decline of 20 percent implied by the baseline estimates.
The second adjustment relates to an omission from the baseline 1800 estimates. We have no 1800 data, or even guesses, about farm operators' pure residual profits, as distinct from their asset returns or the implicit value of their own physical labor. For 1774 we were able to use a few testimonies unearthed by Main (1965) to guesstimate that the farm profit residual was 18.9 percent of all farm operators' income in New England, 21.1 percent in the Middle Atlantic, 34 percent in the South, and 28.8 percent for the 13 colonies as a whole. We cannot apply these ratios to 1800, however, since we lack any delineation between farm operators and free farm laborers in the census or in the Weiss labor force estimates on which we rely.Footnote 36 Until evidence on this issue emerges, we can only propose our alternative estimates in Table 6, and repeat that accordingly the nation still experienced a per capita income decline of maybe 20 percent over the quarter-century, though the decline might have turned out to be a little less than our estimates show had we been able to add estimates of 1800 farmers' pure profits in the future.
REAL INCOME PER CAPITA, 1774–1840
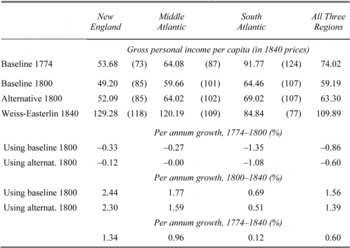
Notes:
The figures in parentheses are percentages of the all-three-regions average. All estimates for 1774 and 1800 use the part-time work year assumption, to conform to procedures that seem implicit in the Weiss-Easterlin 1840 estimates. The “baseline” estimates for 1774 and 1800 are the ones using a 6 percent net rate of return on assets, whereas the alternative estimates for 1800 use 8 percent. As noted in the text, both 1800 estimates omit farm operators' pure profits for 1800. The 1840 estimates start with Weiss's (1992, table 1.2, page 27) national estimates, and derive regional relatives from the state-level relatives in Easterlin (1960, pp. 87–98). The three-region totals are derived from the regional averages. The South Atlantic excludes DE and FL; the Middle Atlantic includes DE, MD, and DC in 1800. The price deflator is the McCusker composite price index.
Long-Run Growth Implications
Our estimates imply that between 1774 and 1800 America suffered a serious net decline in per capita income. We need to conduct some reality checks on these results, both in terms of their longer-run growth implications and in terms of their implications about the turbulence within that quarter-century itself.
How do the estimates fit into accepted narratives about the longer-run development of early America and its regions? Our new higher income estimates for 1774 will, of course, reopen the debate over growth during the long colonial period. It seems wisest to refrain from commenting on this part of the debate until our social tables technique has been applied to some benchmark date earlier in the eighteenth century.
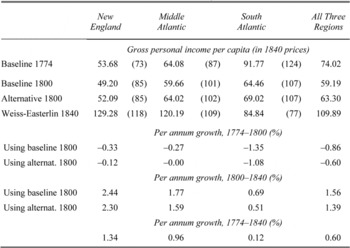
We are more prepared to use our income estimates to assess America's growth performance up to 1840. Table 6 supplies our real per capita income growth estimates for each of the three regions, and for the three combined (the “nation” consisting of the thirteen original colonies), and it does so for 1774–1800, 1800–1840, and 1774–1840. For the entire period 1774–1840, real per capita incomes in the three-region “nation” grew modestly, at 0.6 percent per annum. At such a premodern growth rate, it would have taken 116 years to double income.Footnote 37 Over those seven decades, the South Atlantic fell behind the per capita income of the east coast “nation,” while New England and the Middle Atlantic regions pulled ahead.
Between 1800 and 1840, however, per capita income in the North grew very fast, 2.3–2.4 percent per annum in New England, and 1.6–1.8 percent per annum in the Middle Atlantic, rates that are consistent with the 5 percent per annum industrial output growth centered in the Northeast (Davis 2004). These rates exceeded those in Western Europe in the late eighteenth century and early nineteenth. In contrast with fast growth in the Northeast, the figure for the South Atlantic was only 0.5–0.7 percent per annum, which pulls down the “national” average to a still impressive 1.4–1.6 percent per annum.
How do the new per capita income growth rates for 1800–1840 compare with those of other scholars? Our growth rate for the South Atlantic is 0.51–0.69 per annum, while Mancall, Rosenbloom, and Weiss estimate something similar for the Lower South, 0.53–0.79 percent. For the United States as a whole, Weiss offered three estimates, ranging between 0.56 and 0.80, far below David's estimate of 1.12–1.28 percent. Our estimates of 1.39–1.56 are even higher than David's,Footnote 38 though including farmers' residual profits in 1800 would have lowered our 1800–1840 rates a bit.
Table 6 suggests that this modest premodern growth performance was driven by two special events: Southern decline and the economic disaster associated with the Revolutionary War and Confederation turmoil.
The absolute decline of the South Atlantic over the last quarter of the eighteenth century and its relative decline over the next four decades stand out as a classic example of what has come to be called “a reversal of fortune.”Footnote 39 The South Atlantic was already well behind the Northeast and the national average by 1840, having been well ahead of all other regions in 1774. Supporting reversal of fortunes in the South is the absence of evidence that the colonial South had any large army of poor whites in 1774. We note again that the few local colonial censuses and tax records suggest that nearly all white households around 1774 had positive wealth. Why the reversal of fortune for the South? We do not yet know what weights to attach to the decline of frontier super-returns, institutional failure, or exceptionally severe damage incurred in the Revolutionary War.Footnote 40
Revolutionary Shocks: Diverted Trade and the Crisis at the Top
What stands out in the longer-run perspective is the economic turbulence between our two benchmark years 1774 and 1800, first with the war years themselves and then with the troubled Confederation in the 1780s. The last quarter of the eighteenth century found the economy on a rickety swinging bridge, a metaphor that also describes scholarly attempts to span that gap with numbers from what has been called a statistical dark age. Like late eighteenth-century France, early nineteenth-century Latin America, early twentieth century Russia, and late twentieth-century Africa, scholars of the early United States have had great difficulty bridging the data gap across their revolutionary upheaval and early nation-building. On the one hand, Thomas Berry (1968, 1988), Louis Johnston and Samuel Williamson (2010), Richard Sylla (2011), and others have emphasized the strong growth experienced across the 1790s, perhaps due to the wisdom of Alexander Hamilton and other founding fathers and/or due to the recovery of foreign markets. Yet, the more we come to accept their sanguine view of the 1790s, the more we must infer a true economic disaster between 1774 and 1790.
Any study attempting to measure incomes for 1774 and 1800 alone cannot quantify the depth of any economic depression in between. Yet, we can help guide the search for the magnitude of the Revolutionary war and postwar depression by posing a question: How deep would the per capita income loss have been from 1774 to 1790 if the scholars cited above are right about the growth from 1790 to 1800, and our estimates of the net decline from 1774 to 1800 are also right? This question has eight numerical conjectures, based on our two estimates for 1800 (“baseline” and “alternative”) times the four leading series documenting real income per capita growth from 1790 to 1800. The four series are those by Richard Sutch, Johnston and Williamson, Berry, and McCusker.Footnote 41 All eight conjectures imply significant drops in income per capita between 1774 and 1790. Between these two years, GDP per capita might have dropped 18 percent, based on Sutch and our alternative estimate for 1800. The largest estimated drop is 30 percent, based on Berry's series and our baseline estimate. The estimates seem to agree with McCusker and Russell Menard that, “Colonists paid a high cost for their freedom,” and with Allan Kulikoff that the drop in incomes was “equal to the early years of the Great Depression,” and with their consensus that recovery was painfully slow.Footnote 42
What could have caused such sustained income losses? There is good prima facie evidence that three related negative shocks could have been large enough to cause the deep depression between 1774 and 1790. The first was the economic destruction of the war itself, as well as the impact of nearly two decades of hyperinflation and a dysfunctional financial system. The second negative shock consisted of the disruptions of overseas trade during the Revolution and, after 1793, the Napoleonic Wars.Footnote 43 Available price and trade data show that the colonies, especially in the Lower South, suffered heavy volume and value losses in trade and shipping as the war deepened, and that they recovered only slowly and partially across the 1780s. In real per capita terms, New England's commodity exports rose by a trivial 1.2 percent between 1768–1772 and 1791/92, rose by a modest 9.9 percent in the Middle Atlantic, but fell by a spectacular 39.1 percent in the Upper South, and by an even bigger 49.7 percent in the Lower South (Mancall, Rosenbloom, and Weiss 2003) estimate an even larger 67 percent), yielding a decline of 24.4 percent for the thirteen colonies as a whole.Footnote 44 The most painful of these shocks was the loss of well over half of all trade with England between 1771 and 1791. In addition, America lost Imperial Bounties like those on the South's indigo and naval stores, as well as New England's reversal from colonial bounties to prohibitive duties on its whale oil exports.
While these negative demand shocks to American commodity exports were very large, especially for the Lower South, the initial share of exports in regional income was only about 6–7 percent in the early 1770s, according to the Shepherd-Walton export values per capita in 1768–1772 and our 1774 income estimates for the three main regions combined. Thus, it is hard to imagine that the huge depression of 1774–1790 was entirely “export-led”: A 24-percent trade fall times a 6–7 percent share of income equals no more than a 2 percent fall in income colony-wide. The numbers are bigger for the South, where exports fell by perhaps 45 percent and the trade share was 7.1 percent, implying an income loss of more than 3 percent. These calculations only deal with foreign trade losses; the trade losses would be considerably higher if they included the decline in intercolonial and subsequent interstate trade between 1774 and 1790. Finally, these negative trade shocks created a move back to subsistence farming, and presumably lower agricultural productivity.
The third major negative shock involved what we call a crisis at the top, and it was felt primarily in the coastal cities and smaller river towns. This shock was related to the trade losses, but transcended them and could have caused much greater income losses. America's urban centers were severely damaged by British naval attacks, blockades, occupation, and by the eventual departure of skilled and well-connected loyalists, especially from New York, Charleston, and Savanna. In Richard Hildreth's summary, “one large portion of the wealthy men of colonial times had been expatriated, and another part impoverished.”Footnote 45
The damage to urban economic activity was considerable, and potentially enough to bring great declines to per capita incomes, even though population kept growing. To identify the extent of the urban damage, one could start by noting that the combined share of Boston, New York City, Philadelphia, and Charleston in a growing national population shrank from 5.1 percent in 1774 to 2.7 percent in 1790, recovering only partially to 3.4 percent in 1800. To the extent that urbanization is a close correlate of levels of economic development, this big fall in the American city population share certainly confirms what our income estimates document. There is even stronger evidence confirming an urban crisis: the share of white-collar employment was 12.7 percent in 1774, but it fell to 8 percent in 1800; the ratio of earnings per free worker in urban jobs relative to that of total free workers dropped from 3.4 to 1.5; and the ratio of white-collar earnings per worker to that of total free workers fell even more, from 5.2 to 1.7. This evidence offers strong support for an urban crisis, and it also supports the view that America had not yet recovered from the Revolutionary economic disaster even by 1800.
AN EGALITARIAN COLONIAL AMERICA
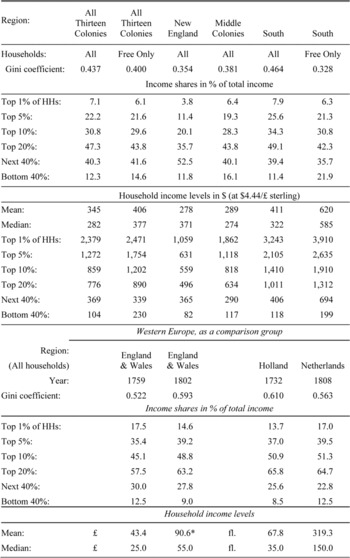
Incomes were more equally distributed in colonial America than in other places. Among all American households, slaves included, Table 7 reports that the richest 1 percent had only 7.1 percent of total income, and the Gini coefficient was 0.437. Without the slaves, the top 1 percent of free households had only 6.1 percent of total incomes, and the Gini was 0.400. Compare colonial American inequality with that of the United States today, where almost 20 percent of total income accrues to the top 1 percent, and where the Gini coefficient is about 0.5 (Atkinson, Piketty, and Saez 2011, table 5, p. 31). That colonial America was a more egalitarian place is even more apparent when we compare modern America with colonial New England (Gini 0.35), the Middle Atlantic (Gini 0.38), and, surprisingly, the free South (Gini 0.33).Footnote 46 Within any American colonial region, free citizens clearly had much more equal incomes than do today's Americans.
INEQUALITY IN THE AMERICAN COLONIES 1774

* £106.8 if we count government revenue, the king, and certain pensioners, listed separately by Colquhoun.
Notes:
See the Excel file “American incomes 1774,” where the Lorenz curves and inequality parameters are derived and compared on the last five worksheets. The inequality results in Table 7 are based on the full-time (FTE) measures of incomes at 313 days per year. Inequality would have been raised only slightly by using the part-time work year assumptions described above. For example, using the part-time work years would yield a thirteen-colony Gini coefficient of 0.440 for all households, or 0.408 for free households.
Free American colonists also had much more equal incomes than did West Europeans at that time. The average Gini for the four northwest European observations reported in Table 7 is 0.57, or 0.14 higher than the American colonies. Indeed, there was no documented place on the planet that had a more egalitarian distribution in the late eighteenth century.Footnote 47
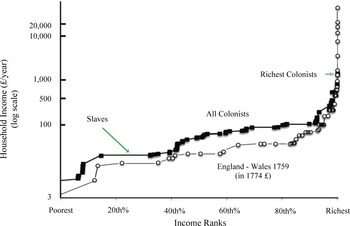
If people had more equal incomes in America than elsewhere, which kinds of colonists were better off than their counterparts in Europe? Figure 1 offers an Anglo-American comparison. On the horizontal axis, each society is ranked from its poorest to its richest, and on the vertical axis, their average group incomes are displayed in logarithms. It appears that an American colonist of any rank had a higher income than his or her English counterpart of the same rank until we reach the top percentile. Indeed, it turns out that even American slaves were above the bottom of the Anglo-American income ladder, although such comparisons fail to account for loss of freedom, longer hours worked, and harsher working conditions. As one might sense from Figure 1, colonial households as a whole had higher incomes than households in England and Wales. If one simply converted from dollars directly into sterling at the exchange rate of $4.44/£, colonial households averaged £78 each, versus about £50 per family in England and Wales, converting either the revised version of Massie's 1759 social table or that of Colquhoun's 1801–1803. At a first rough comparison, the American colonists had much higher incomes in 1774, as one might have guessed from the fact that so many English continued to risk the migration across the Atlantic. Yet the colonists may have temporarily lost their income lead by 1790. Their wartime depression combined with the slow growth of British GDP per capita in the last quarter of the eighteenth century, suggests as much.Footnote 48
COMPARING AMERICAN AND ENGLISH INCOME RANKS IN THE LATE EIGHTEENTH CENTURY

Future research needs to pursue the impact of relative purchasing power on such income comparisons. As is widely recognized, simple exchange rate conversion does not adequately account for cost of living differences between classes and places. This familiar point has a number of important applications in the colonial American context, and they deserve emphasis and further investigation. One is that the cost of a standard consumption bundle probably was lower in New England than it was either in the Southern colonies or in England and Wales. So say some recent calculations for this era. If true, then these nominal income contrasts might be somewhat misleading. Perhaps New England —with its cheap fish, corn, beans, rum, and molasses—was not so much poorer than the Southern colonies as the nominal figures in Table 7 imply. This might also have been true of the Middle Colonies with its cheap grains (exported to England where they were expensive: Mancall, Rosenbloom, and Weiss 2008b). In any case, such adjustments should also deal with the relative cost and quality of housing (Shammas 2007). Perhaps New England wasn't so much worse off relative to Southerners as our figures suggest, and perhaps workers in the Middle Atlantic were even better off compared with English workers than our figures suggest. On the other hand, an upper-class cost of living bundle, including the cost of music, theater, and servants, must have been lower in London than in the Northern colonies. These “real inequality” dimensions need to be explored further,Footnote 49 but we do not expect them to overturn the inequality contrasts shown here.
SUMMARY AND AGENDA
The only way to push back the quantitative frontiers of inequality and living standard history is to adapt to the data environments of the deep past. In the archeological extreme, that means accepting skeletal remains and DNA as our main forms of evidence. Even a journey back to the late eighteenth century must accept an eclectic array of incomplete evidence. One of the most underexploited frontiers for the early modern era is occupation counting, an approach which allows us to assemble aggregate incomes and their distribution among social classes. Working on that frontier, we have emerged with a rich harvest dealing with early American growth and inequality. It appears that the colonists had higher incomes in 1774 than previously thought. Between 1774 and 1800 American incomes declined in real per capita terms, so that any rapid growth after 1790 failed to make up for a very steep decline during wartime and early independence. In addition, we find that free American colonists had more equal incomes than did households in England and Wales. The colonists also had greater purchasing power than their English counterparts over all of the income ranks except at the top 1 percent, although this income advantage was lost in the fight for Independence.
Regional inequality was also an important feature of the American colonies. Our results suggest that Southern per capita income was far above the averages for other colonies in 1774, and that poor whites were much less common than in other colonies. It appears that the colonial South lacked the large numbers of poor whites that could be counted in Boston, Philadelphia, New York, and lesser coastal towns. In short, our results suggest that mass poverty did not spread among the Southern white population until the nineteenth century. Surely, the late colonial income distribution in the South needs further research of the sort already done for the Chesapeake.Footnote 50 In addition, it appears that the South Atlantic underwent a reversal of fortune between 1774 and 1840, dropping from being the richest American region to being the poorest. Why?
The research agenda for the future seems clear enough: more data, better ways of using the data, and new interpretations. We hope to have persuaded the reader just how powerful the social tables approach can be when data are scarce. Fortunately, they are getting a little less scarce as archives and the internet keep adding to the supply of usable information on occupations, earnings, and property income. We hope to have blazed the trail for additional work on early American incomes and by leaving behind an open-source data description and some provocative initial results.