Anaemia is a major contributor to the global burden of disease with a prevalence of 32·9 % as at 2010 and resulting in 68·4 million years lived with disability. Pregnant women and children under the age of 5 years in sub-Saharan Africa (SSA) are most commonly affected(Reference Kassebaum, Jasrasaria and Naghavi1). Common causes of anaemia are micronutrient deficiencies, infections such as malaria and HIV and inherited blood diseases(Reference Balarajan, Ramakrishnan and Özaltin2). Iron deficiency alone accounts for about half of all cases(Reference Kassebaum, Jasrasaria and Naghavi1). Certain social and cultural factors may also predispose to anaemia(Reference Semedo, Santos and Baião3). Among pregnant women, anaemia leads to reduced physical functioning and substantially increases the risk of maternal and perinatal mortality, preterm births and low birth weight(Reference Lynch, Pfeiffer and Georgieff4). Among children, anaemia is associated with increased risk of mortality and poor cognitive development(Reference Lynch, Pfeiffer and Georgieff4,Reference Georgieff5) . Among adolescent girls, anaemia is associated with impaired cognition and obstetric complications if the adolescent becomes pregnant(Reference Delisle, Chandra-Mouli and de Benoist6).
Over the last two decades, landmark studies(Reference Sazawal, Black and Ramsan7–Reference Prieto-Patron, Van der Horst and Hutton15) have significantly improved our understanding of the determinants and impact of anaemia or led to re-evaluation of the policies and guidelines relating to anaemia. There has also been increased recognition of the role of adolescent nutrition in delaying pregnancy and improving the health of pregnant women and children(Reference Sudfeld and Fawzi16). Iron supplementation, daily in pregnant women and weekly in adolescent girls, has been the mainstay of public health programming; however, uptake has remained stagnant at <10 % in most parts of Africa(Reference Haddad, Achadi and Bendech17). Adherence to supplementation tends to be poor(Reference Kamau, Mirie and Kimani18). Increased coverage for malaria control interventions has led to rapid decline in malaria burden(Reference Griffin, Bhatt and Sinka19), potentially influencing the distribution of anaemia across countries over time. Access to antiretroviral therapy has also improved greatly, leading to reduced HIV-related mortality and disease progression(Reference Yan, Bendavid and Korenromp20), an important determinant of anaemia in Africa. These changes have led to considerable changes in the prevalence of anaemia in some countries. For instance, the prevalence of anaemia among pregnant women in Zimbabwe was 43 % in 2005 and 32 % in 2015(21,22) . For optimal targeting of public health interventions and resources, it is important to understand this changing landscape, by characterizing patterns and drivers of spatio-temporal distribution of anaemia among pregnant women, adolescent girls and children, at regional, national and sub-national levels. Specifically, we are unaware of any recent study that examined the changes in the burden of anaemia across sub-Saharan African countries over time, while exploring the possible role of important clinical and socio-economic factors.
To fill this gap, we leveraged data from nationally representative Demographic and Health Surveys (DHS) conducted across SSA between 2000 and 2018 to investigate the spatial and temporal trends in average Hb concentrations in pre-school children, adolescent girls and pregnant women and to assess individual-level and household determinants of anaemia in these important demographic groups.
Methods
This was a multi-level analysis of cross-sectional nationally representative data from the DHS conducted between 2000 and 2018 in 32 countries in SSA. These surveys are conducted every 4–6 years, depending on the socio-political situation of the country. All African countries except the North African countries (Algeria, Egypt, Libya, Morocco, Sudan, Tunisia and Western Sahara) were regarded as being in the SSA region, as defined by the UN(23). In addition to the DHS, the Malaria Indicator Survey, another set of nationally representative surveys, were included. The Malaria Indicator Survey is based on a similar design as the DHS, but prioritise the collection of additional malaria-related data. These surveys are typically complex in design, with stratified two-stage sampling. Each country is divided into clusters selected in proportion to the population size and location (rural/urban). A complete listing of the households in each cluster serves as the sampling frame for the second stage. A systematic sampling is often done at this stage till a pre-specified number of households are interviewed in each cluster(Reference Corsi, Neuman and Finlay24).
These surveys collect a wide range of biomarkers and self-reported data in the areas of population, health and nutrition. Briefly, these include information on the household structure, urban/rural living, socio-economic factors such as wealth and education, demographic information and health behaviours. For children living in the household, anthropometry is done, and health outcomes data are collected. Detailed reproductive and fertility data of women of reproductive age are often collected. Biological samples are sometimes collected for biomarker testing. The DHS is designed, using standardised data collection procedures, to allow for comparability across multiple countries, with only limited changes over time. Response rate is usually very high(Reference Corsi, Neuman and Finlay24).
For this analysis, all DHS surveys conducted in SSA between 2000 and 2018 with Hb testing done was identified(Reference Sullivan, Mei and Grummer-Strawn25). Hb testing was done using the Hemocue blood Hb testing system using blood collected via finger prick for adolescents and women and heel prick for children(26). Unique survey ID were created to represent each country, survey, cluster, house and the individual. Three separate data sets for children under the age of 5, adolescent girls 15–19-years-old and pregnant women from the different countries and across multiple years were created. Variables were renamed and categorised as appropriate. The nesting structure of the data was considered in the analysis of the data – individuals nested in clusters, clusters nested in countries.
Hb concentrations adjusted by altitude were employed. Among pregnant women and children, anaemia was defined as Hb below 110 g/l(27,28) . Among older adolescent girls, anaemia was defined as Hb < 120 g/l. In all three population groups, anaemia was regarded as moderate to severe if Hb < 100 g/l(27,28) . Mean (±sd) of Hb concentration and the proportions (with 95 % confidence intervals) of participants with any anaemia and moderate to severe anaemia were estimated, accounting for the survey weights. In all cases where weights are used, the relevant weight specified for that individual in that survey was used – whether the survey was a DHS or Malaria Indicator Survey.
A scatter plot with Loess non-parametric smoothing was used to estimate the mean Hb level in SSA, over time, from 2000 to 2018 among pre-school children, adolescent girls and pregnant women. To provide an understanding of the burden of disease as well as make comparison across countries possible, bar charts were constructed for the average prevalence of anaemia in pre-school children, adolescents and pregnant women across various countries over the period of the study (2000–2018). The average prevalence of anaemia for the 2000–2018 period was also presented in maps to allow for visualisation of the spatial distribution and in smaller time periods: 2000–2005, 2006–2010, 2011–2015 and 2016–2018.
To predict the determinants of Hb concentration among both pre-school children, adolescent girls and pregnant women, we utilised multilevel mixed effects models which account for the clustering of these surveys by country and by year. Random effects were used to model various variables identified from prior studies to be important predictors of anaemia and Hb concentration. DHS survey weights were incorporated in the models to account for the unequal probability of selection into the survey. We specified Rwanda as the reference categories for country fixed effects due to its lowest prevalence of anaemia in the data set.
Model selection was purposeful – as a variation of the approach described by Hosmer and Lemeshow(Reference Hosmer, Lemeshow and Sturdivant29). A list of variables (below) with known or potential relationships with anaemia or Hb concentration were identified for inclusion in regression models based on published literature(Reference Nankinga and Aguta30–Reference Woodruff, Wirth and Ngnie-Teta40). Of these, variables that were significant at P < 0·25 in univariate models for the clinical outcomes were considered for inclusion(Reference Hosmer, Lemeshow and Sturdivant29). Selected variables were included in the multivariate models. Multiple modelling approaches were considered, varying the form of the covariates (continuous or categorical) to include, and whether to allow for random intercepts or random slopes models, or to introduce interaction terms. Model fit was evaluated using the likelihood ratio test and Akaike’s Information Criterion, depending on whether the alternative models were nested or not.
Variables considered for inclusion in the regression models for pregnant women, adolescents and children were household wealth index (in quintiles), the number of children in the household below 5 years (0 or 1, 2 or 3, > 3), place of residence (rural, urban), type of toilet or sanitary facilities (flush, pit and other/unsanitary), source of drinking water (piped, borehole, well, surface/rain, water tanker and bottled water), possession of a bed-net (yes, no), bed-net use the previous night (yes, no) and type of fuel used for cooking (electricity or gas, kerosene, coal/charcoal, wood/animal or plant residue and no cooking at home).
Variables considered for inclusion in the regression model for pregnant women only were age in years (15–< 20, 20–< 30, 30–< 40 and 40–49), duration of current pregnancy in months (≤ 3, 4–6 and > 6), iron supplement use (yes, no and not applicable), the number of antenatal visits (none, 1–3, 4–10 and > 10), educational attainment (none, primary, secondary, and higher), parity (0, 1–2, 3–4 and > 4).
Variables considered for inclusion in the regression model for adolescent girls were age in years (15–< 18, 18–20), pregnant (yes, no), educational attainment (none, primary, secondary, and higher), parity (0, 1–2, 3–4, > 4), and BMI z-scores (BMI–underweight, normal or healthy weight, overweight or obese). BMI z-scores were estimated based on the World Health Organization Growth Reference Standards(Reference De Onis, Onyango and Borghi41). BMI Z-scores were defined.
Variables considered for inclusion in the regression model for children were age in years (< 1, 1–< 3, > 3), sex (male, female), height-for-age Z-score (stunted i.e. HAZ < –2, not stunted), weight-for-height z-score (no wasting, i.e. WHZ ≥ –2, moderate wasting, i.e. WHZ –2 to < –3 and severe acute malnutrition, i.e. WHZ ≤ –3), maternal education (none, primary, secondary and higher).
The surveys were conducted by ICF Macro, Calverton, MD, USA, in conjunction with national statistical or related agencies. Anonymous deidentified data were obtained from ICF Macro and no further ethical approval was required. The data sets were originally obtained in SAS formats and prepared for analysis using SAS v.9·4 (SAS Institute Inc). The analysis was conducted in RStudio 1.0.153 with the lme4 and zscorer package(Reference Bates, Maechler and Bolker42,43) . P-values were two-sided, and significance was set at < 0·05. Values presented in the text are means (95 % CI), means (±se) and percent (95 % CI).
Results
Surveys from 33 countries conducted from 2000 to 2018 with 33 984 pregnant women, 83 122 adolescent girls and 397 577 preschool children were included in the analysis.
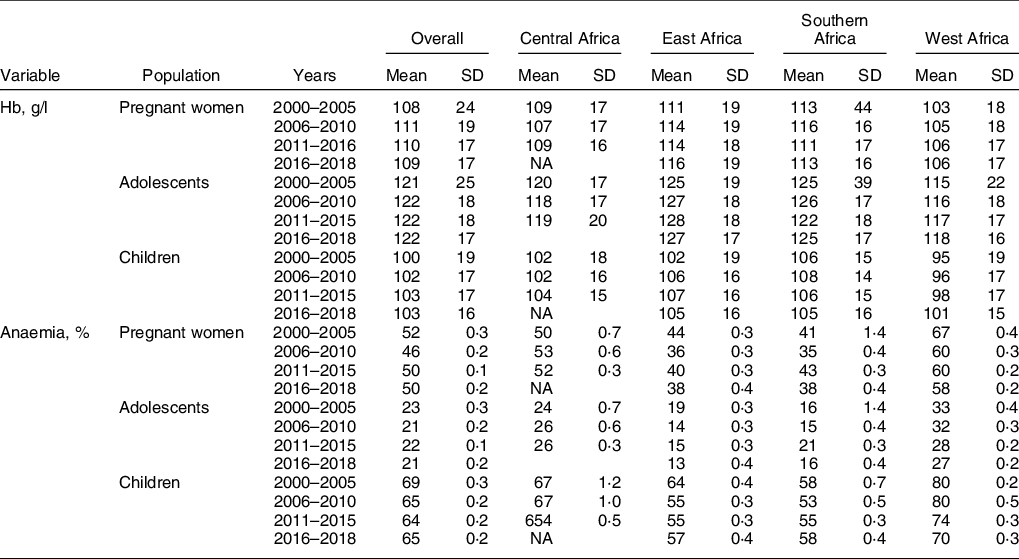
The burden of anaemia was substantial across all countries and all survey years. The prevalence of anaemia in 2016–2018 was 65, 21 and 50 % among children, adolescents and pregnant women respectively. Across the population subgroups, the overall mean Hb concentrations and anaemia prevalence were greatest in West Africa, compared to other sub-regions (Table 1).
Temporal and spatial change in Hb concentration and anaemia prevalence
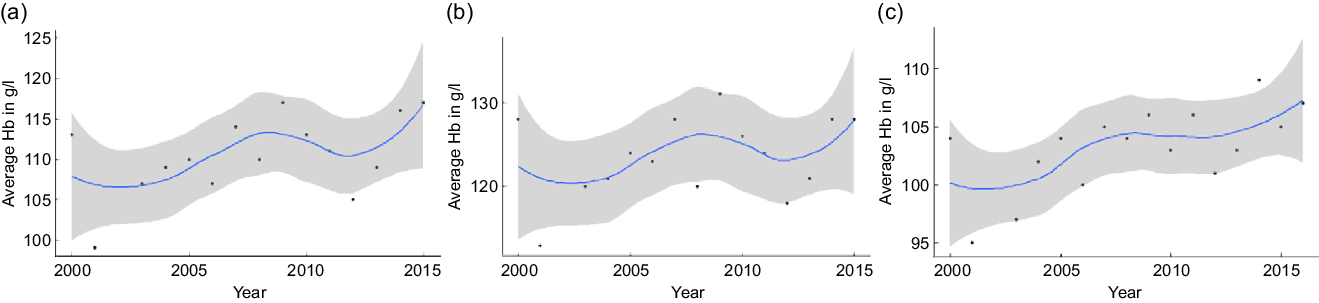
We estimated and plotted aggregate average Hb concentrations in SSA from 2000 to 2018 (Fig. 1). The smoothed mean Hb concentrations trended slightly upwards among children. Among pregnant women and adolescents, the mean Hb trended upwards to peak in 2008 and then reduced. From 2000 to 2018, the mean Hb increased from 108 g/l to 109 g/l among pregnant women, 121 g/l to 122 g/l among adolescent girls and 100 g/l to 103 g/l among children. The prevalence of anaemia reduced from 52 % to 50 % among pregnant women, from 23 % to 21 % among adolescent girls, and from 69 % to 65 % among children.
Aggregated Average Hb concentration among A) pregnant women, B) adolescent girls, and C) children in sub-Saharan Africa from 2000 to 2018
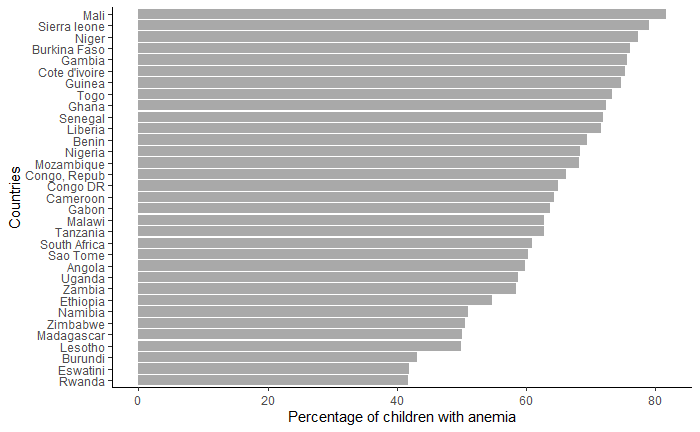
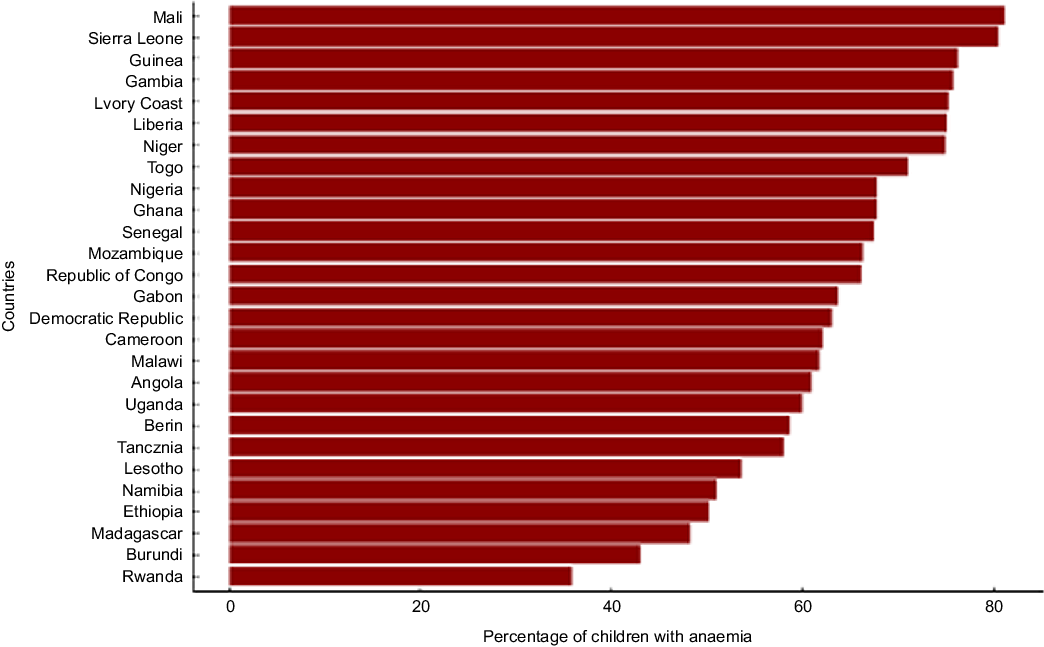
The prevalence of anaemia among children exceeded 30 % in all countries and all survey years (see online supplementary material, Supplemental Table 1, Figs 2 and 3). The aggregate prevalence of anaemia across all years was highest in Mali (> 80 %) and lowest in Eswatini and Rwanda (see online supplementary material, Supplemental Figure 1). In the most recent survey year for each country, the prevalence was highest (80 %) in Mali (2018), Liberia (2018) and Sierra Leone (2013). Notably, the burden of anaemia worsened substantially among children in Angola, Liberia and Mozambique during the survey years while the burden improved among children in Burkina Faso and Zimbabwe (see online supplementary material, Supplementary Table 1). The prevalence of anaemia worsened from 54 % in 2011 to 65 % in 2015 among children in Angola, from 65 % in 2009 to 80 % in 2018 among children in Liberia, and from 66 % in 2011 to 78 % in 2018 among children in Mozambique. The prevalence of anaemia improved from 91 % in 2003 to 58 % in 2018 among children in Burkina Faso, and from 58 % in 2005 to 38 % in 2015 among children in Zimbabwe.
Percentage of children who are anaemic by country in sub-Saharan Africa in the most recent survey for each country
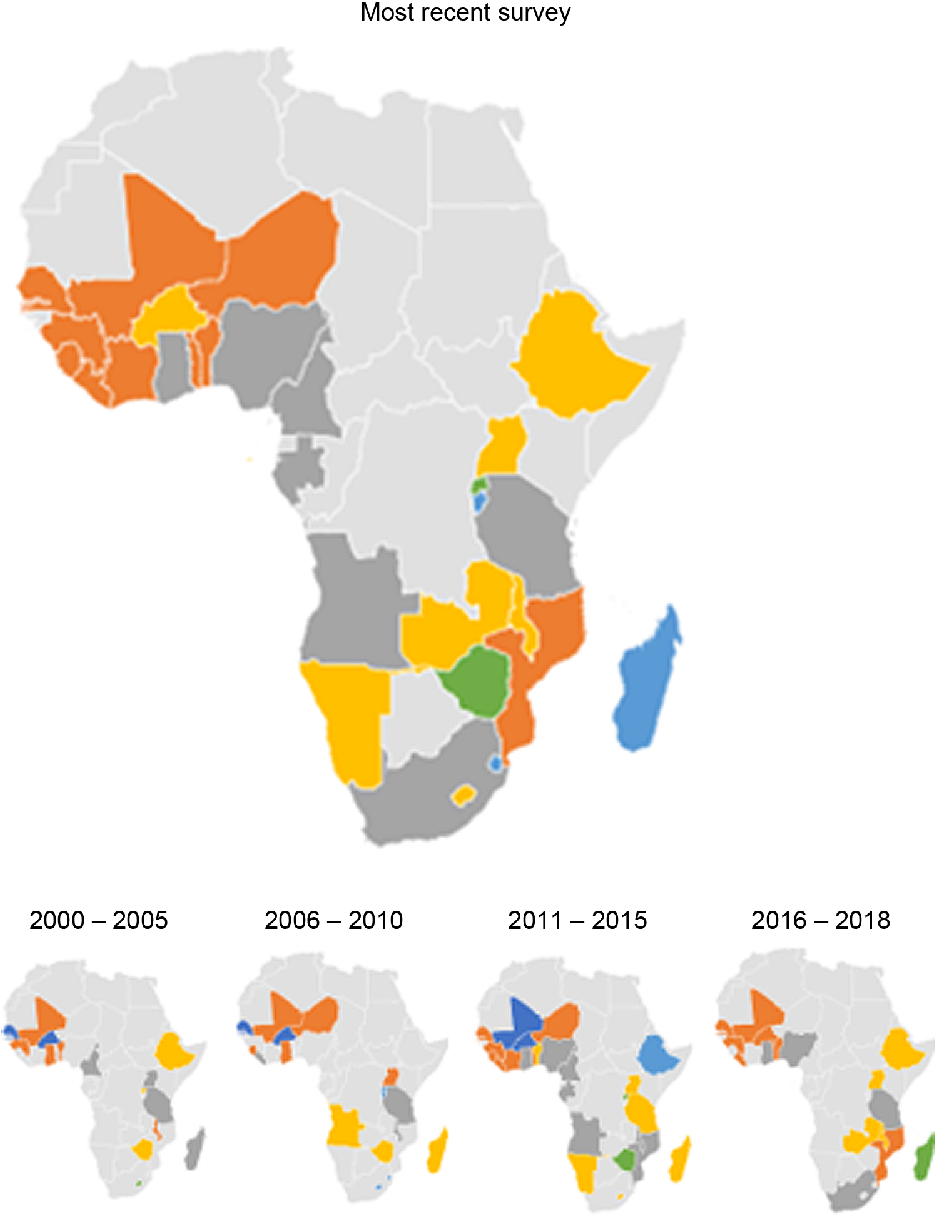
Map of Africa showing average Hb among children in sub-Saharan African countries, overall and across 5-year intervals.  , 31–40;
 , 41–50;
 , 51–60;
 , 61–70;
 , 71–80;
 , 81 and above
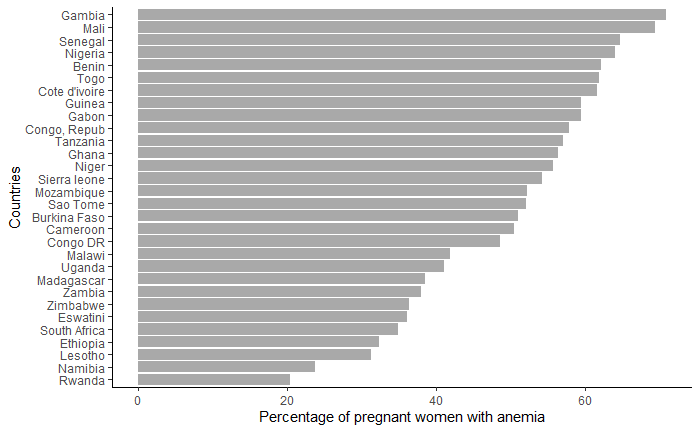
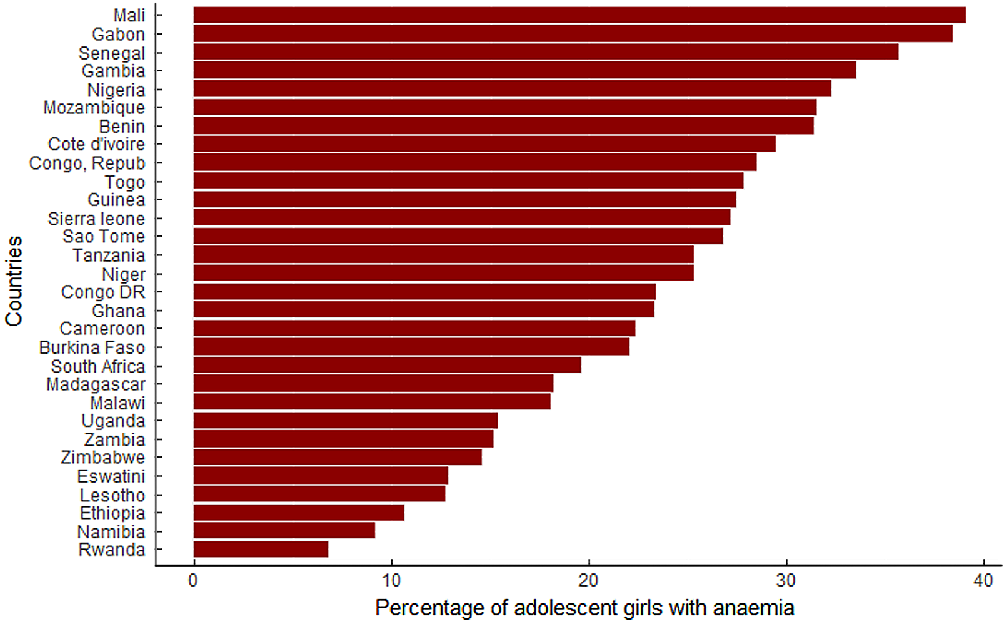
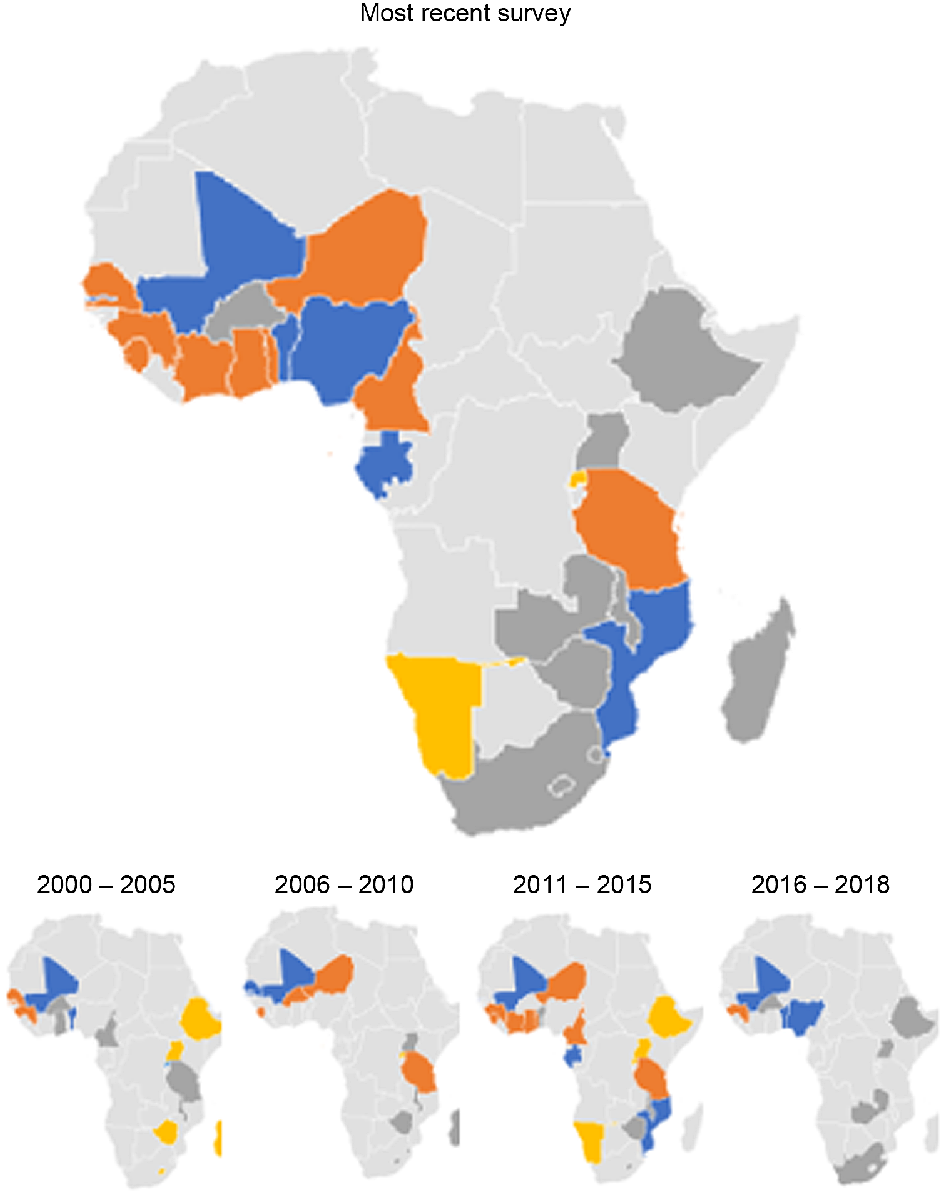
The prevalence of anaemia among pregnant women exceeded 20 % in all countries across all survey years, except in Rwanda (see online supplementary material, Supplemental Table 2, Figs 4 and 5). The aggregate prevalence of anaemia was highest in The Gambia (> 70 %) and lowest in Rwanda (20 %, see online supplementary material, Supplemental Figure 2). The prevalence of anaemia in the most recent survey for each country was also highest in The Gambia (71 %, in 2013) and lowest (22 %) in Rwanda. The prevalence of anaemia among pregnant women in Burkina Faso and Guinea reduced considerably–from 64 % in 2003 to 40 % in 2018 in Burkina Faso and from 66 % in 2003 to 48 % in 2018 in Guinea.
Percentage of pregnant women who are anaemic by country in sub-Saharan Africa in the most recent survey for each country
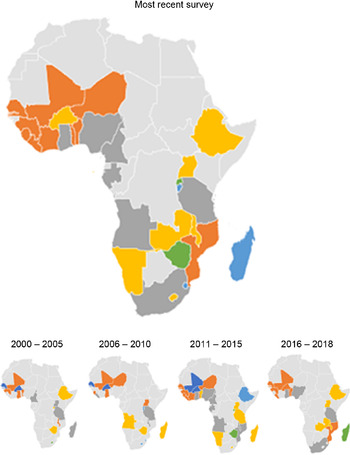
Map of Africa showing average Hb among pregnant women in sub-Saharan African countries, overall and across 5-year intervals. , 21–30; , 31–40; , 41–50; , 51–60; , 61–70; , 71 and above
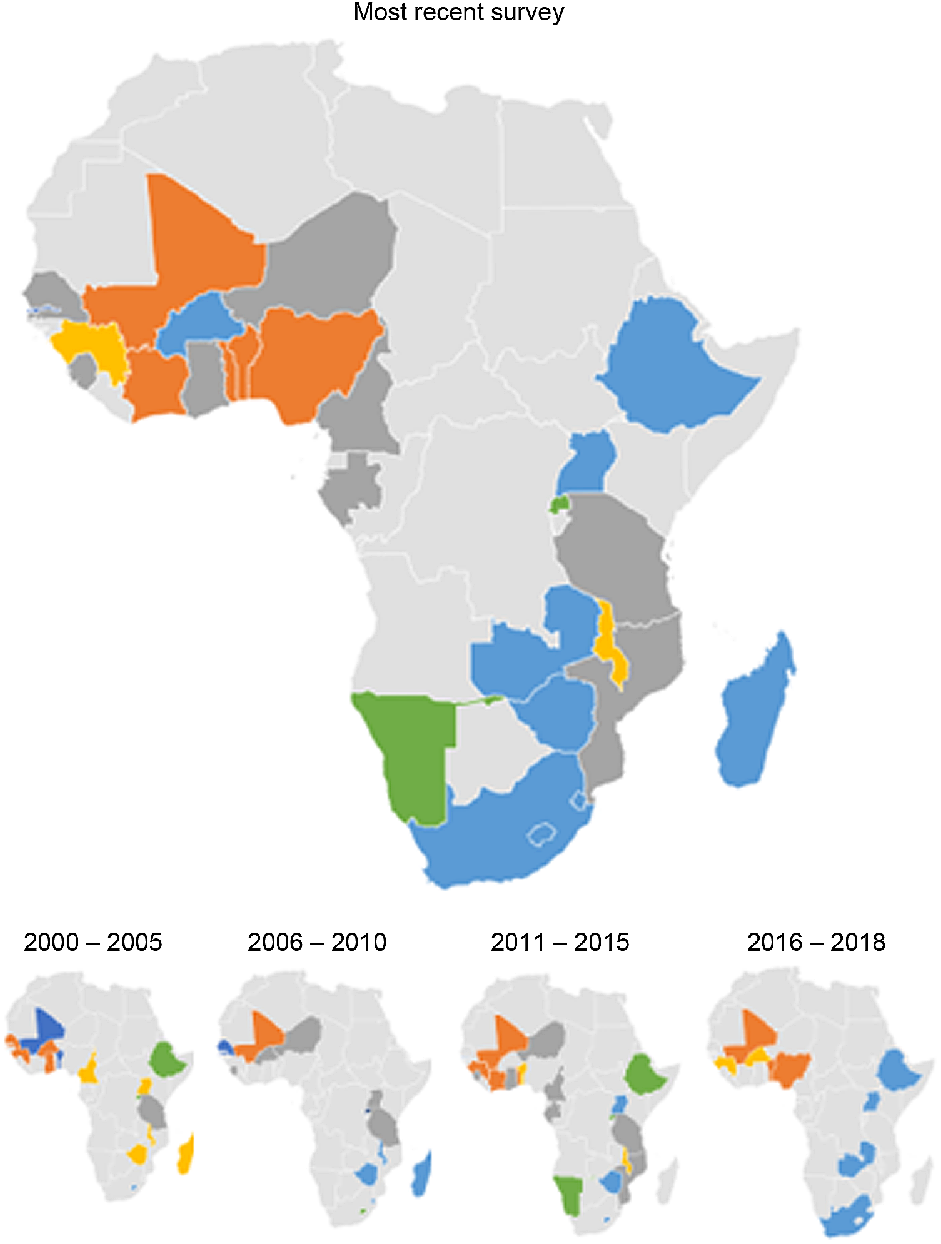
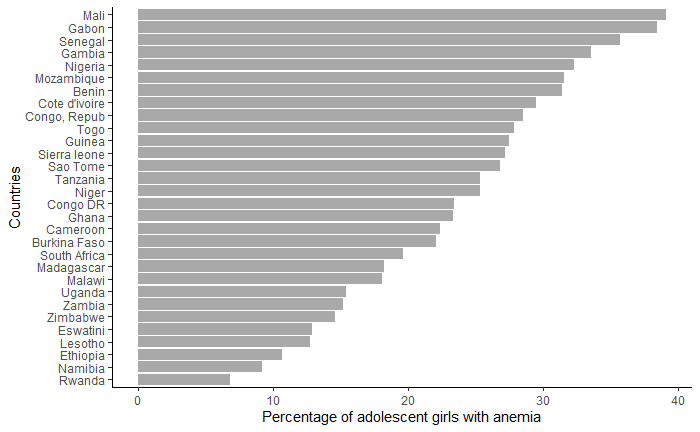
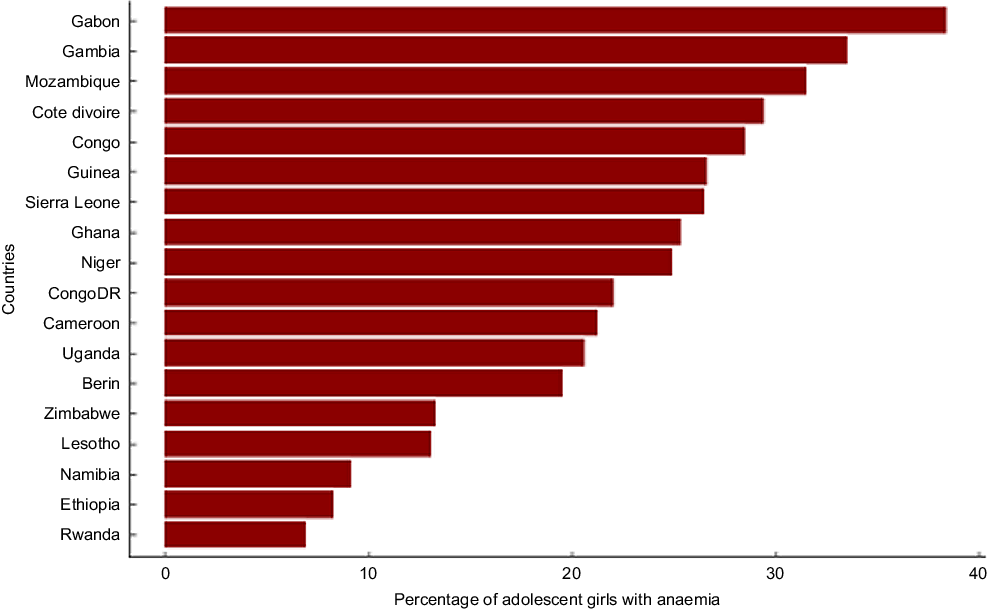
The prevalence of anaemia among older adolescent girls was ≥ 5 % in all countries and across all years (see online supplementary material, Supplemental Table 3, Figs 6 and 7). The aggregate prevalence of anaemia across all years was highest in Mali and lowest in Rwanda (see online supplementary material, Supplementary Figure 3). The prevalence of anaemia in the most recent survey for each country was highest (> 35 %) in Mali (2018) and Gabon (2012), and lowest (< 10 %) in Rwanda (2014) and Namibia (2013). The prevalence of anaemia reduced considerably from 44 % in 2001 to 33 % in 2017 among adolescents in Benin and from 29 % in 2003 to 18 % in 2018.
Percentage of adolescent girls (15–19 years) who are anaemic by country in sub-Saharan Africa in the most recent survey for each country
Map of Africa showing average Hb among older adolescent girls in sub-Saharan African countries, overall and across 5-year intervals. , 5–10; , 11–20; , 21–30; , 31–40
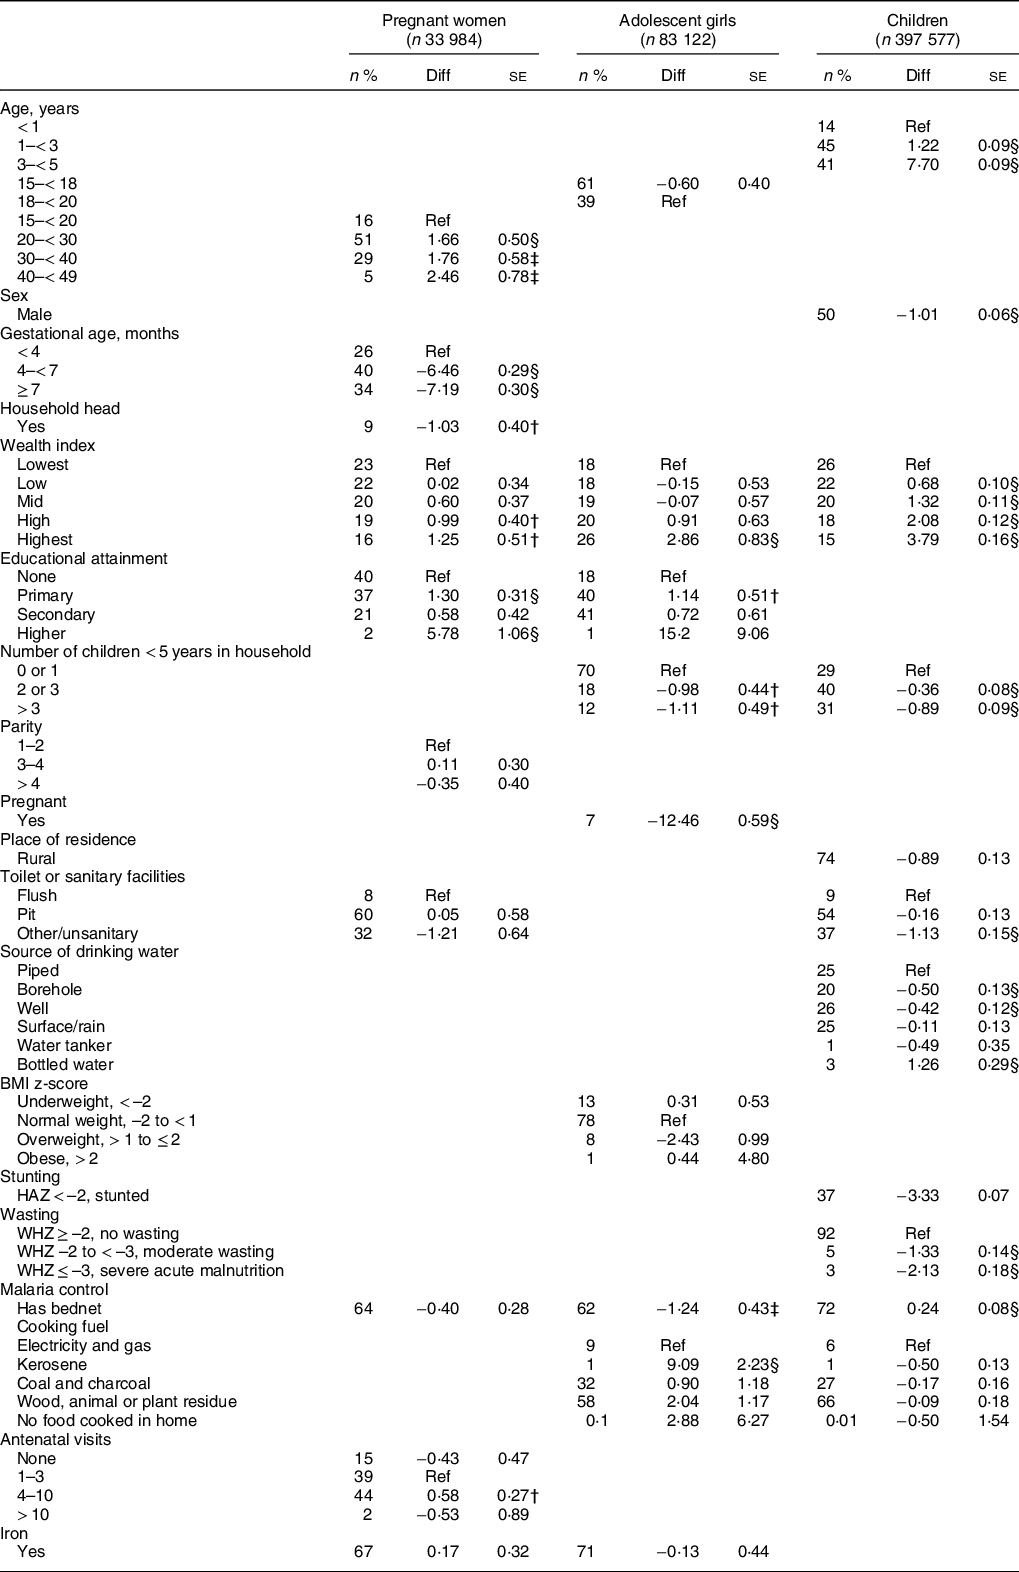
Age (in years) and gestational age were the most important factors associated with Hb concentration among pregnant women (Table 2). Compared to pregnant adolescents aged 15–19 years, the Hb concentration among women aged 20–30 years, 30–40 years and 40–49 years were higher by 1·7 g/l (95 % CI: 0·7, 2·6), 1·8 g/l (95 % CI: 0·6, 2·9) and 2·5 g/l (0·9–4·0), respectively. Hb concentration was substantially lower with advancing gestation. The mean difference of the second and third trimesters compared to the first were –6·5 g/l (95 % CI: –7·0, –5·9) and –7·2 g/l (–7·8, –6·6), respectively.
Regression models to predict Hb concentration*
* Linear mixed effects regression models were estimated to predict Hb concentration, in g/l.
P-values were denoted with asterisks as follows
† < 0·05.
‡ < 0·01.
§ < 0·001.
Being the head of the household, level of education completed and antenatal clinic attendance were also significantly related to Hb concentration among pregnant women (Table 2). Pregnant women who were heads of their household had a lower Hb concentration compared with those who were not (Mean difference: –1·0 g/l (95 % CI: –1·8, 0·2). Compared to women who completed no formal education, women who completed primary education had a 1·0 g/l (95 % CI: 0·4, 1·6) higher Hb concentration and women who completed higher education had a 5·8 g/l (95 % CI: 3·7, 7·9) higher Hb concentration. Pregnant women who had attended no antenatal clinic visits in the current pregnancy had a lower Hb concentration compared to those who had attended 4–10 visits (Mean difference: 0·6 g/l (95 % CI: 0·1, 1·1). Iron supplement use was not significantly associated with the Hb concentration (mean difference: 0·2 g/l; 95 % CI: –0·5, 0·8) and there was no data on how regular iron supplement use was.
Among adolescents, being pregnant was the most important factor related to Hb concentration (Table 2). Pregnant adolescents had 12·5 g/l (95 % CI: 11·3, 13·6) lower Hb concentration compared to non-pregnant adolescents. In addition, educational attainment, number of children < 5 years in the household, socio-economic and nutritional status were also significant factors. The Hb concentration of adolescents in the highest wealth quintile was higher than those in the lowest quintile by 2·9 g/l (95 % CI: 1·2, 4·5). Adolescents who were overweight had −2·4 g/l lower Hb concentration than those who were of normal BMI (95 % CI: −0·5, −4·4). Adolescents with at least primary education had higher Hb concentration than those with no educational level completed. Adolescents who live in homes with 2 or more children < 5 years old had 1·0 g/l lower Hb concentration and the Hb concentration was slightly worse when there were > 3 children.
The direction of some other factors identified among adolescents to be significantly related to Hb concentration were contrary to expectation (Table 2). For instance, adolescents from homes that cooked with electricity and gas had 9·1 g/l (95 % CI: 4·7, 13·5) lower Hb concentration than those who cooked with kerosene, or other cooking fuels. Also, adolescents who had bed-nets had 1·2 g/l lower Hb than those who did not (95 % CI: 0·4, 2·1).
Age, malaria prevention, water and sanitation indicators were some important factors related to Hb concentration among children (Table 2) Hb concentration was lowest in infants and children aged 3–5 years had 7·7 g/l (95 % CI: 7·5, 7·9) greater Hb concentration. Children who had bed-nets had 0·2 g/l (95 % CI: 0·1, 0·4) higher Hb concentration compared to those who did not. Children who lived in homes without toilets or sanitary facilities had 0·8 g/l (95 % CI: 0·4, 1·2) lower Hb concentration than those who had flush toilets in their homes. Compared to homes with pipe borne water, children from households with drinking water from boreholes and wells, and water tankers had lower Hb concentration, while children from households that drink bottled water had a higher Hb concentration. Socioeconomic status, birth-spacing and nutritional status were also related to Hb concentration among children. The Hb concentration of children in the highest wealth quintile was higher than those in the lowest quintile by 3·8 g/l (95 % CI: 3·5, 4·1). Also, the greater the number of children < 5 years in a household, the lower the Hb concentration of children and adolescents in that household. Children who were stunted (HAZ < –2), moderately wasted (WHZ –2 to –3) or who had severe acute malnutrition (WHZ ≤ –3) had 3·3 g/l (3·2–3·4), 1·3 g/l (1·1–1·6), and 2·1 g/l (1·8–2·5) lower Hb concentration, respectively, compared to their counterparts.
Discussion
Using multilevel modelling, we estimated the mean Hb concentration across 33 countries in SSA and examined spatial and temporal trends in Hb concentration and anaemia prevalence. Our analysis demonstrates the Hb concentration and anaemia risk did not considerably improve over the two decades across much of Africa, and the burden of anaemia among children remains exceedingly high. We also examined individual and household level predictors of Hb concentration and found that socioeconomic status, nutritional status, adolescent pregnancy, antenatal care, access to water resources, sanitation, and hygiene (WASH) explained the spatial and temporal variation in Hb concentration across SSA.
Optimal targeting of policy and programmatic interventions requires timely evaluation of regional, national and sub-national spatio-temporal trends in the burden of diseases, and an updated understanding of the role of public health determinants and interventions in shaping these trends. In this analysis of nationally representative data sets, we found that while the burden of anaemia among pregnant women and adolescent girls improved and then worsened slightly, anaemia in children remains very high – 60 % prevalence in 2016 to 2018. The most common cause of anaemia globally is iron deficiency, and it often results from inadequate intake of iron-rich foods in a setting of increased demands for growth and metabolism. During pregnancy, a widespread cause of iron deficiency anaemia is the lack of iron supplementation or of adherence to it. Addressing the burden of iron deficiency would require simple but effective public health programs at scale. Iron supplementation is effective to prevent and treat iron deficiency anaemia, but its coverage is dismal(Reference Haddad, Achadi and Bendech17). Only 12 % of children in our analysis were taking iron tablets, sprinkles, or syrups, despite policy consensus that it is safe and beneficial in the context of good malaria prevention(Reference Hamdan, Brabin and Bates44). Iron deficiency anaemia among children is associated with poor cognitive and psychomotor development among children, with substantial impact over the course of the child’s life(Reference Georgieff5).
Addressing anaemia among women of reproductive age – including older adolescents – may prevent a considerable proportion of childhood anaemia. Infants are born with iron stores that typically last them 4–6 months, particularly if their mothers are not severely iron deficient(Reference Lynch, Pfeiffer and Georgieff4). Infants of iron-deficient mothers experience faster depletion of their iron stores, if the diets they are weaned on do not provide sufficient amounts of dietary iron(Reference Lynch, Pfeiffer and Georgieff4). Our analysis confirms the value of antenatal clinic visits as great opportunities to deliver a package of interventions to prevent and treat maternal anaemia. Surprisingly, iron supplementation was not significantly associated with Hb concentration among pregnant women. Iron supplementation improves Hb concentration considerably if duration of use exceeds 90 d during pregnancy(Reference Abioye, Aboud and Premji45). Unfortunately, adherence to iron supplementation tends to be poor. Ensuring that pregnant women commence antenatal care early in the first trimester, receive or buy iron supplements regularly, and use them for > 90 d may be helpful for maximum impact(Reference Haddad, Achadi and Bendech17,Reference Abioye, Aboud and Premji45) . Patient education may be associated with successful adoption of better complementary feeding practices(Reference Arikpo, Edet and Chibuzor46).
The impact of infections on the occurrence of anaemia in developing country settings is well-documented(Reference Lynch, Pfeiffer and Georgieff4). Among children, besides clinical diarrhoea, gut inflammation from parasitic infestations such as hookworm and schistosomiasis, as well as subclinical microbial infections, are important in this regard. We observed that certain sources of drinking water and the use of unsanitary toilet facilities were associated with lower Hb concentration among children in these surveys. From our analysis, a male infant who drinks water from a well and uses unsanitary toilet facilities may have a 3 g/l lower Hb concentration on average compared to his counterparts from the same country. Severe malaria infection in children also frequently leads to severe anaemia, with a high risk of mortality if not properly treated. Owning a bed-net was associated with a higher Hb concentration among children in these surveys. Efforts to eradicate malaria, and to improve access to safe drinking water and sanitary facilities will likely have tremendous impact on anaemia risk among children in Africa.
Nutritional status significantly predicted Hb concentration among pregnant women, adolescents, and children. Stunting and wasting frequently co-occur with anaemia in the context of poor socioeconomic condition and endemic infections(Reference Lynch, Pfeiffer and Georgieff4). In fact, the relationship of undernutrition and anaemia is likely causal. Like anaemia, stunting is also known to be related to poor cognitive development(Reference Estrada, Contreras and Pliego-Rivero47). Stunting and wasting remain very common among children in SSA, and account for 15 and 13 % of total deaths of children < 5 years globally(Reference Black, Victora and Walker48). Overweight was associated with increased occurrence of anaemia, potentially signalling the impact of poor quality energy-dense diets on anaemia risk in the context of global nutrition transition. Well-designed nutritional approaches leading to intake of high quality diverse diets would likely prevent all these conditions simultaneously and effectively. For instance, a combined homestead food production and behaviour change communication program in Burkina Faso led to marginally significant reduction in Hb concentration and wasting(Reference Olney, Pedehombga and Ruel49). Notably, we found that Hb concentration was lower among adolescents and children in households with 2 or more children < 5 years, potentially due to competition for limited food resources(Reference Dush50,Reference Bomela51) . Food insecurity is common in these settings due to rationing, making food-based interventions critical to consider.
We found that approximately 21 % of older adolescent girls in sub-Saharan African countries were anaemic in the period from 2016–2018. This has substantial implications for the cognitive function of the girls. Studies conducted among adolescent girls in Jamaica have shown that performance in school may be impaired by iron deficiency and anaemia(Reference Walker, Grantham-McGregor and Himes52,Reference Walker, Grantham-McGregor and Himes53) . Also, pregnancy was common among adolescents (7 %), and 16 % of all pregnant women were adolescents. Pregnant adolescents had a 14 g/l lower Hb concentration compared to non-pregnant ones in our analysis. Pregnancy may increase micronutrient demands due to fetal growth while also worsening irregular eating(Reference Delisle, Chandra-Mouli and de Benoist6). Pregnancy among adolescents may be associated with an increased risk of preterm births, low birth weight and obstetric complications(Reference Delisle, Chandra-Mouli and de Benoist6). In addition, women who become pregnant during adolescence are more likely to have large families, and their offspring are more likely to be stunted, perform poorly in school and have behavioural problems(Reference Buvinic54). Programs that promote dietary diversity along with the delay of sexual debut and the uptake of contraception are therefore essential features of adolescent nutrition programs. Our analysis also makes a strong case that micronutrient supplementation programs aimed at ensuring adequate preconception nutrition should begin in late adolescence.
Our finding of relatively low anaemia prevalence in Rwanda is remarkable. This finding is likely to be a result of a combination of all the approaches discussed above – improving diet quality, control of malaria and helminth infections, and coverage for micronutrient supplementation. Use of insecticide treated nets and exclusive breastfeeding during the first six months are high in Rwanda. In addition, approximately 87 % of Rwandans have access to health insurance – typically through community based schemes(Reference Chemouni55). Robust health financing and universal health coverage improves access to primary healthcare for the most vulnerable in the population considerably, and primary healthcare is an excellent vehicle for the sustainable delivery of nutritional and infection control interventions(Reference Bitton, Ratcliffe and Veillard56).
West Africa had the greatest prevalence of anaemia across all population groups – but the greatest disparity was among children. First, feeding practices are likely the key factors driving this regional disparity. Exclusive breast-feeding rates are extremely low in West Africa. Less than 20 % of infants < 6 months in most West African communities were exclusively breastfed between 2000 and 2017, compared with > 50 % in East Africa(Reference Bhattacharjee, Schaeffer and Marczak57,Reference Agho, Ezeh and Ghimire58) . Data on intake of iron-rich foods among children were not available for most of the surveys. Second, the incidence of malaria was higher in certain West African countries such as Burkina Faso and Cote d’ivoire than in most of East Africa during the period between 2000 and 2017, though the overall burden is trending lower. Coverage for bed-net use and antimalaria treatment tends to be lower in West Africa(Reference Gething, Casey and Weiss59).
Our study was limited by the irregularity in the conduct of the DHS surveys and Hb testing. The generalisability of the findings of this study may be limited to African countries south of the Sahara. We were also limited by the type of variables available from the DHS surveys and were unable to examine some of the very important causes of anaemia. For instance, in most surveys, malaria testing was restricted to individuals for whom a febrile illness was suspected. HIV testing was also done in a subset of participants. We also did not examine population-level factors that may be related to the prevalence of anaemia such as coverage for antiretroviral therapy.
There are noteworthy strengths of this analysis. First, by using individual-level data, this analysis avoids the limits of population-level interpretation that bedevil ecological studies. Second, Hb testing was based on the same well-standardised method, limiting any potential bias due to outcome ascertainment across countries or regions, or over time.
Our manuscript has important policy implications. First, anaemia continues to be an important public health problem in all countries of SSA, among population groups considered – with the highest burden in West Africa. Concerted action to address this challenge is particularly important. Second, the burden of anaemia in children, especially among infants and toddlers, is particularly high, suggesting a need to deploy interventions targeted at this age group. Third, stunting and wasting can be important indices for selecting children for targeted interventions. Fourth, providing access to pipe-borne water and safe toilet facilities has the potential to reduce anaemia prevalence in many communities considerably. Fifth, adolescent anaemia may be considerably addressed by preventing adolescent pregnancy through abstinence and contraception programme and delaying marriage beyond the teenage years. Finally, strategies for integrating micronutrient supplementation into primary healthcare and improving adherence need to implemented more effectively(Reference Omotayo60–Reference Omotayo, Martin and Stoltzfus62).
Conclusion
The burden of anaemia in SSA has not improved materially over the past two decades, although there is substantial variability in the prevalence and trajectory among the different countries. Access to improved water, sanitation and hygiene services, ante-natal care attendance and socio-economic status are key determinants of spatiotemporal variation of anaemia in SSA, important to different extents in the key population groups. These factors should be the focus of evidence-based interventions.
Acknowledgements
Acknowledgements: Not applicable. Financial support: None. Conflict of interest: A.A.I., W.K., O.C.L., O.M.O.: No conflicts of interest. Authorship: All authors contributed to formulating the research questions, designing the study, analysing the data and writing the article. O.M.O. had the responsibility for the final decision to submit the manuscript. Ethics of human subject participation: This study was based on analysis of publicly available data sets.
Supplementary material
For supplementary material accompanying this paper visit https://doi.org/10.1017/S1368980020004620