


INTRODUCTION
The role of police unions as a powerful interest group has attracted increasing scrutiny in the U.S. media and in public discourse. The common perception is that “in many cities [
$ \dots $
 ] police unions are a political force, their endorsements and campaign donations coveted by both Republicans and Democrats. The legislation they support tends to get passed, their candidates elected” (Finnegan Reference Finnegan2020). At the same time, high-profile cases of police brutality have contributed to putting police conduct and potentially excessive spending on police departments under the spotlight. As highlighted in a recent New York Times article, the political influence of police unions is considered a significant impediment to reforming the police system, with police unions emerging as “one of the most significant roadblocks to change” (Scheiber, Stockman, and David Goodman Reference Scheiber, Stockman and David Goodman2020). In the words of Levin (Reference Levin2020, 1333), “in an era of declining labor power, police unions stand as a success story.”
Despite the pressing importance of these issues, scholars have largely overlooked how police unions influence policing and municipal budget decisions (Anzia Reference Anzia2022b). As a result, we know little about how frequently police unions engage in local politics or how effective their political activity is (DiSalvo Reference DiSalvo2022), despite evidence that local public employees and their unions rank among the most politically active groups in U.S. local politics (Anzia and Trounstine Reference Anzia and Trounstine2025). More broadly, little is known about the role of interest groups in local campaign finance (Anzia Reference Anzia2022a; Kaplan and Naidu Reference Kaplan and Naidu2025). A major obstacle to empirical research in this area has been the lack of comprehensive data on police union involvement in local politics (Anzia Reference Anzia2022b; DiSalvo Reference DiSalvo2022).
In this article, we make progress on this front in three ways. First, we present the first large-scale dataset on local campaign finance in U.S. mayoral elections. The data cover 1,073 cities and 2,303 elections between 2001 and 2019, for which we manually identified all donations from a police union. Second, we leverage this new dataset to provide a detailed descriptive portrait of police union involvement in local elections, documenting the extent of their participation in financing mayoral campaigns, as well as the candidate and city characteristics associated with greater support. Third, exploiting within-city variation in the election of a candidate backed by police unions, we causally identify the influence of police unions on the size and compensation of police departments, and on police performance, complementing extensive qualitative work and case studies on the topic (Bies Reference Bies2017; DiSalvo Reference DiSalvo2015; Epp Reference Epp2010; Levin Reference Levin2020).
Police union involvement in mayoral campaign finance is both frequent and targeted. Police unions donate in 44% of the elections in our sample above 200,000 people, and in one quarter of elections between 60,000 and 200,000 people, while their involvement decreases monotonically for smaller cities. Police unions are active when compared to other groups of donors, with their involvement being higher than that of teachers’ unions and somewhat lower than that of firefighters’ unions. More broadly, public sector unions—including police—rank among the top three categories of donors in local elections, alongside construction firms and real estate developers. Police union contributions are also highly targeted, with unions supporting only one of the top two candidates in 93% of races. Police unions are more likely to support winning candidates and incumbents, consistent with an “investor” model of political giving (Bonica Reference Bonica2016). In head-to-head contests between Democrats and Republicans, police unions are equally likely to support candidates from either party. In addition, we find that city institutional characteristics affect the likelihood of police union involvement, with more donations in cities with a mayor-council form of government and nonpartisan elections.
We study how electing a mayor who received donations from a police union affects police spending and performance. We interpret our treatment as a compound measure that captures both influence-seeking and preference-alignment strategies, whereby unions donate either to cultivate access or to support candidates aligned with their policy goals.Footnote 1 We theorize that electing a police-union-backed mayor increases the likelihood of higher police spending, as unions pursue greater influence within fiscal constraints. Regarding performance, the effect is ambiguous. On the one side, performance might improve thanks to the additional resources of police departments (a resource effect), provided that changes in their allocation do not dilute their impact. On the other side, officer effort could be affected by the election of a police-union-backed mayor (an effort effect). Effort could decrease if officers expect favorable treatment regardless of performance, or it could increase because of a morale effect or because of strategic effort to support an aligned mayor.Footnote 2 We complement our local campaign finance dataset with information on the size and compensation of police departments, for both sworn officers and civilian employees, as well as with several measures of police performance. This extensive set of outcomes allows us to test the full set of empirical predictions that stem from the theoretical framework.
Leveraging a within-city design that accounts for heterogeneous treatment effects in the presence of staggered treatment timing, we identify a large effect of the election of a police-union-backed mayor on the size of the police department: cities electing these mayors experience a sizable increase in police employment, consistent with our theoretical expectation that unions seek to expand staffing as a means of increasing influence. However, we find no evidence that these additional resources improve police performance. This pattern is consistent with a positive resource effect being offset by a negative effort effect, or with limited marginal returns to additional police staffing. Additional tests suggest that both influence-seeking and preference-alignment strategies arguably play a role in explaining the association between police union donations and the increase in police employment.
This article makes two primary contributions. First, we present new evidence on two longstanding questions on public sector unions and local politics: (i) the extent and determinants of police union involvement in local elections and (ii) what is the impact of police unions’ political involvement on policy. Our findings underscore the influential role of public sector unions—and interest groups more broadly—in shaping local policy outcomes. Second, we introduce newly collected data on campaign contributions to mayoral elections in the United States. These data open avenues for future research on a broad set of local interest groups.
This article contributes to two main strands of literature. First, we bring new evidence on the budgetary and policy impact of police unions. We complement DiSalvo (Reference DiSalvo2015) by bringing new data to quantitatively assess the relationship he describes between police union involvement in local politics and police spending. Police unions can affect policy outcomes through two avenues: collective bargaining and politics. Anzia and Moe (Reference Anzia and Moe2015) and DiSalvo and Kucik (Reference DiSalvo and Kucik2018) focus on the former, showing a positive relationship between collective bargaining and spending on police. We focus on the latter, bringing new data that allow us to provide causal evidence to inform the debate on the relevance of police unions in city politics.Footnote 3 Gaudette (Reference Gaudette2025) shows that police union endorsements send clear signals to voters about mayoral candidates’ ideology. While no other study has looked at police unions’ political activity, a literature on the determinants of police performance is emerging. Grumbach, Mickey, and Ziblatt (Reference Grumbach, Mickey and Ziblatt2025) highlight the relevance of political-institutional features of U.S. politics in explaining the low performance of American police. Wirsching (Reference Wirsching2026) shows that NYPD police officers reduce effort in districts of nonaligned city councilors.Footnote 4 A number of studies have investigated the impact of unionization and collective bargaining on police productivity, finding mixed findings (Bies Reference Bies2017; Cunningham, Feir, and Gillezeau Reference Cunningham, Feir and Gillezeau2021; Goncalves Reference Goncalves2021).Footnote 5 More broadly, our findings highlight the relevance of unions as political actors, contributing to a renewed scholarly focus on their role in shaping political representation and policy outcomes (Ahlquist Reference Ahlquist2017; Becher and Stegmueller Reference Becher and Stegmueller2026; Fouirnaies Reference Fouirnaies2026; Frymer and Grumbach Reference Frymer and Grumbach2021; Kaplan and Naidu Reference Kaplan and Naidu2025; Kim and Margalit Reference Kim and Margalit2017).
Second, we contribute to a large body of work looking at local interest groups’ political activity. Our article is most closely related to Anzia (Reference Anzia2022b), who provides the first comprehensive assessment of interest groups’ political activity at the local level in the United States. We complement her work in several ways, especially by providing an alternative and not self-reported measure of interest groups involvement, and by focusing on police unions specifically.Footnote 6 As noted by DiSalvo (Reference DiSalvo2022), a research agenda on public sector unions has emerged (Anzia and Moe Reference Anzia and Moe2015; Reference Anzia and Moe2019; DiSalvo Reference DiSalvo2015; DiSalvo and Kucik Reference DiSalvo and Kucik2018; Hartney and Flavin Reference Hartney and Flavin2011; Hartney and Kogan Reference Hartney and Kogan2025; Hertel-Fernandez Reference Hertel-Fernandez2018; Moe Reference Moe2011; Reference Moe2015; Paglayan Reference Paglayan2019), but it has mostly focused on teachers unions. Due to paucity of data, large-scale empirical studies of the effects of interest groups’ political activity at the local level are few, with the exception of a growing body of work on real estate developers (Gaudette and de Benedictis-Kessner Reference Gaudette and de Benedictis-Kessner2024; Ouasbaa, Solé-Ollé, and Viladecans-Marsal Reference Ouasbaa, Solé-Ollé and Viladecans-Marsal2022; Yu Reference Yu2022).Footnote 7
THEORETICAL EXPECTATIONS
Interpreting Police Union Donations
We study the consequences of electing a mayor who is backed by a police union, defined as a candidate who receives a campaign contribution from a police union. Throughout the article, we treat police union donations as a strong signal of organizational support—functionally similar to an endorsement—given that unions donate to only one of the top two candidates in 93% of races. At the same time, we emphasize the analytical value of focusing on donations rather than formal endorsements. Donations are typically less visible to the broader electorate and may operate as what we term an inward-facing endorsement: a signal directed toward the candidate and the police workforce rather than toward voters. This form of support may be especially consequential in contests where Democratic candidates—whose electoral coalitions may be skeptical of police unions—quietly accept union contributions while avoiding the potential backlash associated with a public endorsement. This dynamic aligns with findings from Gaudette (Reference Gaudette2025), who shows that voters often interpret police union endorsements as signaling a Republican affiliation, likely due to the partisan composition of police forces themselves (Ba et al. Reference Ba, Ge, Kaplan, Knox, Komisarchik, Lanzalotto and Mariman2025; Goncalves and Tuttle Reference Goncalves and Tuttle2024).
Police unions pursue two distinct objectives through their political engagement. The first is influence-seeking: donations intended to cultivate access to, or leverage over, the eventual officeholder, regardless of prior policy alignment. The second is preference alignment: support for candidates who are ex ante more closely aligned with the union’s policy priorities, with the aim of increasing their electoral success. As in much of the literature on interest-group political activity—where donations are taken as given and identification derives from which candidate ultimately wins rather than from exogenous variation in contributions—our treatment should be understood as a compound one that may reflect both channels (Fowler, Garro, and Spenkuch Reference Fowler, Garro and Spenkuch2020; Gulzar, Ladino, and Riaño Reference Gulzar, Ladino and Riaño2025; Harding et al. Reference Harding, Prem, Ruiz and Vargas2024; Ruiz Reference Ruiz2017).
We attempt to empirically distinguish between these mechanisms by examining donation patterns that are more consistent with influence-seeking and those more indicative of preference alignment. This distinction is consequential because the two channels yield different empirical interpretations and policy implications. When interpreted through an influence-seeking lens, our estimates speak directly to campaign finance policy, shedding light on how outcomes might differ had the mayor not received police union donations. Interpreted through a preference-alignment lens, our results instead capture the consequences of electing a candidate whose policy positions already align with police union preferences. Both interpretations are substantively important, but they imply distinct mechanisms through which police unions may shape local governance and, in turn, different policy implications.
Police Spending
A natural starting point for theorizing about police budgets is to consider the institutional interests of police departments. All else equal, police prefer higher levels of public spending on policing, whether through increased compensation or expanded staffing. Realizing these preferences requires bargaining with municipal governments. To enhance their leverage in this bargaining process, police can organize collectively, most commonly through unions (Anzia and Moe Reference Anzia and Moe2015). Indeed, protective service workers—among them police officers—rank among the most highly unionized occupational groups in the United States (Bureau of Labor Statistics 2025), with police unionization rates around 80% in some states (Goncalves Reference Goncalves2021). While unionization facilitates direct negotiation over compensation and working conditions, police unions can also exert influence through the political arena (Anzia Reference Anzia2022b; DeLord and York Reference DeLord and York2017; Kaplan and Naidu Reference Kaplan and Naidu2025). In particular, they can shape the electoral environment in ways that enhance their ability to secure favorable policy outcomes. As described in the previous section, two complementary strategies are available. Under influence-seeking, unions provide endorsements or campaign contributions to cultivate access to candidates who, once in office, may deliver increased police funding regardless of their prior positions over police funding. Under preference alignment, unions strategically support candidates who are ex ante more closely aligned with their preferences for greater police resources.
What should we expect when a police-union-backed candidate is elected? The theoretical logic is straightforward: police unions prefer higher spending on law enforcement, while local governments face binding budget constraints. The election of a union-backed mayor increases the likelihood that the preferences of the police will be represented more directly in the budgeting process. As a result, we expect total police spending to increase following the election of a candidate supported by the police union.
Disaggregating total police spending into its two main components—compensation and employment—leads to less clear-cut expectations. On the one hand, police officers have a clear interest in higher compensation, and unions are generally responsive to these demands. This responsiveness is reinforced by the competitive landscape of police union representation: unlike more centralized labor organizations, local police unions are fragmented across affiliations, such as AFSCME, SEIU, the Fraternal Order of Police, and the International Union of Police Associations (Kearney and Mareschal Reference Kearney and Mareschal2017). On the other hand, unions also have an institutional incentive to expand police employment. A larger force increases potential membership, thereby enhancing the union’s political and organizational power. Ideally, unions would pursue both higher wages and greater employment, but they must operate within the fiscal limits imposed by municipal budgets. As Anzia and Moe (Reference Anzia and Moe2015) point out, unions often confront a trade-off between maximizing benefits for current members and expanding their organizational influence. The extent to which they prioritize one goal over the other is ultimately an empirical question. However, because compensation is typically renegotiated only at discrete intervals, tied to the expiration of collective bargaining agreements, we expect the more immediate and flexible margin of adjustment to be employment. Thus, we anticipate stronger and more observable effects on police staffing levels than on compensation in the short run.
Police unions, like other public sector unions, prioritize personnel policies as their core area of influence (DiSalvo Reference DiSalvo2022). While this includes wages, a substantial and often underappreciated component involves fringe benefits—such as health insurance, pensions, and other post-employment compensation. These forms of compensation are less visible to voters than wages and thus attract less political scrutiny (Anzia and Moe Reference Anzia and Moe2015; Hunter and Rankin Reference Hunter and Rankin1988). Public sector unions are therefore incentivized to emphasize benefits over wages in bargaining, exploiting what Bawn et al. (Reference Bawn, Cohen, Karol, Masket, Noel and Zaller2012) term an “electoral blind spot.” This logic suggests that the most pronounced policy effects of electing union-backed candidates are likely to emerge in the domain of benefits. Although our data do not allow us to directly test this proposition, we will present suggestive evidence consistent with this expectation.
Police Performance
To theorize the potential impact of a police-union-backed mayor on police performance, we draw on the literature on ideological alignment between politicians and bureaucrats (here, the mayor as the political principal and the police as the bureaucratic agents). This literature emphasizes that alignment can shape bureaucratic behavior, but it does not deliver unambiguous predictions about performance: the direction of the effect depends on the mechanisms through which alignment operates.
Police performance depends on two core inputs. First, performance is positively related to the resources available to the police department, such as personnel, equipment, and funding. Second, performance depends on the effort exerted by police officers in carrying out their duties. The election of a police-union-backed mayor can therefore affect police performance through its impact on police resources (a resource effect) and on officer effort (an effort effect).
If a union-backed mayor allocates greater resources to the police department, performance may improve through a resource effect: holding officer effort constant, increased funding and staffing can enhance operational capacity and effectiveness. This channel generates a positive prediction for police performance. An alternative version of the resource effect, however, arises when police unions seek not additional resources per se but specific rules governing their allocation. This may blunt the performance gains associated with higher spending. A prominent example is the negotiation of seniority-based assignment protections, which give more experienced officers priority over desirable deployments and shifts, while concentrating newer officers in the most challenging neighborhoods or assignments (Ba et al. Reference Ba, Bayer, Rim, Rivera and Sidibé2021; DiSalvo Reference DiSalvo2020; Rushin Reference Rushin2017). Under this alternative version of the resource effect, increased resources may fail to translate into improved performance.
The effect of a union-backed mayor on officer effort, however, is theoretically ambiguous. The effort effect may be positive or negative, depending on the underlying mechanism. We highlight three mechanisms that yield distinct predictions.
First, police unions may use political support—such as campaign donations or endorsements—as a substitute for job performance. Under this mechanism, the election of a union-backed mayor weakens officers’ incentives to exert effort, leading to lower performance. If favorable outcomes (e.g., higher compensation or expanded staffing) can be secured through political loyalty rather than demonstrated effectiveness, officers have less reason to signal their value through performance. This logic echoes political science models of pay-to-play and interest-group capture, in which material political support is exchanged for favorable treatment even in the absence of strong performance. While no existing study directly examines this dynamic for bureaucrats, a growing empirical literature on non-bureaucratic public service providers shows that political donations can reduce accountability pressures, making performance less central as a source of leverage (e.g., Colonnelli, Prem, and Teso Reference Colonnelli, Prem and Teso2020; Fazekas, Ferrali, and Wachs Reference Fazekas, Ferrali and Wachs2023; Gulzar, Ladino, and Riaño Reference Gulzar, Ladino and Riaño2025; Harding et al. Reference Harding, Prem, Ruiz and Vargas2024; McCarty and Sumner Reference McCarty and Sumner2024; Ruiz Reference Ruiz2017). Related evidence in Foy (Reference Foy2024) shows that teachers perform better following union decertification, suggesting that union power can dampen individual effort incentives. Like campaign contributions, unionization can strengthen bureaucrats’ bargaining power vis-à-vis elected officials, potentially substituting political influence for performance. This mechanism is also consistent with theories of clientelism, which emphasize that material political support, such as endorsements or donations, can serve as a substitute for programmatic effectiveness in winning political favor (Hicken Reference Hicken2011; Kitschelt and Wilkinson Reference Kitschelt and Wilkinson2007).
At the same time, two alternative mechanisms predict an increase in officer effort following the election of a union-backed mayor. First, ideological alignment may generate a morale effect: officers may exert greater effort when governed by a mayor who shares their values or vision for policing (Besley and Ghatak Reference Besley and Ghatak2005; Spenkuch, Teso, and Guo Reference Spenkuch, Teso and Xu2023). Second, police may engage in strategic effort, increasing performance to bolster the electoral prospects of a politically aligned mayor. As Moe (Reference Moe2012) observes, this channel is largely absent from formal models of bureaucratic behavior, likely because bureaucratic performance is often not directly observable to voters. Police departments constitute an important exception. Police officers are the largest group of municipal employees (Bee and Moulton Reference Bee and Moulton2015), and their highly visible, street-level activities make their performance electorally salient. Emerging empirical evidence supports the plausibility of this channel; for example, Wirsching (Reference Wirsching2026) documents pervasive strategic shirking and heightened effort within the NYPD aimed at diminishing or improving the electoral prospects of city councilors according to their support for police budgets.
In sum, the effect of electing a police-union-financed mayor on police performance depends on how such an election shapes both the resources allocated to the police department and the effort exerted by police personnel. The net effect is therefore an empirical question, determined by the relative strength of these competing mechanisms in the institutional and political context we study.
A NEW DATASET ON POLICE UNIONS’ DONATIONS IN LOCAL ELECTIONS
To investigate the influence of police unions’ donations in local politics, we construct a novel dataset (Carreri, Teso, and Yu Reference Carreri, Teso and Yu2026) that combines information from multiple sources: (i) campaign contributions in local elections, (ii) candidate characteristics and electoral outcomes, (iii) municipal budgets and public employment data, and (iv) crime rates and policing outcomes. This section provides a summary of the data construction process; comprehensive details are available in the “Data” section of the Supplementary Material.
Local Campaign Finance Data
A persistent challenge in the study of campaign finance in U.S. local elections has been the lack of comprehensive and standardized data on political donations. A central contribution of this article is the construction of a new dataset covering a large number of mayoral elections across the United States between 2001 and 2019. We focus on elections in which at least one of the top two candidates—the winner or the runner-up—received campaign contributions. For these elections, we collect information on donations received by the two leading candidates in the two years preceding each election.Footnote 8
Our dataset draws on two primary sources. First, we compile data from campaign finance databases maintained by seven states: Connecticut, Iowa, Illinois, Oregon, South Carolina, Virginia, and Washington. These databases include detailed records of monetary contributions, in-kind contributions, and loans made to political committees supporting candidates in various local elections. We match political committees to the candidates they supported and extract donation data for the top two candidates in mayoral contests. The “Data” section of the Supplementary Material provides detailed information on the data collection procedures and sources for each of these seven states. Second, we incorporate data from Yu (Reference Yu2022), which contains hand-collected records of mayoral campaign contributions in 36 additional states. This dataset was assembled from original campaign disclosure reports housed in local government offices, municipal archives, and boards of elections. By combining these two sources, we construct a comprehensive dataset covering 2,303 mayoral elections in 1,073 cities.
For the purpose of this article, we exclude 34 cities that do not have municipal police departments. Our final sample comprises 2,249 elections across 1,039 cities in 43 states, involving 3,251 unique candidates and 709,687 individual donations.
Table 1 provides a breakdown of the dataset by state. An important strength of our data is its broad coverage across municipalities of varying sizes. The smallest jurisdiction in the sample is Pawleys Island, South Carolina, with a population of 106 as of the 2017 election; the largest is New York City. Figure 1 illustrates the distribution of covered elections by population size, highlighting the dataset’s capacity to capture electoral dynamics in both small and large urban contexts.
Summary of the Contributions Data for Each State

Table 1. Long description
The table contains 9 columns: State, Elections, Cities, Candidates, Donations, Earliest year, Latest year, Minimum population, and Maximum population.
Key data points include:
* C A: 151 elections, 89 cities, 259 candidates, 157,039 donations, spanning 2001 to 2018, with populations from 5,133 to 3,975,788.
* I L: 752 elections, 262 cities, 934 candidates, 103,549 donations, spanning 2001 to 2019, with populations from 562 to 2,819,117.
* N Y: 50 elections, 25 cities, 82 candidates, 46,851 donations, spanning 2007 to 2017, with populations from 6,732 to 8,396,091.
* S C: 307 elections, 147 cities, 416 candidates, 29,027 donations, spanning 2007 to 2019, with the smallest minimum population of 106.
* W A: 141 elections, 57 cities, 215 candidates, 64,951 donations, spanning 2001 to 2019.
Other states listed with smaller datasets include A K, A R, A Z, C O, C T, F L, G A, I A, I D, I N, K S, K Y, L A, M A, M D, M E, M I, M N, M O, M S, N C, N D, N E, N H, N J, N M, N V, O H, O K, O R, P A, R I, S D, T N, T X, U T, V A, and W I.
The final row for All states totals 2,249 elections, 1,039 cities, 3,251 candidates, and 709,687 donations across the entire period from 2001 to 2019.
Note: Number of elections, cities, candidates, and donations covered by our local campaign finance dataset, together with the earliest and latest election year and minimum and maximum population for each state.
Number of Elections in the Contributions Data, by Population
Note: The figure shows the number of elections covered by our local campaign finance dataset in each of the population brackets on the
$ x $
 -axis. The population of a city is measured in the year of the election.

For each election, we observe the candidate’s name, the election date, the name of each contributor (whether an individual or an organization), and the amount donated. As described in the following sections, we further enrich this dataset by merging it with additional sources of information.
Identifying Donations by Police Unions
To identify campaign contributions made by police unions, we implement a two-step process combining automated keyword detection with manual verification.
First, we apply a string-matching algorithm to the names of contributors recorded in the campaign finance data. This automated step uses a set of predefined keywords—“Police,” “Detectives,” “Sergeants,” “Lieutenants,” and “Captains”—to flag contributions plausibly originating from police-affiliated organizations. The goal of this step is to capture a broad set of potential police union donors while minimizing false negatives. We then manually review the flagged entries to remove contributions erroneously attributed to police unions.
Second, we conduct a comprehensive manual review of all remaining contributor names to identify additional police union donations potentially missed by the keyword filter. This step allows us to account for naming irregularities, acronyms, and idiosyncratic spellings that may obscure police union affiliations.Footnote 9 To guide this process, we conduct targeted searches of known police unions across the cities and states represented in our dataset, which informed additional keywords and the identification of acronyms.
By combining systematic detection with human oversight informed by local context and naming conventions, this two-step approach reduces both Type I and Type II errors in classification. As a result, the final set of identified police union donations achieves a high degree of accuracy and reliability, which is critical for the validity of our empirical analysis.
Elections, Candidates’ and Institutional Characteristics
We augment the campaign finance data with information on election outcomes and candidate characteristics. Specifically, for each election, we collect data on: (i) the vote share and total number of votes received by the top two candidates, (ii) the candidate’s partisan affiliation, (iii) the incumbency status of each candidate, and (iv) municipal characteristics.
Election results are assembled from a combination of sources. We first incorporate data from Ferreira and Gyourko (Reference Ferreira and Gyourko2009), Jerch, Kahn, and Li (Reference Jerch, Kahn and Li2017), and de Benedictis-Kessner et al. (Reference de Benedictis-Kessner, Da In Lee, Velez and Warshaw2023). For cities not included in these datasets, we collect results directly from county and city election offices, often via official websites. When these are unavailable, we consult newspaper archives to retrieve historical election outcomes.Footnote 10
Identifying candidates’ partisan affiliations presents a particular challenge in nonpartisan elections, where formal party labels do not appear on the ballot. In order to identify the partisan leaning of the candidates in these elections, we rely on a combination of sources, including local newspaper coverage, candidate websites, and official documents. We also examine whether candidates had previously contested partisan elections or received formal party endorsements within a proximate time window. Full details on this coding process are provided in the “Data” section of the Supplementary Material.
We classify approximately 26% of the candidates in our sample as Democrats, 20% as Republicans, 12% as independents, and 9% as affiliated with other parties. The remaining 33% could not be reliably classified due to insufficient public information on their partisan alignment.
Finally, we obtain information on the form of government from the International City and County Management Association’s (ICMA) Municipal Form of Government Surveys (ICMA 2018). Since not all cities are surveyed in every wave, we assign to each election the form of government recorded in the most recent survey year in which the city was included.Footnote 11
Municipal Budgets, Municipal Public Employment, and Crime Outcomes
We further enrich our dataset with city-year-level variables measuring the size and compensation of police departments, and public safety outcomes.
First, we obtain data on police department staffing from the Law Enforcement Officers Killed and Assaulted (LEOKA) dataset. This source provides annual figures on the number of personnel employed by each law enforcement agency, disaggregated into sworn officers and civilian employees.Footnote 12
Second, we use data from the FBI’s Uniform Crime Reporting (UCR) Program to measure crime incidence and clearance rates. Specifically, we calculate the number of reported index crimes per capita—separately for violent and property crimes—as well as the share of these offenses cleared by the police. In addition, we include the number of arrests for non-index crimes, also expressed as a share of the municipality’s population.Footnote 13 Data from the Uniform Crime Reports (UCR) are widely used in studies of crime in U.S. cities. A well-known limitation, however, is that these data are self-reported by local police agencies to the FBI. As Cook and Fortunato (Reference Cook and Fortunato2023) show, reporting error in the UCR is systematic rather than random and varies with state legislative capacity. Our empirical strategy mitigates this concern by relying on within-state comparisons, which absorb cross-state differences in reporting institutions. Nevertheless, we remain cautious in interpreting estimates that rely on UCR outcomes, given the potential for residual measurement error.Footnote 14
Third, we draw on the U.S. Census Bureau’s Annual Survey of Public Employment and Payroll (ASPEP) (U.S. Census Bureau 2025) to capture compensation levels in police departments. The ASPEP provides data on the total number of police personnel and the aggregate gross monthly wage bill, with separate figures for sworn officers and civilian employees. The wage bill includes all gross salaries, wages, fees, commissions, and overtime paid to employees, as well as incentive payments that are paid at regular pay intervals. It excludes the employer share of fringe benefits. We compute the average wage by dividing total payroll by the number of employees within each category. Due to the survey’s structure, however, wage data are only available for most cities at five-year intervals, resulting in lower temporal resolution relative to the other sources.Footnote 15
DESCRIPTIVE PATTERNS IN POLICE UNIONS’ DONATIONS IN LOCAL ELECTIONS
This section presents descriptive evidence on three dimensions: (i) the extent of police union involvement in mayoral campaign financing, (ii) the types of candidates most likely to receive their support, and (iii) the institutional characteristics that drive union involvement.
Police unions make campaign contributions in 233 out of the 2,249 mayoral elections in our sample, representing 10.4% of races. In the vast majority of these instances (93%), police unions contribute to only one of the top two candidates. For comparison, Carreri, Teso, and Yu (Reference Carreri, Teso and Yu2024) report donation rates of 15.7% and 5.9% for firefighter and teachers’ unions, respectively.Footnote 16 Overall, public sector unions rank among the top three categories of donors in municipal races, alongside construction businesses and real estate developers. The median amount of an individual police union donation is $500—comparable to the median contribution from other committees and larger than the median contribution from individual donors ($200). Aggregating all police union donations within an election, the median total contribution rises to $1,000, with a mean of approximately $3,250.
Figure 2 documents a strong relationship between city size and the likelihood of police union contributions. The share of elections with union donations rises monotonically with population. While police unions are rarely active in municipalities with fewer than 10,000 residents, the probability of contribution increases to 3.5% in cities with 10,000–20,000 residents, 5% in those with 20,000–30,000, 8% for 30,000–40,000, and 14% for 40,000–60,000. In cities with populations between 60,000 and 200,000, police unions contribute in approximately one-quarter of elections, and in 44% of races in cities above 200,000. As shown in Figure A1 in the Supplementary Material, this relationship is approximately linear in log population: a 10% increase in population size is associated with a 0.75 percentage-point increase in the probability of a police union contribution. Police unions contribute substantially more in larger cities, donating an average of $4,143 in cities with more than 50,000 residents, compared to $1,080 in cities with fewer than 50,000 residents. However, because overall campaign finance activity by individuals and interest groups is lower in smaller cities, police union donations constitute a larger share of total campaign contributions in those contexts. When police unions are active, they account for 2.7% of all donations in cities with fewer than 50,000 residents, compared to 1.6% in cities with more than 50,000 residents.
Share of Elections with Police Unions’ Donations by Population Bracket
Note: The figure shows the share of elections in each bracket of city population (indicated on the
$ x $
 -axis) in which police unions donate to one of the top two mayoral candidates. Population is measured in the year of the election.

Figure 2. Long description
The vertical y-axis is labeled Share of Elections and ranges from 0 to 40 in increments of 10. The horizontal x-axis lists nine population brackets from left to right. The data shows a consistent upward trend as population increases.
* Less than 5 K: approximately 1 percent.
* 5 to 10 K: approximately 1 percent.
* 10 to 20 K: approximately 4 percent.
* 20 to 30 K: approximately 5 percent.
* 30 to 40 K: approximately 8 percent.
* 40 to 60 K: approximately 14 percent.
* 60 to 100 K: approximately 26 percent.
* 100 to 200 K: approximately 27 percent.
* Greater than 200 K: approximately 44 percent.
The bars are solid dark green and the chart includes horizontal grid lines at every 10-unit interval on the y-axis.
Table 2 examines which candidate (in panel A) and city characteristics (in panel B) correlate with receiving police union support.Footnote 17 The unit of analysis for results presented in panel A is the candidate-election, and all specifications include election fixed effects, allowing for within-race comparisons. Column 1 shows that police unions are significantly more likely to support the winning candidate. This pattern is consistent with an “investor” model of campaign contributions, in which donors seek to back likely winners in order to secure future returns—mirroring patterns observed in corporate PAC behavior (Bonica Reference Bonica2016). However, Figure A2 in the Supplementary Material shows that while the probability of donation increases with a candidate’s relative vote share (panel A), there is no discontinuity at the zero margin of victory cutoff (panel B).Footnote 18 This suggests that, while police unions might have a tendency to donate to the winner, they are not more likely to support the winner in competitive elections.
Which Candidates and Elections Do Police Unions Donate To?

Table 2. Long description
The table is titled Which Candidates and Elections Do Police Unions Donate To? and uses Donation by police (times 100) as the dependent variable.
Panel A: Candidate characteristics.
* Winner: 3.601*** in column 1 and 5.182*** in column 3.
* Incumbent: 2.968** in column 2 and 1.286 in column 3.
* Democrat: 6.697** in column 4 and 1.223 in column 5.
* Republican: 4.468* in column 4.
* Observations range from 654 to 3,888.
* Mean dependent variable ranges from 3.6 to 8.6.
Panel B: Municipal characteristics.
* Large city: 23.273*** in column 1.
* Mayor-council: 5.288*** in column 2.
* Nonpartisan election: 2.831* in column 3.
* On cycle election: minus 1.437 in column 4.
* No right to work: 1.699 in column 5.
* Observations range from 2,205 to 2,249.
* Mean dependent variable ranges from 5.2 to 10.4.
Standard errors are provided in parentheses below coefficients. Significance levels are indicated by asterisks: * p < 0.1, ** p < 0.05, and *** p < 0.01.
Note: The unit of observation is an election-candidate in Panel A and an election in Panel B. The outcome is equal to 100 if a police union donated, and 0 otherwise. Winner is equal to 1 if the candidate won the election. Incumbent is equal to 1 if the candidate was the incumbent. Democrat is equal to 1 if the candidate is a Democrat. Republican is equal to 1 if the candidate is a Republican. Large City is equal to 1 if the city population is larger than 50,000 inhabitants. Mayor-council is equal to 1 if the city has a mayor-council form of government. Nonpartisan election is equal to 1 if the election is nonpartisan. On cycle election is equal to 1 if the election is on cycle. No right to work is equal to 1 if the city is not located in a right-to-work state. Panel A: all specifications include election fixed effects. Panel B: all specifications include election-year fixed effects and, with the exception of column 5, the natural log of the city’s population. The sample in columns 2 and 3 of Panel A is restricted to consecutive elections, and in column 5 is restricted to elections in which a Republican ran against a Democrat. “Mean dep. var.” is the mean of the outcome when the indicator included in the regression is equal to 0. Standard errors clustered by city in parentheses.
$ {}^{*}\hskip0.3em p<0.1 $
 ,
$ {}^{**}\hskip0.3em p<0.05 $
 , and
$ {}^{***}\hskip0.3em p<0.01. $

Column 2 indicates that incumbents are more likely to receive donations, although column 3 reveals that this relationship is largely driven by incumbents’ stronger electoral performance.Footnote 19 Column 4 shows that Democratic and Republican candidates are both more likely than independents to receive contributions from police unions. The effect is larger for Democrats but it is not significantly different from the effect for Republicans.Footnote 20 In fact, as shown in column 5, in races where a Democrat directly competes against a Republican, there is no partisan preference in union support.
Panel B of Table 2 presents heterogeneity in donation patterns by city characteristics.Footnote 21 In line with Figure 2, column 1 confirms that police unions are significantly more likely to contribute in large cities (defined as those with more than 50,000 inhabitants): the probability of a donation increases by almost five times relative to the probability in cities with less than 50,000 inhabitants. Column 2 shows that police unions are more active in cities with a mayor-council form of government, consistent with the greater formal powers of the mayor in such systems (Carreri and Payson Reference Carreri and Payson2021). Cities whose elections are nonpartisan also see a significantly higher level of participation by police unions (column 3). Given that nonpartisan elections are associated with low turnout in local elections (Hajnal and Lewis Reference Hajnal and Lewis2003), our finding is consistent with interest groups seeing a higher return on their political investments in low-turnout environments (Anzia Reference Anzia2011; Reference Anzia2022b). We find no significant difference in union activity between on-cycle and off-cycle elections (column 4). This result is at odds with theoretical predictions and with empirical evidence from Anzia (Reference Anzia2013), but aligns with more recent evidence in de Benedictis-Kessner and Warshaw (Reference de Benedictis-Kessner and Warshaw2023). Finally, in column 5, we find that police unions are not significantly more likely to donate in states without right-to-work laws.Footnote 22
EMPIRICAL DESIGN
Our objective is to estimate the effect of electing a mayor who received campaign contributions from a police union on three main outcomes: (i) the size of the police department, (ii) compensation levels of police personnel, and (iii) measures of police performance. We implement two complementary empirical strategies to address this question: a two-way fixed effects model and a stacked event-study design that accounts for staggered treatment timing.
Two-Way Fixed Effects Estimation
A central concern in estimating the causal effect of police-union-backed mayors is endogeneity: cities where police unions support winning mayoral candidates may differ systematically from other cities in ways that are correlated with policing outcomes. For example, cities with stronger or more politically active police unions may also exhibit larger police forces or distinct crime trends, regardless of who is elected mayor.
To address these concerns, we exploit within-city variation across multiple mayoral election cycles. Many cities in our dataset are observed over time, and some experience changes in whether the winning mayor received police union donations. This allows us to examine changes in outcomes within the same city, before and after the election of a police-backed mayor. We estimate the following equation:

where
$ {y}_{ct} $
 is the outcome of interest for city
$ c $
 , measured in year
$ t $
 . The key explanatory variable,
$ PoliceMayo{r}_{ct} $
 , is an indicator equal to one if the mayor in office received campaign contributions from a police union in the most recent election.Footnote
23 We include city fixed effects (
$ {\alpha}_c $
 ) to absorb any time-invariant city characteristic, and State-by-calendar-year fixed effects (
$ {\gamma}_{ts(c)} $
 ), which account for time-varying shocks common to all cities within the same state. In addition, we include State-by-term-year fixed effects (
$ {\delta}_{\tau s(c)} $
 ), which control for the fact that cities hold elections in different years and may be at different points in their mayoral term cycles. Finally,
$ {X}_{ct} $
 includes controls for mayoral partisanship and the mayor’s margin of victory, as both characteristics are associated with the likelihood of police union support, as shown above.Footnote
24 Standard errors are clustered at the city level to account for serial correlation over time within the same city.
Stacked Event Study Design
As emphasized by a recent literature on difference-in-differences with staggered adoption (e.g., Borusyak, Jaravel, and Spiess Reference Borusyak, Jaravel and Spiess2024; Cengiz et al. Reference Cengiz, Dube, Lindner and Zipperer2019; De Chaisemartin and d’Haultfoeuille Reference De Chaisemartin and d’Haultfoeuille2020; Goodman-Bacon Reference Goodman-Bacon2021), the standard two-way fixed effects estimator may yield biased estimates when treatment timing varies across units and treatment effects are heterogeneous. Specifically, part of the identifying variation comes from comparisons between “already-treated” and “not-yet-treated” units, which can introduce bias if treatment effects evolve over time.
To address this issue, we implement a version of the stacked event study design proposed by Cengiz et al. (Reference Cengiz, Dube, Lindner and Zipperer2019). We identify as treated units those cities that switch from having a mayor not financed by police unions in election cycle
$ \tau -1 $
 to one financed by police unions in cycle
$ \tau $
 . For each treated city
$ k $
 , we construct a control group consisting of cities in the same state whose mayors never received police union donations during the same period.Footnote
25 Each treated–control group pair defines an “event,” indexed by
$ k $
 , and we stack all such events into a common dataset. We then compare pre–post changes in outcomes in each treated city
$ k $
 to pre–post changes in outcomes, over the same time window, in the cities that serve as its control group. Specifically, this amounts to estimating the following equation:

where
$ {y}_{ctk} $
 is the outcome of interest for city
$ c $
 , in year
$ t $
 , within event
$ k $
 . City-event fixed effects,
$ {\alpha}_{ck} $
 , absorb time-invariant differences between treated and control cities, and year-event fixed effects,
$ {\gamma}_{tk} $
 , absorb time-specific shocks common to all cities in the event. The indicator variable
$ Treate{d}_{ck} $
 indicates treated cities, and the indicator
$ Pos{t}_{tk} $
 equals one in the years following the treatment (i.e., in the years in which the mayor supported by a police union is in office). The coefficient
$ \beta $
 captures the average treatment effect of electing a police-union-backed mayor. Standard errors are clustered at the city level.
We also estimate an augmented version of Equation 2 that includes controls for mayoral partisanship and margin of victory, each interacted with the post-treatment indicator.
To trace the dynamic evolution of the treatment effect and assess potential differential pre-trends between treated and control cities, we also estimate a nonparametric event study specification:

where
$ {D}^{sk} $
 is a set of relative event-time dummies (ranging from three years before to four years after the election, with the year of the election as the omitted category). The coefficients
$ {\beta}_s $
 capture the differential evolution of the outcome in treated versus control cities in the years before and after treatment.
The sample size varies by outcome due to differences in data availability across years and cities. For example, the sample includes 22 treated cities and 110 control cities for arrest rates (non-index crimes), and up to 41 treated cities and 270 control cities for police employment outcomes.
RESULTS
Leveraging these empirical designs, we investigate how the election of a mayor financed by a police union impacts police personnel spending and the performance of the police department.Footnote 26
The Impact of Police-Union-Financed Mayors on Police Personnel Spending
We begin our analysis by examining how the election of a police-union-financed mayor affects the size and compensation of police department personnel.Footnote 27
Panel A of Table 3 presents the estimated effects on the size of the police workforce. Columns 1, 4, and 7 report results from the two-way fixed effects model (Equation 1), while the remaining columns show estimates from the stacked event study design (Equation 2), with and without additional covariates. Across specifications, we find a consistently positive relationship between police union support and police employment, with larger estimated effects under the stacked event study design—suggesting that correcting for staggered treatment timing is empirically important.
The Impact of Mayors Backed by Police Unions on Size and Pay of the Police Department

Table 3. Long description
The table is divided into two main sections.
Panel A: Size of the police department (per 1,000 capita).
It measures the impact on three groups: All employees (columns 1 to 3), Police officers (columns 4 to 6), and Other employees (columns 7 to 9). For ‘Police union mayor’, the coefficients are positive and statistically significant across all categories. For ‘All employees’, coefficients range from 0.069 to 0.130. For ‘Police officers’, they range from 0.036 to 0.072. For ‘Other employees’, they range from 0.033 to 0.058. Standard errors are provided in parentheses below each coefficient. Observation counts range from 3,642 to 7,216 across 962 cities.
Panel B: Average pay of employees.
This panel uses the same column structure. The ‘Police union mayor’ coefficients for pay are generally positive but mostly statistically insignificant, except for column 2 (All employees) which shows a significant coefficient of 178.247. For ‘Police officers’, coefficients range from 90.868 to 169.296. For ‘Other employees’, they range from 2.722 to 99.816. Mean dependent variables for pay are significantly higher for police officers (approximately 6,587 to 7,157) compared to other employees (approximately 3,307 to 3,418).
The bottom row indicates whether controls were applied (Yes or No) for each model. Significance levels are denoted by asterisks: * p < 0.1, ** p < 0.05, and *** p < 0.01.
Note: The table presents estimates of
$ \beta $
 from Equation 1 (columns 1, 4, and 7) and from Equation 2 (columns 2, 3, 5, 6, 8, and 9). The outcome of each regression is indicated in the column title. The standard deviation and the mean of the outcome are calculated in the sample of cities without a mayor supported by a police union. Controls include fixed effects for the partisan affiliation of the mayor and the margin of victory of the mayor (interacted with the
$ Post $
 indicator in columns 2, 3, 5, 6, 8, and 9). Standard errors clustered by city in parentheses.
$ {}^{*}\hskip0.3em p<0.1 $
 ,
$ {}^{**}\hskip0.3em p<0.05 $
 , and
$ {}^{***}\hskip0.3em p<0.01 $
 .
The estimate in column 3 reveals that electing a police-backed mayor is associated with an increase of approximately 0.13 police department employees per 1,000 residents, equivalent to an increase of 11% of the standard deviation of the outcome. This increase is significant for both sworn officers (an increase of 7% of a standard deviation) and civilian personnel (an increase of 14% of a standard deviation). Importantly, the inclusion of controls for mayoral partisanship and electoral margin does little to attenuate the estimates, suggesting the effect is not driven by observable political or electoral characteristics of the mayor correlated with police unions’ support.
Figure 3 presents the corresponding event study estimates (bottom panels) alongside raw group averages (top panels). There are no significant differential pre-trends between treated and control cities, providing support for the identifying assumption of our design. The treatment effect appears promptly in the first year of the mayor’s term and remains stable in subsequent years.Footnote 28 Notably, the raw trends reveal a slight decline in police employment across all cities prior to the election, followed by a sharp and sustained increase in treated cities—both in sworn officers and civilian employees—after a police-backed mayor is elected.
Event Study: Size of the Police Department
Note: The top panels show the average of each dependent variable in the “treated cities,” that is, the group of cities where a police-financed mayor is elected in period 0 (in red) and in the “control cities,” that is, the group of cities where the mayor was never financed by the police during this period (in black). The bottom panels show estimates of the coefficients
$ {\beta}_s $
 from Equation 3, together with 95% confidence intervals based on standard errors clustered at the city level. The dependent variables are: the total number of employees of the police department per 1,000 inhabitants (panels a and d), the number of police officers per 1,000 inhabitants (panels b and e), and the number of civilian employees of the police department per 1,000 inhabitants (panels c and f).

Figure 3. Long description
A six-panel event study layout.
Top Row (Raw Means):
All three panels share an x-axis labeled Period relative to election ranging from minus 3 to 4. Red lines represent Police-backed mayor elected and black lines represent Mayor never backed by police.
* Panel a: Y-axis is Number all police employees. Both groups start near 2.7. After period 0, the red line increases to 2.7 while the black line decreases to 2.5.
* Panel b: Y-axis is Number police officers. The black line starts higher at 2.15 and trends down to 2.0. The red line starts at 2.07, dips, then rises above the black line after period 1, peaking at 2.1.
* Panel c: Y-axis is Number other employees. The red line remains consistently higher than the black line, showing a gradual increase from 0.6 to 0.65 after period 0, while the black line declines from 0.55 to 0.5.
Bottom Row (Event Study Coefficients):
All three panels show beta sub s coefficients with 95% confidence interval error bars. The x-axis is Period relative to election. A horizontal reference line is at 0.
* Panel d: All police employees. Coefficients are near 0 before period 0, then rise sharply to 0.15 at period 2 before slightly declining.
* Panel e: Police officers. Coefficients are flat at 0 until period 0, then rise to a plateau of approximately 0.1 from periods 2 through 4.
* Panel f: Other employees. Coefficients fluctuate near 0 pre-election, then rise to a peak of 0.07 at period 2 and remain positive through period 4.
Panel B of Table 3 examines average compensation in police departments. While the estimated coefficients are positive, they are imprecisely estimated, likely due to two factors. First, the ASPEP data used to measure wages are only available at five-year intervals for several cities in the sample. Second, police salaries are often negotiated through collective bargaining agreements and may not adjust annually, resulting in more muted short-term effects.
In the Supplementary Material, we provide several robustness checks. In Tables A3 and A4 in the Supplementary Material, we control for total campaign contributions received by the mayor (normalized by city population), interacted with the post-treatment indicator. The results remain virtually unchanged, suggesting that the estimated effects are not simply capturing the fact that police-backed mayors receive more campaign contributions overall—potentially reflecting broader donor support that could itself be correlated with increased police spending. We further control for whether the mayor received contributions from firefighters’ or teachers’ unions; again, the estimates are unaffected, indicating that the observed increase in police employment is not a generic effect of being backed by public sector unions. To reinforce this point, Tables A5 and A6 in the Supplementary Material present placebo tests using support from firefighters’ unions. We replicate our event study design by identifying cities that switch from electing a mayor not backed by firefighters’ unions to one who is, and compare them to cities in the same state whose mayors were never supported by firefighters during the same period. We find no corresponding increase in police employment following the election of a firefighter-backed mayor. This suggests that the observed effects are specific to police union support, rather than reflecting a broader alignment with public safety unions more generally. Finally, in columns 3, 6, and 9 of Tables A3 and A4 in the Supplementary Material, we present estimates from a stacked event study design where, instead of comparing cities in the same state, we compare cities with similar populations.Footnote 29 Our results are robust to this alternative choice of the control group.
In addition to wages, total police compensation includes non-salary benefits. Because these benefits are less visible to voters, police unions may be particularly effective in securing improvements to this component of compensation through lobbying efforts (Anzia and Moe Reference Anzia and Moe2015). We use ICMA’s Police and Fire Personnel, Salaries, and Expenditures surveys, which provide data on police department benefit expenditures (ICMA 2013). However, limited coverage of these data precludes a full within-city analysis of this outcome.Footnote 30 Nonetheless, in Table A7 in the Supplementary Material, we report suggestive evidence of a positive association between the election of a mayor who received a police union’s donation and the level of benefits provided to police employees. Conditional on year and state fixed effects, and controlling for log population, we find that municipalities led by a union-supported mayor spend substantially more on health, hospital, disability, and life insurance programs for police (while the association with social security and retirement benefits, while positive, is not statistically significant).
Where Is the Impact of Police Unions Larger?
In Table 4, we examine in which contexts donations by police unions have a larger impact on the size of police department personnel. Because of power constraints, we estimate these heterogeneous effects using a two-way fixed-effects specification rather than the stacked event-study design. Reassuringly, as shown in panel A of Table 3, the baseline estimates are similar across these two approaches.
Where Is the Impact of Police Unions on the Size of Police Departments Larger?

Table 4. Long description
The table is organized into six columns representing different interaction variables.
Header Rows:
- Row 1 (I = 1): 1 lopsided race, 2 early donation, 3 large city, 4 mayor-council, 5 nonpartisan, 6 democrat.
- Row 2 (I = 0): 1 competitive race, 2 late donation, 3 small city, 4 council-manager, 5 partisan, 6 republican.
Data Rows:
- Police union mayor times (I = 1): Column 1 is 0.098*** (0.037); Column 2 is 0.073* (0.039); Column 3 is 0.077*** (0.024); Column 4 is 0.082*** (0.031); Column 5 is 0.065** (0.031); Column 6 is 0.074* (0.038).
- Police union mayor times (I = 0): Column 1 is 0.013 (0.031); Column 2 is 0.068** (0.026); Column 3 is 0.054 (0.053); Column 4 is 0.037 (0.030); Column 5 is 0.064* (0.037); Column 6 is 0.060 (0.043).
Summary Statistics:
- Observations: Ranges from 3,794 (Column 6) to 7,216 (Columns 1-3).
- Cities: Ranges from 575 (Column 6) to 962 (Columns 1-3).
- Mean dependent variable: 2.7 for most columns, 2.8 for Column 5.
Statistical significance is indicated by asterisks: * p < 0.1, ** p < 0.05, *** p < 0.01. Standard errors are provided in parentheses below the coefficients.
Note: The table presents estimates of
$ \beta $
 from Equation 1, with the indicator for a mayor supported by a police union interacted with the indicators described in the title of the column. These indicators are equal to 1 if: the election was lopsided or competitive (column 1), the donation by the police union to the mayor took place early or later in the race (column 2), the city has more or less than 50,000 inhabitants (column 3), the city has a mayor-council form of government, or a council-manager form of government (column 4), the election is nonpartisan or partisan (column 5), and the mayor is Democrat or Republican (column 6). In all columns except column 2, the uninteracted indicators are also included in the specification. The outcome is the number of police department employees per 1,000 residents. Additional controls include fixed effects for the partisan affiliation of the mayor and the margin of victory of the mayor. Standard errors clustered by city in parentheses.
$ {}^{*}\hskip0.3em p<0.1 $
 ,
$ {}^{**}\hskip0.3em p<0.05 $
 , and
$ {}^{***}\hskip0.3em p<0.01 $
 .
In the first two columns, we examine heterogeneous effects by electoral competitiveness and by the timing of police union donations. These analyses are designed to shed light on whether police union contributions are more consistent with influence-seeking—an attempt to secure access to or leverage over the mayor—or with preference alignment—support for candidates who are ex ante more closely aligned with the union’s policy priorities.
We begin by examining heterogeneity by electoral competitiveness. We define a race as competitive if the winning mayor’s margin of victory is 10 percentage points or less, and as lopsided otherwise. Donations to candidates who win lopsided races are more plausibly associated with an influence-seeking motive, as these candidates are more likely to win and thus to provide future access. By contrast, donations in competitive races are more consistent with efforts to improve the electoral prospects of candidates whose policy preferences align with those of the union.
This interpretation is consistent with prior evidence on differences between PAC and individual donor behavior. Individuals—particularly small donors—are typically viewed as ideologically motivated, whereas PACs are generally understood to give strategically in pursuit of influence. Consistent with this distinction, PACs are more likely than individuals to donate to candidates in lopsided races (see, e.g., Bonica Reference Bonica2016, for evidence from federal and state elections). Using our local campaign finance data, we show that this pattern extends to U.S. municipal elections: conditional on election-year fixed effects, the share of donations to winning candidates coming from PACs (rather than individuals) is 50% higher in lopsided races than in competitive races. In column 1 of Table 4, we test whether the effects of police union donations differ depending on whether the donation occurred in a lopsided or a competitive race. The estimated effect on police employment is driven entirely by donations made in lopsided races. This pattern is consistent with police union donations having their largest impact on subsequent staffing when they are more plausibly motivated by influence-seeking.
In column 2 of Table 4, we examine heterogeneity by the timing of donations. We define early donations as those made in the year prior to the election and late donations as those made in the election year. To assess which timing is more consistent with influence-seeking versus preference alignment, we again compare donation behavior by PACs and individuals. Controlling for election-year fixed effects, we find that PACs are 58% more likely than individuals to donate early in the campaign. One interpretation of this pattern is that early giving—when elections are less salient to voters—reflects the greater organizational capacity and influence-seeking orientation of PACs. As shown in column 2 of Table 4, early and late police union donations to winning candidates are associated with similar increases in police employment.
Taken together, these results suggest that police union donation strategies that more closely resemble those of PACs—and are therefore more consistent with an influence-seeking motive—are associated with significant increases in police staffing. At the same time, the evidence does not allow us to rule out effects of donations motivated by preference alignment.
In columns 3–5 of Table 4, we examine heterogeneity by three city characteristics that, as shown in Table 2, are important predictors of police unions’ participation in local campaign finance. We find that police unions are not only more likely to donate in larger cities and in cities with a mayor-council form of government, but the estimated effects of their donations on police employment are also larger in these contexts. Although these estimates should be interpreted with caution—since we cannot formally reject that the effects differ from those in smaller cities or in cities with a council-manager form of government—they suggest that police unions are more active in campaign finance precisely where their potential influence over the mayor is greater.
By contrast, we find no evidence of heterogeneous effects in partisan versus nonpartisan elections (column 5), even though police unions are more active in cities with the latter form of election. Finally, in column 6, we restrict the sample to cities governed by either Democratic or Republican mayors. The estimated effects are similar across party affiliation, although the effect for Republican-led cities is imprecisely estimated.
The Impact of Police-Union-Financed Mayors on Police Performance
In Table 5 and Figure 4, we turn to investigating whether the election of a mayor who received donations from a police union is associated with changes in police performance.Footnote 31 We focus on “index crimes,” a standard set of eight serious offenses used by the FBI as primary measures of crime: homicide, rape, robbery, aggravated assault, burglary, theft, motor vehicle theft, and arson. We examine both the incidence of these crimes and the share that are cleared by the police.
The Impact of Mayors Backed by Police Unions on Police Performance

Table 5. Long description
The table is divided into two main categories: Index crimes (columns 1 through 6) and Other crimes (columns 7 through 9).
Under Index crimes, columns 1 to 3 measure Clearance rate. The coefficients for Police union mayor are -0.008, -0.015, and -0.014 respectively. Columns 4 to 6 measure Number per 1,000 capita, with coefficients of -0.650, 0.624, and 0.935.
Under Other crimes, columns 7 to 9 measure Arrests per 1,000 capita. The coefficients for Police union mayor are -0.577, -2.115, and -2.837.
Standard errors are provided in parentheses below each coefficient.
Additional data rows include:
* Observations: ranging from 944 to 6,419.
* Cities: 751 for column 1, 914 for column 4, and 625 for column 7.
* Cities treated: 22 for Clearance rate and Other crimes; 38 for Number per 1,000 capita.
* Cities control: 132 for Clearance rate, 260 for Number per 1,000 capita, and 110 for Other crimes.
* Mean dependent variable: ranges from 0.19 to 34.66.
* Standard deviation of dependent variable: ranges from 0.11 to 22.92.
* Controls: indicated as Yes or No for each model.
Note: The table presents estimates of
$ \beta $
 from Equation 1 (columns 1, 4, and 7) and from Equation 2 (columns 2, 3, 5, 6, 8, and 9). The outcome of each regression is indicated in the column title. The standard deviation and the mean of the outcome are calculated in the sample of cities without a mayor supported by a police union. Controls include fixed effects for the partisan affiliation of the mayor and the margin of victory of the mayor (interacted with the
$ Post $
 indicator in columns 2, 3, 5, 6, 8, and 9). Standard errors clustered by city in parentheses.
$ {}^{*}\hskip0.3em p<0.1 $
 ,
$ {}^{**}\hskip0.3em p<0.05 $
 , and
$ {}^{***}\hskip0.3em p<0.01 $
 .
Event Study: Police Performance
Note: The top panels show the average of each dependent variable in the “treated cities,” that is, the group of cities where a police-financed mayor is elected in period 0 (in red) and in the “control cities,” that is, the group of cities where the mayor was never financed by the police during this period (in black). The bottom panels show estimates of the coefficients
$ {\beta}_s $
 from Equation 3, together with 95% confidence intervals based on standard errors clustered at the city level. The dependent variables are: the clearance rate for index crimes (panels a and d), the number of index crimes per 1,000 inhabitants (panels b and e), and the number of arrests for other, non-index, crimes per 1,000 inhabitants (panels c and f).

Figure 4. Long description
A multi-panel figure with six line graphs arranged in two rows of three. All graphs share an x-axis labeled Period relative to election ranging from minus 3 to 4.
Top Row (Raw Means):
Panel a: Y-axis is Clearance Rate from point 1 to point 3. A red line with square markers (police-backed mayor) stays consistently above a black line with circle markers (control). Both lines are relatively flat with minor fluctuations around point 2 and point 1 8 respectively.
Panel b: Y-axis is Number of Index Crimes from 0 to 80. The red line starts at 50 and gradually declines to 38. The black line starts at 34 and gradually declines to 28. The gap remains stable.
Panel c: Y-axis is Number other employees from 0 to 40. Both red and black lines start near 30 and show a parallel downward trend to approximately 18 by period 4.
Bottom Row (Event Study Coefficients):
Panel d: Y-axis is Clearance rate event study from minus point 0 5 to point 1. A black line with vertical error bars fluctuates around the zero baseline, showing no significant divergence after period 0.
Panel e: Y-axis is Number of index crimes event study from minus 10 to 20. The line shows a slight upward trend from period 0 to 4, but error bars overlap with the zero baseline.
Panel f: Y-axis is Arrests for other crimes event study from minus 20 to 20. The line remains very close to the zero baseline throughout all periods with wide error bars.
We do not find improvements in clearance rates following the election of a police-union-financed mayor. While the estimates are negative, they are imprecisely estimated, and we cannot reject the null of a zero effect on performance. Similarly, we do not detect significant changes in the number of index crimes per capita. In Tables A9 and A10 in the Supplementary Material, we show that this is true for both violent crimes (homicide, rape, robbery, and aggravated assault) and property crimes (burglary, theft, motor vehicle theft, and arson).
In columns 7–9 of Table 5, we examine arrests for non-index crime offenses, such as drug possession and public intoxication, where police officers typically have greater discretion in enforcement. We find some evidence of a reduction in arrests per 1,000 inhabitants following the election of a police-union-financed mayor. However, the effect is not statistically significant at conventional levels.
In sum, we find that the election of a police union-supported mayor leads to a statistically and substantively meaningful increase in police staffing, but does not produce detectable improvements in police performance. Connecting these results to our theoretical framework, we outline two interpretations that can account for this pattern.
A first explanation is that a positive resource effect is offset by a negative effort effect. While union-backed mayors expand police staffing, the additional resources may coincide with weakened incentives for officers to exert effort. As discussed in the section on theoretical expectations, political support from police unions may substitute for job performance as a means of securing favorable treatment, thereby reducing the need for officers to demonstrate effectiveness through crime reduction or enforcement outcomes. Under this interpretation, one input in the police production function—resources—increases, while the other—effort—declines. These countervailing forces leave observable performance measures, such as crime rates, clearance rates, and arrests, largely unchanged.
A second explanation abstracts from changes in effort and instead emphasizes how additional resources are deployed within the police department. As discussed in the section on theoretical expectations, increased staffing may fail to improve performance if new resources are allocated in ways that prioritize officers’ preferences over operational effectiveness. For example, changes in assignment decisions may dilute the impact of additional personnel on front-line policing. Under this mechanism, higher staffing does not translate into improved performance because the marginal productivity of new resources is limited.
Taken together, these findings suggest that police union influence over mayoral elections can shape the size of police departments without necessarily improving policing outcomes. This might reflect offsetting effects on effort or inefficiencies in resource allocation—or some combination of the two.
CONCLUSION
Some of the most pressing policy issues in the United States today, such as public safety, housing, and local budgeting, are responsibilities of local governments (Anzia Reference Anzia2022b; Trounstine Reference Trounstine2009; Reference Trounstine2020). Yet the political forces shaping these outcomes at the municipal level remain understudied. Nowhere is this gap more evident than in the realm of local campaign finance, where the rules are looser, oversight is weaker, and the potential for interest group influence is arguably greater than at the state or federal level. Despite frequent media attention to the sums donated by police unions, we still know surprisingly little about how often these organizations contribute to local campaigns, which candidates they support, whether their political involvement affects the policies that local governments adopt, and finally how this affects police behavior (DiSalvo Reference DiSalvo2022).
This article addresses that gap by assembling and analyzing the first large-scale dataset of local campaign finance in U.S. mayoral elections, covering over 2,300 contests in more than 1,000 cities between 2001 and 2019. Using these data, we explore patterns in the frequency, targeting, and partisanship of police union political activity, providing the first comprehensive descriptive portrait of their involvement in local campaign finance. We then leverage within-city variation in the election of union-backed candidates to estimate the causal effects of such support on police department size, compensation, and performance, using a staggered difference-in-differences model that accounts for treatment heterogeneity over time.
Causally, we show that cities that elect union-backed mayors see substantial increases in police employment, consistent with theoretical expectations that unions seek to expand their influence through police spending (Anzia and Moe Reference Anzia and Moe2015; DiSalvo and Kucik Reference DiSalvo and Kucik2018). At the same time, we find no evidence that these additional resources translate into improved police performance. We interpret this pattern as consistent either with reduced incentives for police officers to exert effort or with the allocation of new resources in ways that limit their marginal productivity. Descriptively, we find that police unions are active and strategic political players in local elections. Their campaign contributions are relatively frequent, particularly in mid-sized and large cities, and they tend to concentrate resources on likely winners and on incumbents, consistent with investor models of interest group behavior. Police unions support both Democratic and Republican candidates at comparable rates, echoing recent findings on their pragmatic approach to electoral politics (Gaudette Reference Gaudette2025).
Our findings underscore the importance of public sector unions, and interest groups more broadly, in shaping the policy process at the local level. The scale and consequences of the involvement of police unions in mayoral elections demonstrate that campaign finance is not simply a national concern. It is a vital and understudied aspect of city governance that has tangible consequences for institutional design, budgetary priorities, and service delivery. As debates about the structure and oversight of policing in the United States continue, understanding the political channels through which police departments operate is essential.
De Benedictis-Kessner et al. (Reference de Benedictis-Kessner, Harvey, Jones and Warshaw2025) show that, in contrast to virtually every other policy area and spending category examined, mayoral partisanship has no causal impact on police employment, expenditures, crime rates, or arrest numbers. Our findings suggest that, in the realm of policing, it is the political activity of police unions, not local partisan politics, that offers a more informative lens through which to understand variation in policy outcomes.Footnote 32
Future research on local governance should take interest group activity more seriously—not as a side note, but as a central force in democratic accountability and policy outcomes. It should more directly examine other interest groups that are highly active at the local level but whose political involvement remains understudied, such as firefighters’ and teachers’ unions. A particularly promising starting point is the political role of teachers’ unions, whose endorsements and donations in school board elections may shape school spending and education policy.
SUPPLEMENTARY MATERIAL
The supplementary material for this article can be found at https://doi.org/10.1017/S0003055426101956.
DATA AVAILABILITY STATEMENT
Research documentation and data that support the findings of this study are openly available at the American Political Science Review Dataverse: https://doi.org/10.7910/DVN/SGDKOL.
ACKNOWLEDGEMENTS
Sara Chiuri, Vincent D’Anzi, Sem Manna, Luigi Roncoroni, Francesco Salerno, and Hao Wu provided outstanding research assistance. For comments, we are indebted to John Ahlquist, Sarah Anzia, Audinga Baltrunaite, Michael Becher, Dan DiSalvo, Oeindrila Dube, Trish Kirkland, Justin de Benedictis-Kessner, Jake Grumbach, Asya Magazinnik, Andrew McCall, Jessica Trounstine, Hye Young You, Chris Warshaw, and Elisa Wirsching, as well as participants at the Columbia University Political Economy Seminar, the RWAP Seminar at UC Berkeley, the Brown Political Economy Conference, the Money in Politics Conference, the Petralia Political Economy Workshop, the EUI Workshop on Legislators and Legislatures, the Alghero Political Economy Workshop, the “Representation, Democracy and the Economic Background of Politicians” at the Center for Global Development at Vanderbilt University, the Hertie School, IE University, the CEPR-EJPE Conference, Bocconi University, Humboldt University, the EUI, and annual meetings of the American Political Science Association and the Midwest Political Science Association. All errors are solely our responsibility.
CONFLICT OF INTEREST
The authors declare no ethical issues or conflicts of interest in this research.
ETHICAL STANDARDS
The authors affirm this research did not involve human participants.


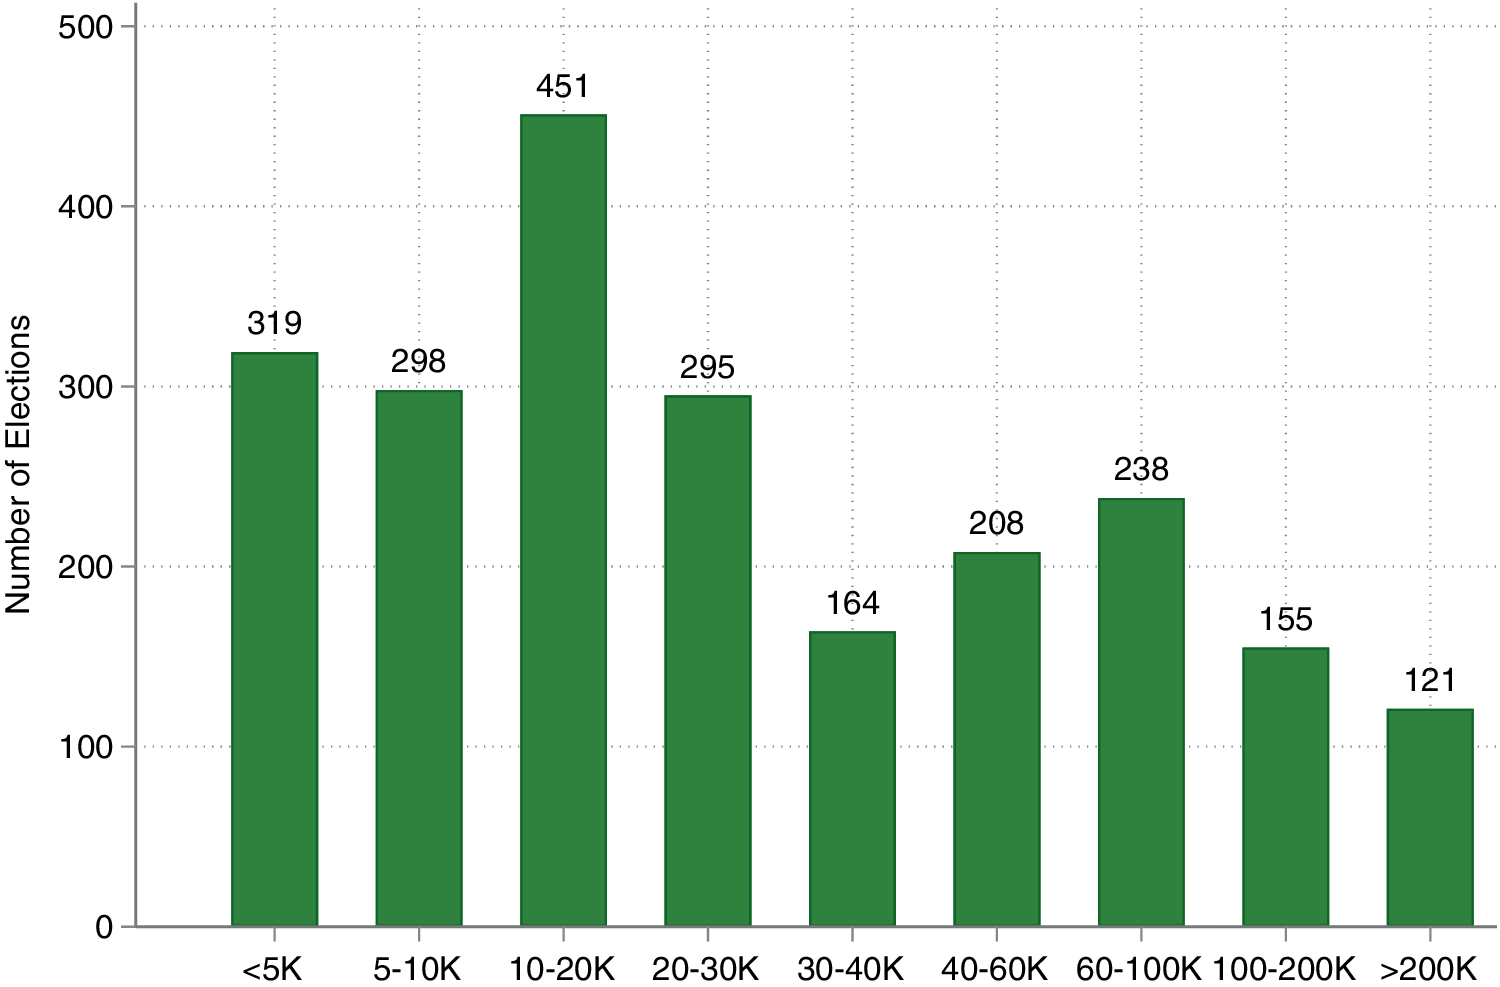

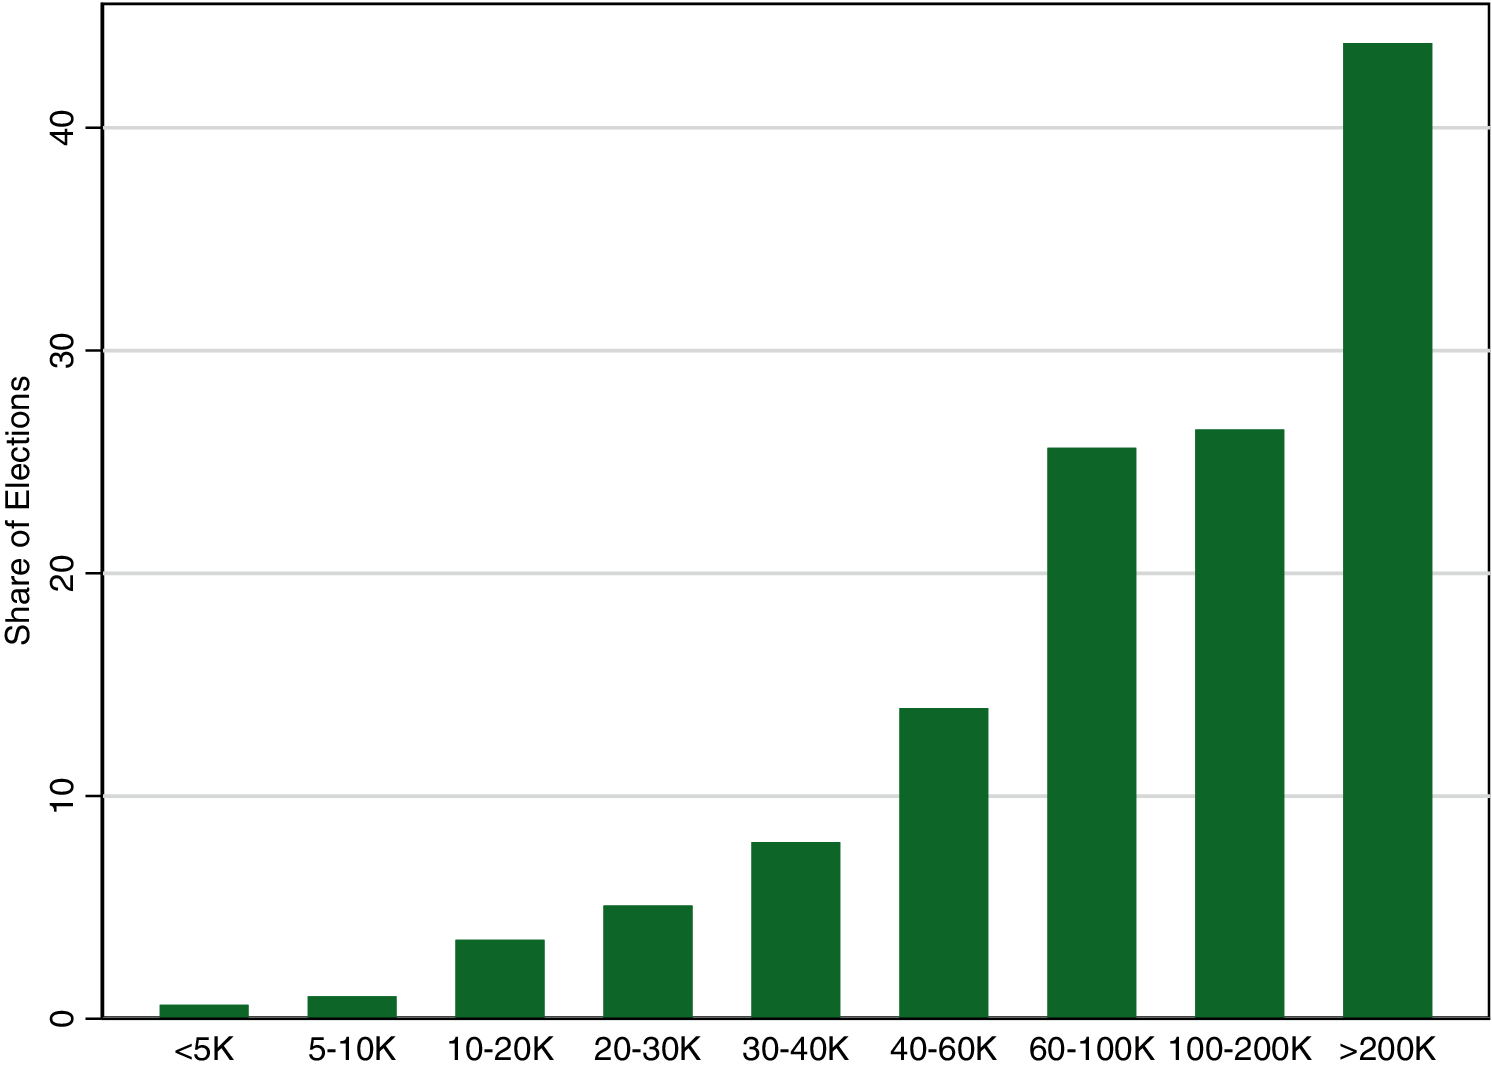


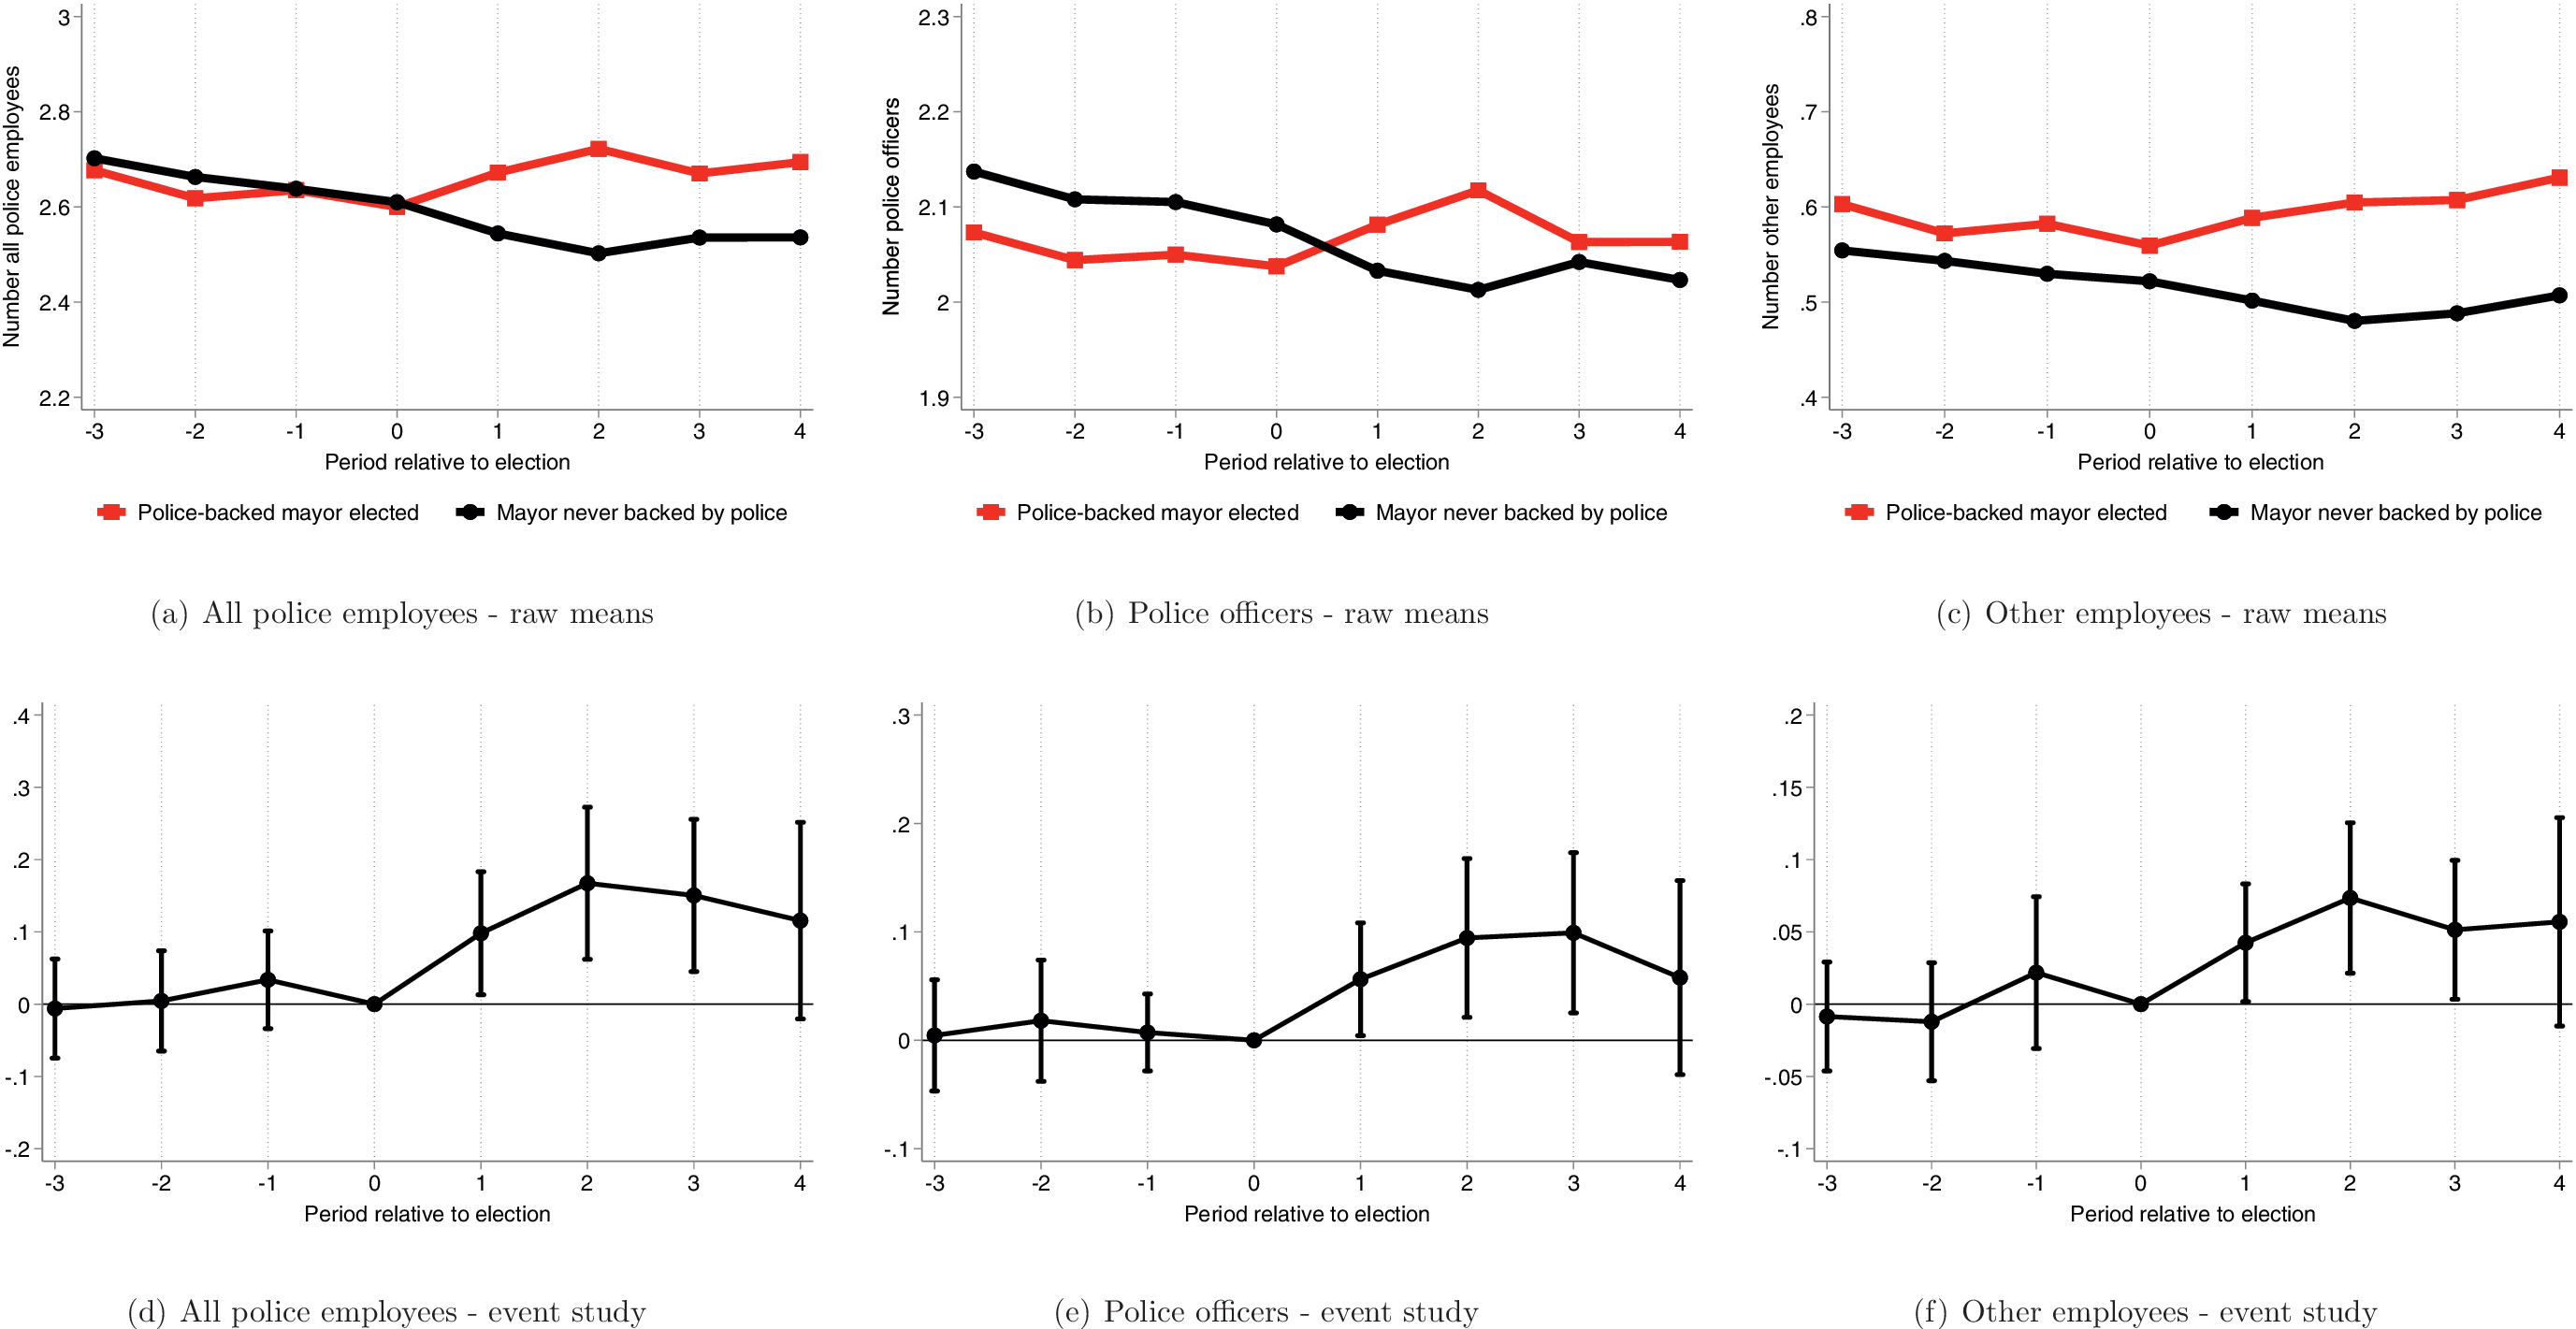

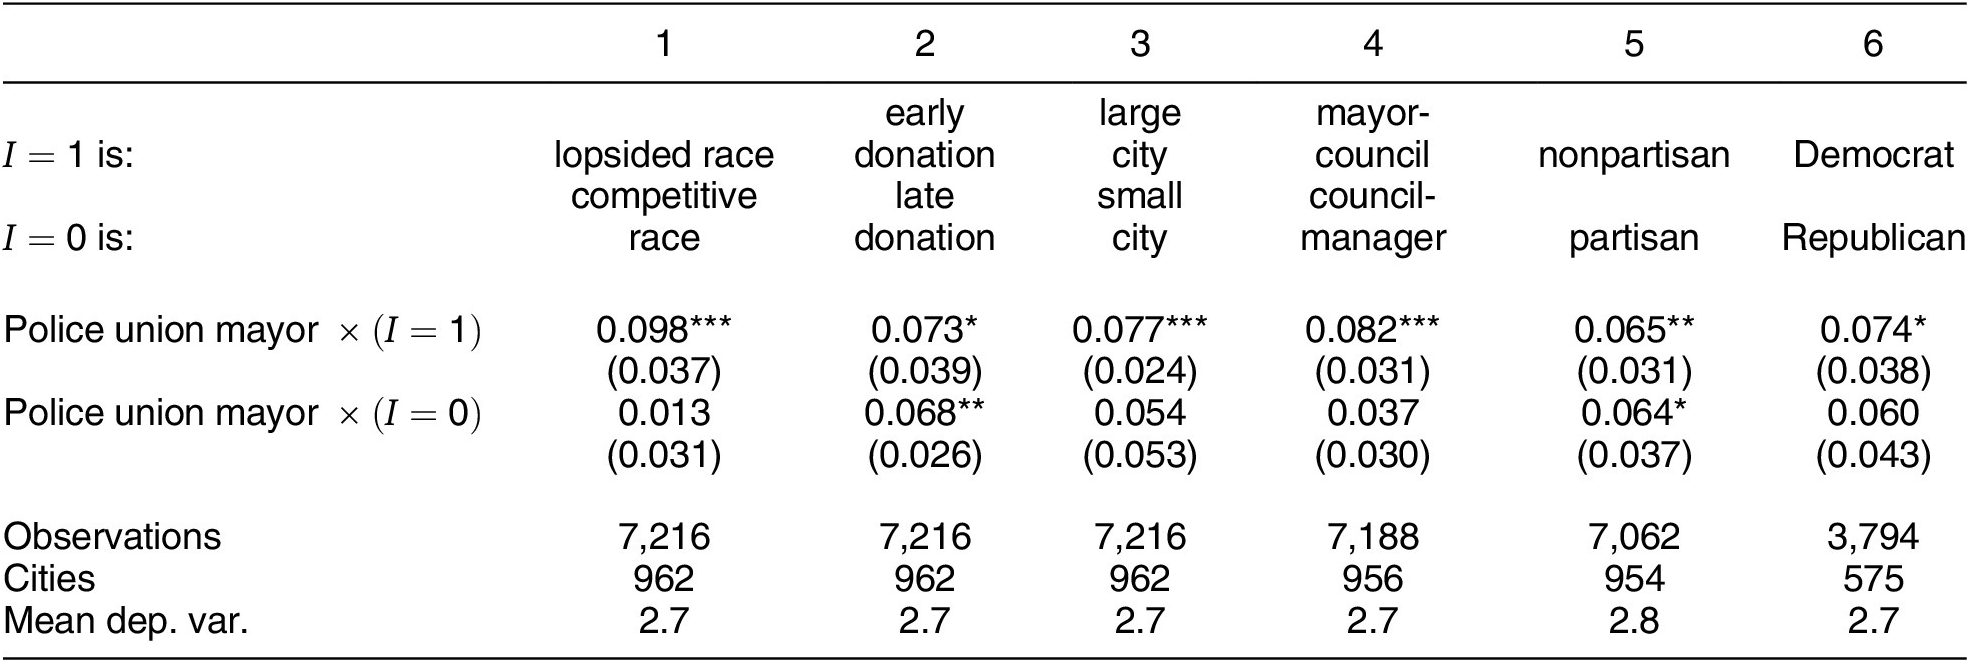
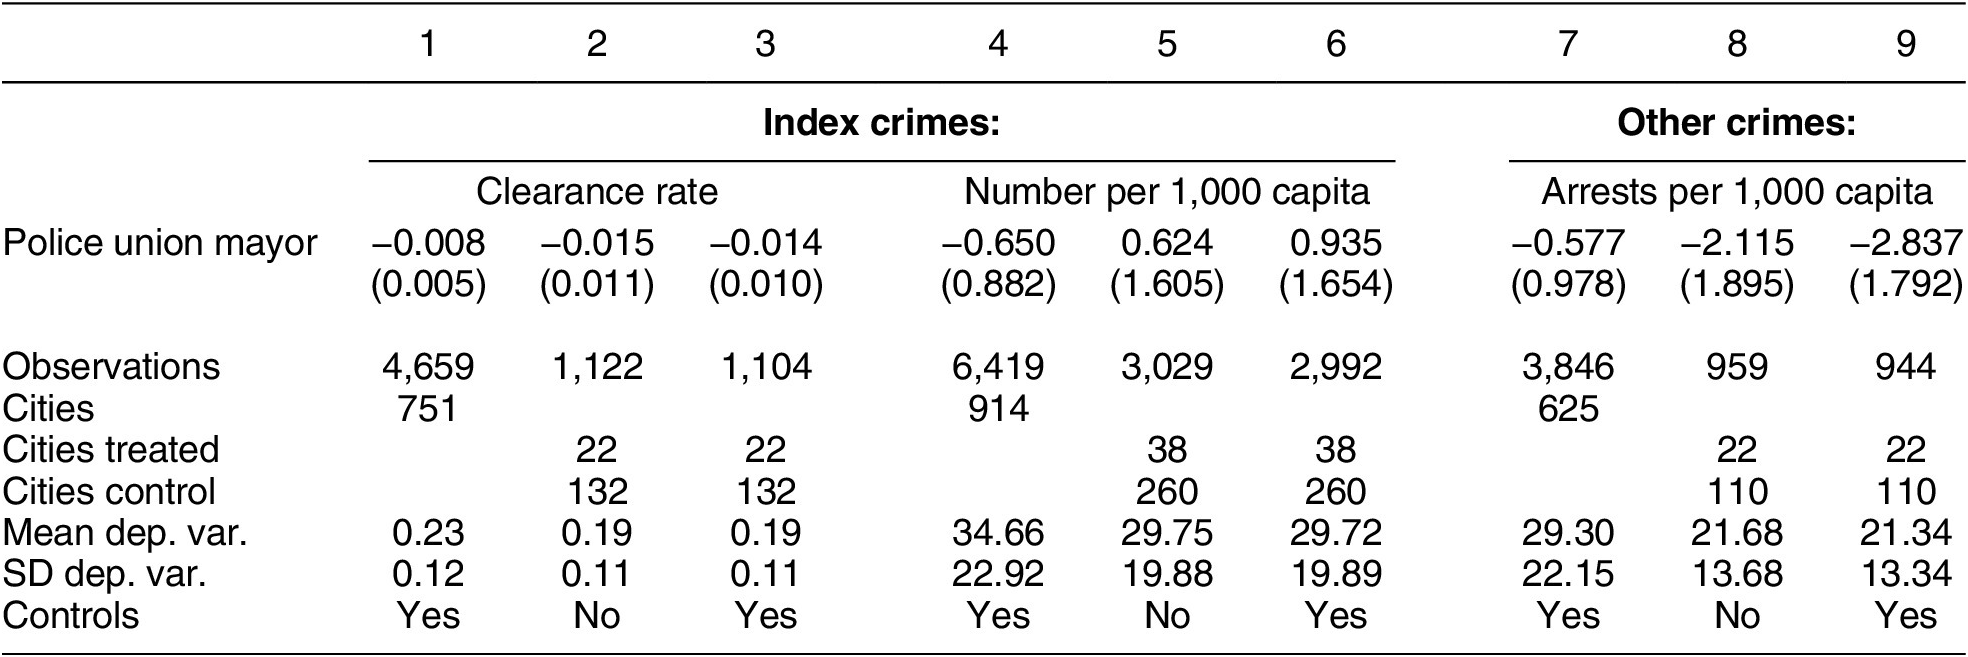
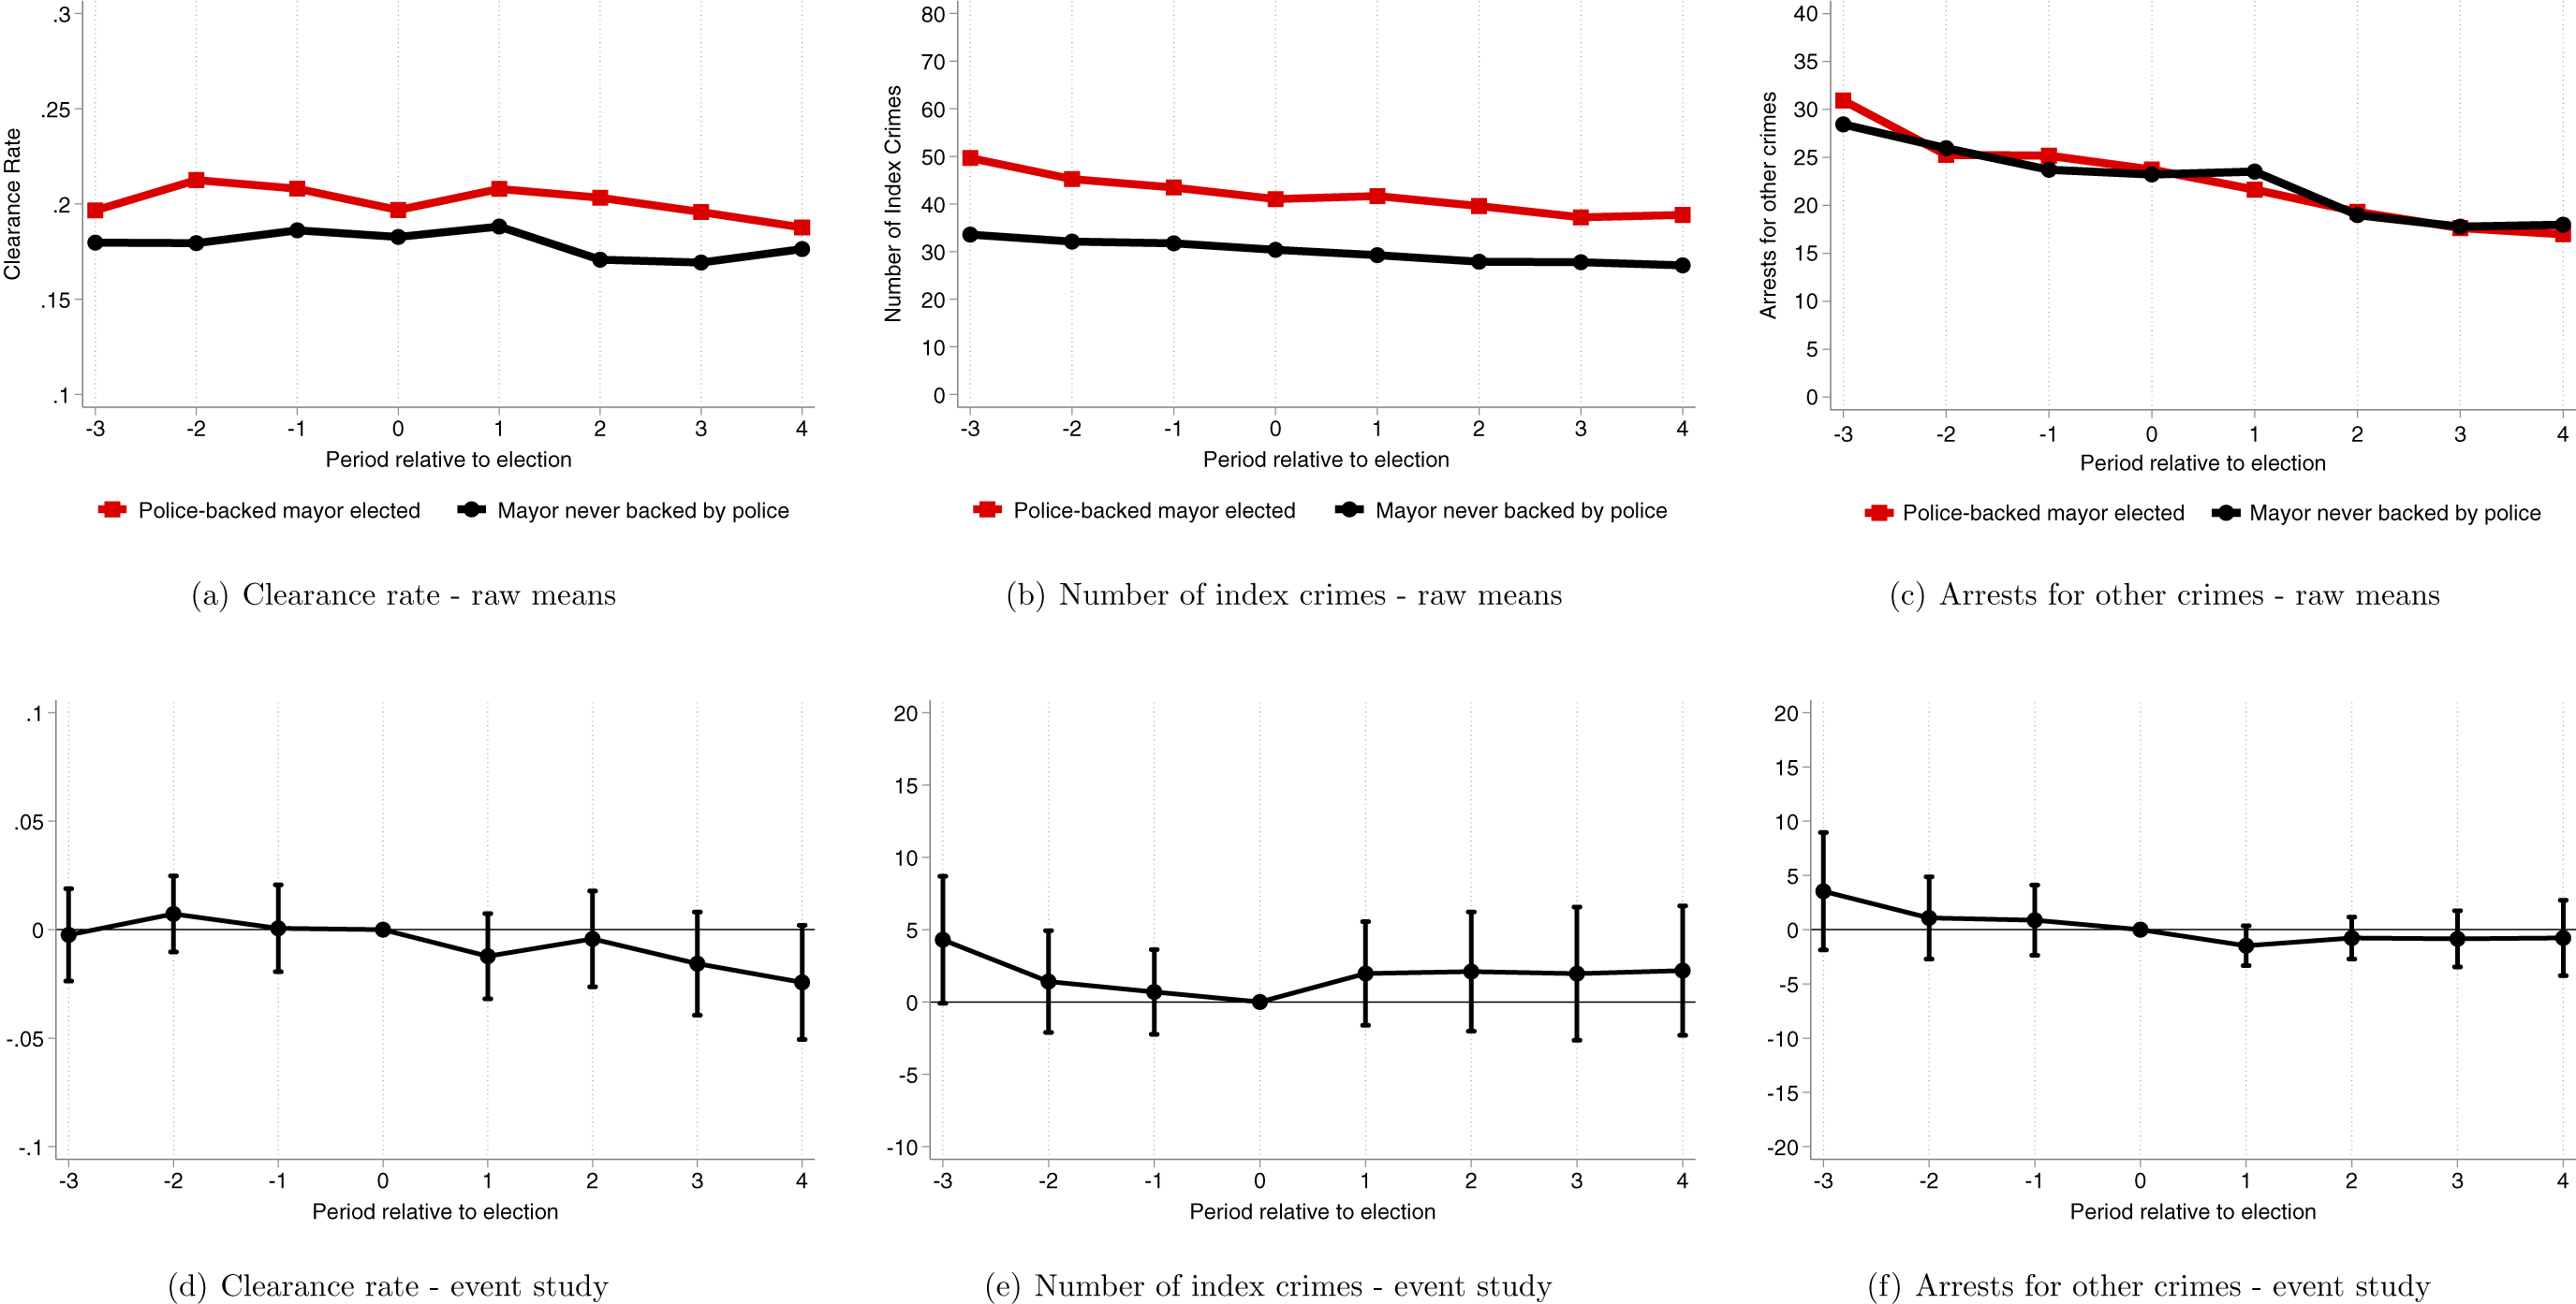


 Open access


Comments
No Comments have been published for this article.