

INTRODUCTION
It has been shown that frugivores generate different seed deposition patterns that vary depending on both the plant and animal species involved (Lambert & Chapman Reference LAMBERT, CHAPMAN, Forget, Lambert, Hulme and Vander Wall2005). In some cases clumped dispersal in a single location favours a better establishment of seedlings than expected by chance (Julliot Reference JULLIOT1997, Théry & Larpin Reference THÉRY and LARPIN1993) despite losses due to density-dependent mortality. Two-phase dispersal, known as diplochory, is common (Vander Wall & Longland Reference VANDER WALL and LONGLAND2004) and can increase the effectiveness of dispersal. Secondary dispersal, e.g. by scatterhoarding rodents (Forget Reference FORGET1996), changes the initial pattern of the seed rain and can increase the probability that a seed could germinate in a favourable microsite (Engel Reference ENGEL2000, Forget Reference FORGET1997) and far from parent trees (Dalling et al. Reference DALLING, SWAINE and GARWOOD1998, Forget & Jansen Reference FORGET and JANSEN2007). Secondary dispersal by invertebrates has been also documented (Engel Reference ENGEL2000). In neotropical rain forests dung beetles (Andresen Reference ANDRESEN2002a, Feer Reference FEER1999) and ants (Levey & Byrne Reference LEVEY and BYRNE1993, Pizo et al. Reference PIZO, PASSOS, OLIVEIRA, Forget, Lambert, Hulme and Vander Wall2005) move seeds: this may protect them from predation and may favour their germination by potential relocation to a more favourable environment (Andresen & Levey Reference ANDRESEN and LEVEY2004). Raindrop impacts have also been shown to displace very small seeds both horizontally and vertically (Marthews et al. Reference MARTHEWS, MULLINS, DALLING and BURSLEM2008).
In French Guiana, as in other neotropical forests, howler monkey endozoochory plays a prominent role in forest regeneration, dispersing seeds of fleshy fruits to places where groups of animals rest or sleep (Julliot Reference JULLIOT1996a, Reference JULLIOT1997; Ponce-Santizo et al. Reference PONCE-SANTIZO, ANDRESEN, CANO and CUARÓN2006). Both increased seedling abundance and diversity were observed in defecation areas under sleeping sites of the red howler monkey Alouatta seniculus (Julliot Reference JULLIOT1997, Julliot et al. Reference JULLIOT, SIMMEN, ZHANG, Bongers, Charles-Dominique, Forget and Théry2001). This pattern of recruitment has been interpreted as a result of increased seed input due to clumped dispersal by monkeys (Julliot Reference JULLIOT1996a, Julliot & Sabatier Reference JULLIOT and SABATIER1993), increased survival of seeds due to burial by dung beetles (Andresen & Feer Reference ANDRESEN, FEER, Forget, Lambert, Hulme and Vander Wall2005, Feer Reference FEER1999) and increased seedling establishment due to fertilizing effects of dung deposition (Andresen & Levey Reference ANDRESEN and LEVEY2004, Feeley Reference FEELEY2005). The transfer of seed and organic matter (dung) from canopy to topsoil is a positive interaction between several non-competing organisms specialized on stages of process of the same substrate. This ‘latrine effect’ may reveal itself essential to the maintenance of tropical rain-forest plant diversity (Engel Reference ENGEL2000, Vulinec et al. Reference VULINEC, LAMBERT and MELLOW2006).
However, the fate of small seeds, known to persist a long time in the soil seed bank (Jankowska-Błasczuk & Grubb Reference JANKOWSKA-BŁASCZUK and GRUBB2006), remains unknown once they have been incorporated into the topsoil through dung beetle and other invertebrate burial activity (Dalling et al. Reference DALLING, MULLER-LANDAU, WRIGHT and HUBBELL2002). Julliot (1992) has shown, by studying two defecation sites of the red howler monkey, that some plant species showed a higher density in the soil under sleeping sites than in controls. In the present study we examined whether the above-mentioned transfer of seed and dung increases the size of the soil seed bank and changes its composition (seed size, pioneer vs non-pioneer species) and survival. Second, we wanted to know whether the ‘latrine effect’ influences the vertical distribution in the soil of seeds of varying size and ecological requirements.
MATERIALS AND METHODS
Study site
Our study was conducted at the Nouragues Research Station (French Guiana, South America), located 100 km south of Cayenne (4°5'N, 52°41'W, 110 m asl). The station was established in 1986 in a 1000-km2 wilderness reserve dominated by tropical rain forest (Charles-Dominique Reference CHARLES-DOMINIQUE, Bongers, Charles-Dominique, Forget and Théry2001). The climate is characterized by a long wet season lasting from December to August, often interrupted by a short, drier period around March. The average annual rainfall is 2990 mm and the mean temperature is 26.3 °C (Grimaldi & Riéra Reference GRIMALDI, RIÉRA, Bongers, Charles-Dominique, Forget and Théry2001). Soils are acid (pH < 5), sandy Ferralsols (FAO 2006) which lack fertility due to scarcity of organic matter and phosphorus (Grimaldi & Riéra Reference GRIMALDI, RIÉRA, Bongers, Charles-Dominique, Forget and Théry2001, Vitousek, Reference VITOUSEK1984).
In the Nouragues area, the rain forest hosts a great diversity of trees, the height of which averages 30–35 m with emergent trees reaching 50 m in height (Poncy et al. Reference PONCY, SABATIER, PRÉVOST, HARDY, Bongers, Charles-Dominique, Forget and Théry2001). Dominant canopy tree families include Leguminosae, Sapotaceae, Burseraceae, Chrysobalanaceae, Lecythidaceae, Rubiaceae, Vochysiaceae and Nyctaginaceae, with c. 550 species ha−1 and an average 184.5 species ha−1 with dbh > 10 cm (Poncy et al. Reference PONCY, SABATIER, PRÉVOST, HARDY, Bongers, Charles-Dominique, Forget and Théry2001).
Study species
The howler monkey (Alouatta seniculus L.) is the dominant primate species near the research station. It lives in troops (6.3 individuals on average), feeding on ripe, fleshy fruits, and foliage in the tree canopy. Fleshy fruits are preferred but it may also consume leaves and flowers according to availability (Julliot & Sabatier Reference JULLIOT and SABATIER1993, Simmen et al. Reference SIMMEN, JULLIOT, BAYART, PAGÈS-FEUILLADE, Bongers, Charles-Dominique, Forget and Théry2001). Among the 97 species which constitute its diet, fruits of 21 species have seeds of ≤ 0.1 g. Foraging monkeys travel up to several hundred metres per day within their home range, especially to forage (Julliot Reference JULLIOT1994, Reference JULLIOT1996b). They rest or sleep in particular tree crowns, some of them regularly or seasonally used for several years, while others are used more erratically (Julliot Reference JULLIOT1996a). A troop defecates on average 1.5 kg d−1 of dung, mostly after a resting period, scattering dung on the ground over about 10 m2, enriching the microsite with seeds which accumulate in the course of time (Julliot et al. Reference JULLIOT, SIMMEN, ZHANG, Bongers, Charles-Dominique, Forget and Théry2001). The majority of seeds remain viable once they have transited through their guts (Julliot Reference JULLIOT1996b). Beside seed concentration, the input of dung has far-reaching consequences on nutrient availability. Places where dung has been deposited are enriched in nutrients compared to surrounding areas, the more so where defecation occurs more frequently (Feeley Reference FEELEY2005).
The local dung beetle community is rich in cohabiting species (79 species known to be attracted by howler monkey dung, F.F. pers. obs.), which are specialized according to activity rhythm and dung-processing behaviour (Feer & Pincebourde Reference FEER and PINCEBOURDE2005). Dung beetles quickly process dung to provision underground feeding and nesting chambers. The proportion of seeds buried and the depth at which they are buried increase with beetle size and decrease with seed size (Andresen & Feer Reference ANDRESEN, FEER, Forget, Lambert, Hulme and Vander Wall2005, Feer Reference FEER1999), but experiments with plastic beads showed that most of them were buried in the top 6 cm (Andresen Reference ANDRESEN2002a).
Sampling the soil seed bank
We sampled the soil seed bank in March 2006. Three sleeping sites were selected, which were visited by howler monkeys during the 2-wk field session. The sites were at least 110 m and at most 270 m apart. Sampling areas were set in the morning after a defecation event was located. The middle of each defecation area was visually determined, and was arbitrarily used as the centre from which to select three sampling plots at each point of a 3-m-side equilateral triangle, oriented with its apex to north. Control areas were arbitrarily selected 15 m east of the sleeping site, outside the defecation area but they were assumed to be under the same vegetation and soil conditions. We sampled the soil seed bank in control areas in the same manner as in defecation areas. There were no treefall gaps near these areas. The nearest adult Cecropia tree was located 80 m from sleeping sites 1 and 2 and a Ficus nymphaefolia was located 50 m from sleeping site 1. This allowed us to be certain that (1) there was no direct influence of gaps on study sites and (2) the presence of small seeds in the soil seed bank was due to dispersal and not to neighbouring trees.
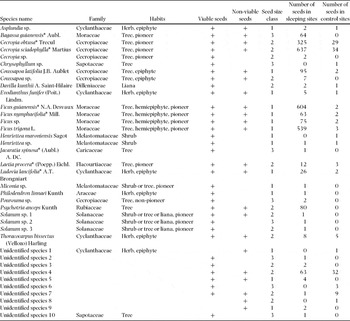
The samples of the soil seed bank were taken 24 h after all dung seemed processed basically by dung beetles. Preliminary observations showed that this time was necessary to be sure that the bulk of monkey dung had been buried by dung beetles. At each sampling plot three successive layers each 2 cm in thickness were dug with a spoon within 20-cm diameter circular areas, then transferred to plastic bags. The same day, subsamples of 100 g were taken in each soil sample then sieved at 0.1 mm under tap water. Seeds, intact or not, were rapidly sorted then sealed in black plastic bags to avoid germination by light effect. The taxonomic identification of plant species was done at the laboratory when possible to species level (Table 1), using the seed collection from French Guiana available in the Laboratory of Brunoy and species lists for the Guianan rain forest by Favrichon (Reference FAVRICHON1994). Seeds were kept in a fresh (imbibed) state, thoroughly inspected with forceps under a dissecting microscope, and visually classified into full (externally intact and firm) and empty (void, tunnelled or nibbled) seeds. Firmness and integrity of the seed coat were used as criteria for their viability (Borza et al. Reference BORZA, WESTERMAN and LIEBMAN2007). Seeds were classified in three size classes, < 2 mm (class 1), 2–4 mm (class 2) and > 4 mm (class 3).
Species names and taxonomic classification of plants found in soil seed samples. Habits according to Favrichon (Reference FAVRICHON1994). Seed size: class 1 = < 2 mm, class 2 = 2–4 mm, class 3 = > 4 mm. (*) Species known to be consumed by the red howler monkey according to Julliot (Reference JULLIOT1996b).

Data analysis
We analysed the general effect of defecation and depth on seed density and richness. Seed density (number of seeds per 100 g fresh soil), species richness (number of species) and species diversity (Shannon index) were log-transformed (log (x+1)) to take into account the sample with no seed and then analysed with a linear mixed model (lme function of R program; Ihaka & Gentleman Reference IHAKA and GENTLEMAN1996) using sampling plot (18 levels, three plots per area) as a random effect. We used depth as a continuous fixed effect and latrine effect (defecation area compared with control area) and sleeping site (three levels) as categorical fixed effects. We started with a full model that included all the three fixed effects and their interactions and we simplified this model using the StepAIC function (library MASS). The validity of the model hypothesis was verified using methods proposed by Pinheiro & Bates (Reference PINHEIRO and BATES2000).
Because species richness and species diversity are by definition linked with seed density, we performed a second set of analyses in order to study whether defecation had an additive effect on diversity when controlling for seed density. In this analysis the two diversity variables (number of species and Shannon index) were again log-transformed and then analysed with seed density (also log-transformed), depth, latrine effect and sites as fixed covariates. The same model selection procedure as before was used to simplify the two initially complete models.
Seed viability was analysed with a generalized linear mixed model for binomial data using the lmer function from the lme4 library. Seed size, depth, site and latrine effect were used as fixed co-variables.
Species accumulation curves were calculated for sleeping sites and controls, separately, using EstimateS version 8.0 (http://purl.oclc.org/estimates). They were used for the calculation of extrapolated species richness, using Chao1 and Chao2 estimators of species richness and their confidence intervals (Colwell & Coddington Reference COLWELL and CODDINGTON1994).
Interactions between depth, seed size and latrine effects were analysed with the G-test of independence, using Systat® software. Other statistical treatments (chi-square tests) were done using Addinsoft® XLSTAT software.
RESULTS
The analysed samples contained a total of 2755 seeds from 37 plant species among which 16 (43%) were identified to species, 11 (30%) to genus and 2 (5%) to family (Table 1). The dominant species were Cecropia sciadophylla (671 seeds), Ficus guianensis (606 seeds), Ficus trigona (542 seeds) and Cecropia obtusa (354 seeds), four small-seeded pioneer trees. Non-pioneer, large-seeded trees (Pourouma sp., Chrysophyllum sp., unidentified Sapotaceae) were poorly represented in our samples, at least in numbers.
Latrine effect on seed density and richness
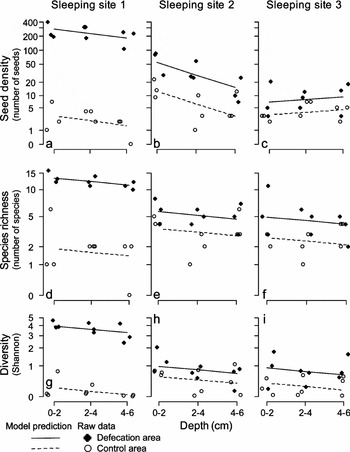
Seed density, species richness and species diversity were found to be higher in defecation areas compared with control areas (Figure 1, Table 2). This ‘latrine effect’ varied quite a lot between sites. In sleeping site 1, the ‘latrine effect’ was much higher than in the two other sites. This difference was due to the fact that in this site seed density and diversity were very low in the control area and very high in the defecation area. In the other two sites, control areas had more seeds and more species than in the first site and less seeds and species in their respective defecation areas.
Seed density (a–c), species richness (d–f) and Shannon index (g–i) in the soil under three defecation areas of the red howler monkey (black circles) and control areas (open circles) as a function of depth (Nouragues reserve, French Guiana). For each analysed variable, the type III ANOVA table of the selected model is presented in Table 2 and the values predicted by the model are shown on the graphs. Note that a small amount of noise has been artificially added to the data on the x-axis to visualize overlapping points.

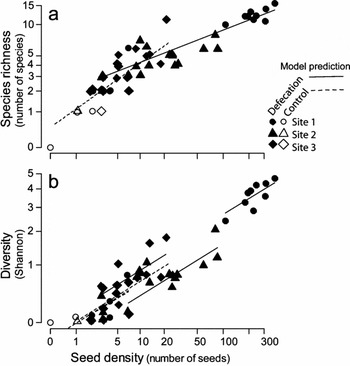
Results of generalized linear mixed models. Included are results on the influence of: latrine presence, soil depth and site on seed density, species richness and Shannon diversity (Gaussian model); seed density, latrine and site on seed species richness and Shannon diversity (Gaussian model) and site, latrine and depth on the proportion of viable seeds (binomial model). F and χ2 values and associated P-values all come from type III ANOVAs. Values predicted from the models are plotted above raw data in Figures 1, 2 and 4.

Depth effect on seed density and diversity
The effect of depth on seed density was found to vary between sites (Figure 1a–c, Table 2): in sleeping sites 1 and 2, seed density decreased with depth in both defecation and control areas whereas in the third site, seed density was not correlated with depth. This third site was also the one with the lowest average seed density. We found no effect of depth on biodiversity, either on species richness or on Shannon diversity index (Figure 1d–i, Table 2).
Relationship between seed density and diversity
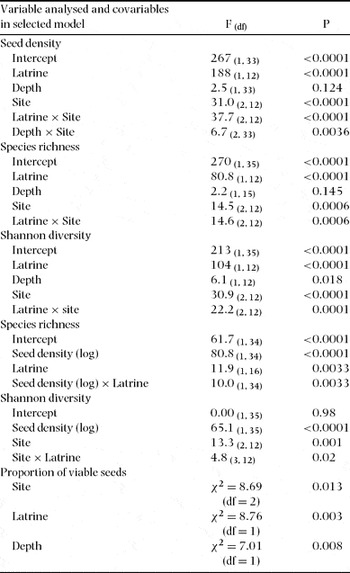
As expected, species richness and species diversity were strongly correlated with seed density according to a log-log relationship (Figure 2, Table 2). Therefore, any increase or decrease in species richness of the soil seed community could be considered as a side-effect of seed density. In the case of species richness, the slope of this relationship was found not to differ between the three sites but to differ between control and defecation areas. In the defecation area, the slope was lower than in the control area (Figure 2a, Table 2). This effect was not found on species diversity but differences between sites were found. The same relationship between species diversity and density was found in the different control areas whereas, in defecation areas, differences between sites were observed (Figure 2b, Table 2).
Log-log relationships between species richness (a) and Shannon diversity index (b) with seed density in the different samples coming from defecation (closed symbols) or control areas (open symbols) of the red howler monkey (Nouragues reserve, French Guiana). Type III ANOVAs of selected models are presented in Table 2 and values predicted by the models are shown on the graph. Note that non-significant effects (such as ‘depth’) are not represented in corresponding lines of Table 2.

Depth had no effect on either species richness or species diversity even when seed abundance was taken into account.
Accumulation curves
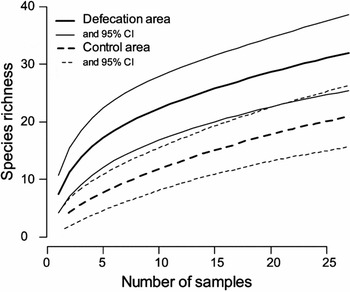
Species accumulation curves showed that control sites were always at a lower level of species richness for the same sampling effort, but their confidence intervals tended to overlap beyond 20 samples (Figure 3). Chao1 estimator was 38.4 species for the bulk of sleeping sites and 25.7 species for the bulk of control sites, but with an overlap between their 95% confidence intervals (33.5–59.3 and 22–43.8 species, respectively). Similar conclusions could be reached from Chao2 confidence intervals (35.3–80.9 and 23.2–56.4 species, respectively).
Species accumulation curves for seeds collected in the soil under sleeping and control sites of the red howler monkey (Nouragues reserve, French Guiana). Means of observed values in continuous lines, upper and lower 95% confidence intervals in dashed lines.

Seed size distribution
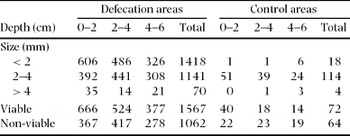
Depth, seed size and latrine effect (defecation vs control areas) were not independent factors (G = 14.0, df = 12, P < 0.0001). The depth distribution of seeds did not differ between defecation areas and their controls (G = 2.48, df = 2, P = 0.29). The seed size distribution varied with the type of site (G = 95.7, df = 2, P < 0.0001): very small seeds were overrepresented in sleeping sites compared with controls (Table 3). The seed size distribution varied also with depth (G = 25.1, df = 4, P < 0.0001): the smallest seeds (size class 1) were overrepresented in the top layer (0–2 cm) while size class 2 was overrepresented in deeper layers (2–4 and 4–6 cm). The discrepancy between very small (class 1) and moderately small (class 2) seeds in the depth at which they accumulated in the soil was ascertained in sleeping sites but was also apparent, although to a lesser extent, in controls.
Vertical distribution of size classes and viability of seeds in defecation and control areas.

Seed viability
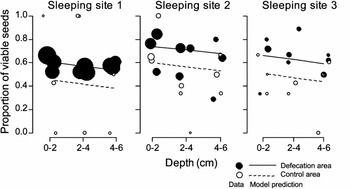
The proportion of viable seeds decreased with depth (Figure 4, Table 2). In defecation areas, viable seeds were on average in a higher proportion than in control areas and this was true whatever the depth and the sleeping site.
Proportion of viable seeds as a function of depth, plotted for three sleeping sites and for defecation and control areas of the red howler monkey (Nouragues reserve, French Guiana). For each plotted observation, the area of the circle is proportional to the total number of seeds collected in this sample (three samples per combination of site, area and depth). The predicted values of the corresponding model in Table 2 (last one) are plotted on the data (strait and dashed lines). As in Figure 1, a small amount of noise has been artificially added to the data on the x-axis to visualize overlapping points.

Pioneer species
Compared with control areas, pioneer species were significantly concentrated in defecation areas (χ2 = 134, P < 0.0001): there were 2321 vs 308 seeds of pioneer vs non-pioneer species in defecation areas while the ratio was 66:60 in control areas.
DISCUSSION
Endozoochory by red howler monkeys can result in a high abundance and species richness of small seeds in the soil under their sleeping sites, in line with the large numbers of small seeds in howler monkey faeces (Andresen Reference ANDRESEN2002b), although strong discrepancies were observed between the three sleeping sites. Our results are consistent with those of Julliot (1992) who observed that there were c. 50% more species in the soil seed bank under defecation areas compared with controls. Julliot (Reference JULLIOT1997) also measured an increase of seedling abundance under sleeping sites for five of six selected large-seeded species dispersed by howler monkeys. Generally, and as for most other dispersers, too, seed dispersal by red howler monkeys can contribute to a highly heterogeneous distribution of small as well as of large seeds as observed for other large primates (e.g. spider monkey, Ateles paniscus), ungulates (e.g. tapir, Tapirus terrestris) or birds (e.g. cock-of-the-rock, Rupicola rupicola) in the same study area (F.F., pers. obs., Théry & Larpin Reference THÉRY and LARPIN1993).
Our results showed a ‘latrine effect’ on the distribution of size classes and habits (pioneer vs non-pioneer species). According to our findings, very small seeds and seeds of pioneer species were significantly more frequent under sleeping and defecation sites. This observation points to a combination of random (seed concentration) and deterministic (filter) influences on the seed rain. Howler monkeys induce high local concentrations of seeds of pioneer species such as Cecropia spp. and Ficus spp., whereas bats consuming the same species defecate during flight and contribute to a more uniform seed rain (Charles-Dominique & Cockle Reference CHARLES-DOMINIQUE, COCKLE, Bongers, Charles-Dominique, Forget and Théry2001, Henry & Jouard Reference HENRY and JOUARD2007). A concentration of mostly viable Cecropia spp. seeds was observed in defecation areas of the howler monkey but it is assumed that the potential for emergence of those light-demanding species with photoblastic germination is limited to the upper layer of the soil (Pearson et al. Reference PEARSON, BURSLEM, MULLINS and DALLING2003).
Multiple factors are involved in the vertical distribution of the soil seed bank, as suggested by Marthews et al. (Reference MARTHEWS, MULLINS, DALLING and BURSLEM2008). Secondary dispersal by invertebrates is known to affect seeds in the short term (Dalling et al. Reference DALLING, SWAINE and GARWOOD1998). A quick and complete processing of dung by the dung beetle community was regularly observed immediately after dung deposition (Feer Reference FEER1999). Large amounts of clumped dung attracted large dung beetles such as tunnellers, the digging activity of which eventually moves small seeds which are already present in the soil up or down.
We detected cues of an enhanced level of activity by earthworms under howler monkey sleeping sites by microscopically analysing topsoil samples in the study area (Pouvelle et al. Reference POUVELLE, FEER and PONGE2008). Earthworms are known to ingest and move small seeds in tropical grassland (Decaëns et al. Reference DECAËNS, MARIANI, BETANCOURT and JIMENEZ2003) but their impact on the soil seed bank of tropical forests is still to be studied. Litter ants are also known to remove small seeds from dung and to carry them into their nests (Pizo et al. Reference PIZO, PASSOS, OLIVEIRA, Forget, Lambert, Hulme and Vander Wall2005). Marthews et al. (Reference MARTHEWS, MULLINS, DALLING and BURSLEM2008) showed that rain impacts may bury very small seeds, inasmuch as there is a network of interconnected pores in the topsoil: this is achieved by earthworms, which we showed to increase in activity in the topsoil after defecation (Pouvelle et al. Reference POUVELLE, FEER and PONGE2008). Our soil analyses showed an increase in organic matter and nutrient concentration in defecation areas (Pouvelle, unpubl. data), thereby suggesting a high level of biological activity through the stimulation of microbial processes. Together with these changes in biotic conditions, dung supply has an effect on abiotic conditions such as soil nutrient concentration (Feeley Reference FEELEY2005) and soil structure and aeration through soil invertebrate activity.
We showed that losses of viability are influenced by the ‘latrine effect’, a higher proportion of viable seeds being found under defecation areas. However, given that (1) the time elapsed since seeds have been buried was unknown but sampling took place a short time after a recent defecation event, and (2) viability decreased with depth, this suggests that seeds were on average in a fresher state in defection areas, which might explain the improvement in seed viability observed in defecation areas. When sleeping sites are frequently visited by the same troop, this may nevertheless contribute to ‘refresh’ the soil seed bank in a recurrent way.
It has been shown by Dalling et al. (Reference DALLING, SWAINE and GARWOOD1998) that most seeds of pioneer species fall and germinate in the vicinity of parent trees, supporting the view that distant dispersal of pioneer trees does not contribute to the soil seed bank of primary forests (Sauley & Swaine Reference SAULEY and SWAINE1988). Our results suggest that the ‘latrine effect’ contributes significantly to spatial escape. The concentration of small seeds under red howler monkey sleeping sites, more especially under those more often visited (Julliot Reference JULLIOT1997), could be advantageous because (1) invertebrate predator populations are locally saturated, (2) germination occurs far from parent trees and thus far from sources of species-specific pathogens and parasites, (3) the inclusion of seeds in dung could protect them from desiccation. However, after germination, the negative impact of competitive exclusion among clumped seedlings should not be neglected, except if disturbances such as herbivory may prevent it (Connell Reference CONNELL, den Boer and Gradwell1971, Janzen Reference JANZEN1970, Sheil & Burslem Reference SHEIL and BURSLEM2003).
In the light of results by Feer & Hingrat (Reference FEER and HINGRAT2005) and Forget & Jansen (Reference FORGET and JANSEN2007), any limitation of primate densities induced by fragmentation or increased hunting pressure, by hampering some of the complex interactions among plants and soil organisms which contribute to their successful establishment (Blouin et al. Reference BLOUIN, ZUILY-FODIL, PHAM-THI, LAFFRAY, REVERSAT, PANDO, TONDOH and LAVELLE2005, Díaz et al. Reference DÍAZ, TILMAN, FARGIONE, Hassan, Scholes and Ash2005), may disturb the dynamics of pioneer species recruitment.
ACKNOWLEDGEMENTS
We are indebted to Pierre Charles-Dominique and the staff of the Nouragues Research Station (CNRS, French Guiana), for commodities and technical help during the field session. Financial support was given by the Muséum National d'Histoire Naturelle (Paris, France), which is gratefully acknowledged. Odile Poncy, Ellen Andresen, Thomas Engel and two anonymous reviewers are warmly acknowledged for comments made on a first draft of the manuscript.