Implications
The use of computed tomography (CT) makes it possible to obtain accurate body composition from live pigs. As these pigs are selection candidates for elite boars, this information is expected to substantially improve the accuracy of selection for carcass traits and growth of different body tissues. The CT image analysis is automated, so that the records on each boar are available for breeding value estimation shortly after scanning. This makes it possible for Norsvin (the Norwegian Pig Breeders Association) to breed for actual muscle growth.
Introduction
In the 1950s, systematic breeding for leaner pig meat became an important breeding goal, and as the leanness of the pigs is very heritable (ranging from 0.12 to 0.74 for 16 studies; Clutter and Brascamp, Reference Clutter and Brascamp1998), the Western modern breeds have become much leaner. Selection has been performed based on measurements of ultrasound backfat and loin measurements taken from live selection candidates or experimental dissection for carcass composition of full-sibs, half-sibs and offspring of the selection candidates (Clutter and Brascamp, Reference Clutter and Brascamp1998). The Norwegian dissection procedure has changed from the weighing of trimmed ham and loin, in addition to manual measurement of the loin eye area, to the dissection of the shoulder, loin and ham into different tissues for the prediction of lean meat percentage (LMP; Gjerlaug-Enger et al., Reference Gjerlaug-Enger, Aass, Ødegård, Kongsro and Vangen2010a).
A third option to determine body composition is the computed tomography (CT) technology, which is commonly used for human diagnostic purposes, and can also be used for detailed measurements of different tissues in sheep (Afonso, Reference Afonso1992; Vangen and Thompson, Reference Vangen and Thompson1992), intact iced halibut (Kolstad et al., Reference Kolstad, Vegusdal, Baeverfjord and Einen2004) and different pig breeds (Luiting et al., Reference Luiting, Kolstad, Enting and Vangen1995; Kolstad, Reference Kolstad2001). The advantage with CT is that it can be used as a non-destructive method without killing the animal. Phenotypes on many animals are required for genetic analyses. A few studies on sheep have used CT data for the estimation of genetic parameters (Jones et al., Reference Jones, Lewis, Young and Simm2004; Kvame and Vangen, Reference Kvame and Vangen2007), but to the best of the authors’ knowledge, similar work has not been carried out previously on pigs.
Norsvin is running a boar-testing station with routine CT scanning of live pigs in a breeding programme, with an annual scanning capacity of 3500 live purebred boars. The image analysis at this boar test is completely automated and features specially designed software for the removal of non-carcass tissues to obtain a virtual carcass and for the calculation of several traits, for example, determination of body composition: kilograms of lean muscle, carcass fat, bone and non-carcass tissues. The LMP calculated from CT could, with only small adaptations, replace the LMP taken from dissection in the estimated breeding values (EBVs).
Determination of leanness is not straightforward, and unfavourable genetic correlations between growth and leanness (Mcphee et al., Reference Mcphee, Brennan and Duncalfe1979; Cleveland et al., Reference Cleveland, Cunningham and Peo1982) make joint improvement of these traits a challenge. Fowler et al. (Reference Fowler, Bichard and Pease1976) showed that lean meat growth can be selected by using an economic selection index that combines lean meat content and growth or by using lean meat growth, which is measured as lean gain per day. Clutter and Brascamp (Reference Clutter and Brascamp1998) proposed that lean meat growth is the most appropriate expression of the industry's objective for market pigs, whereas Chen et al. (Reference Chen, Baas, Mabry, Dekkers and Koehler2002) indicated that direct selection of EBV for lean meat growth with a multi-trait model yielded higher lean meat growth than a linear index of EBV for growth, backfat and the loin eye area.
The aims of this study were to calculate genetic parameters for the growth rate of muscle (MG), carcass fat (FG), bone (BG) and non-carcass tissues (NCG) based on CT data. The genetic correlations between these traits and more traditional production traits for slaughter pig efficiency, such as LMP, average daily gain (ADG) in early life and in the boar test period, and feed conversion ratio (FCR) in the boar test, will also be examined.
Material and methods
Animals
Data for this study were collected from August 2008 to August 2010 in Norsvin's boar testing station in southeastern Norway, and Norwegian Landrace (n = 3835) and Duroc (n = 3139) boars were included. Boars were kept in single-breed groups of 12 pigs/pen, and fed ad libitum on conventional concentrates containing 161 and 136 g digestible protein and 9.68 and 9.50 MJ net energy/kg before and after 50 kg, respectively, with 1 month of mixing the two feeds to facilitate the feed change. Major feedstuff compounds were barley, oats, peas, soya meal extract and rendering (animal) fat. The full-sib group size of tested boars was 1.1 for Landrace and 1.3 for Duroc, and the average half-sib group size was 35. The average start and end weight for the test was 25 and 100 kg live weight. The pigs started the test 2 days after entering the test station (average age was 67 days), and ended the test on the day they reached 100 kg with CT scanning a few days later. The boars are all selection candidates to be elite boars based on EBV and genetic uniqueness. More detailed information about the populations has been provided in Gjerlaug-Enger et al. (Reference Gjerlaug-Enger, Aass, Ødegård and Vangen2010b). Herd of origin were 37 L and nine D nucleus farms.
CT technology
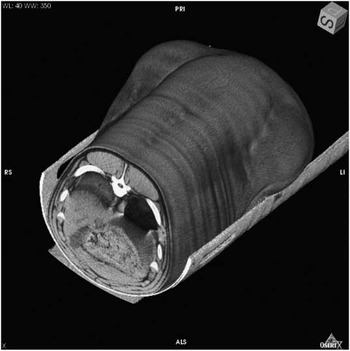
A General Electric (GE) multi-slice VCT LightSpeed scanner (PO Box 4220, Nydalen, 0401 Oslo, Norway) was used for the CT analysis. The protocol used is a helical scan with a 1.25-mm slice thickness and a soft tissue algorithm for reconstruction of the X-ray signal to image. The scanning of a pig takes 15 s and yields 1100 images (Figure 1). The scan starts and stops at the same anatomical position on each pig, as the entire body is scanned. Different tissues have different CT values, and a Hounsfield unit (HU) defines fat as having HU values from −200 to 0, muscle as HU values from 0 to 200 and bone as HU values from 200 and higher (www.medcyclopaedia.com). The images were analysed using an in-house developed MATLAB (The MathWorks Inc., 3 Apple Hill Drive, Natick, MA, USA) programme. The non-carcass tissues were removed to obtain a virtual carcass using distance measurements in the images relative to skin and internal fat. Previous carcass studies have shown that the volume and weight of different tissues (fat, muscle and bone) can be estimated directly from a stack of images with a constant slice thickness (Kongsro et al., Reference Kongsro, Roe, Aastveit, Kvaal and Egelandsdal2008). The volume of different tissues was estimated using the number of pixels classified as muscle, fat and bone, multiplied by slice thickness (volume) and the average density of muscle, fat and bone tissue to obtain the mass of the different tissues. The average densities of muscle, fat and bone tissue were 1.04, 0.95 and 1.36, respectively. The pixels were classified using a pixel value and column-wise neighbourhood operation classifier (The MathWorks Inc.) to classify pixels relative to ‘real’ tissues. The final parameters used in this study were the weight of lean muscle, carcass fat, bone and non-carcass tissues (the sum of internal organs and fat).
Spiral scan of a boar, 1100 slices. The images start from the middle of the pig, lying on the belly. The black area in the middle shows the air in the lungs, above the stomach.

The traits analysed were as follows:
(i) MG – average daily growth of muscle measured using CT from birth to the date of scanning, ∼100 kg live weight. The trait was defined as (kg muscle from CT)/(age100 kg).
(ii) FG – average daily growth of carcass fat measured usingh CT from birth to the date of scanning. The trait was defined as (kg carcass−fat from CT)/(age100 kg).
(iii) BG – average daily growth of bone measured using CT from birth to the date of scanning. The trait was defined as (kg bone from CT)/(age100 kg).
(iv) NCG – average daily growth of non-carcass tissue measured usingh CT from birth to the date of scanning. The trait was defined as (kg non-carcass tissue from CT)/(age100 kg).
(v) LMP – the mass of muscle tissue was divided by the total mass of the carcass, and all the variables were measured using CT. The trait was defined as (kg muscle from CT × 100)/(kg muscle + carcass−fat + bone from CT).
(vi) ADG from birth to 25 kg (ADG1) – young boars start the test a couple of days after entering the testing station, and the pigs’ age at test start is corrected to age at 25 kg. Individual weights are automatically recorded by the Feed Intake Recording Equipment (FIRE) system (Osborne Industries Inc., Osborne, KS, USA). The trait was defined as (25 kg)/(age25 kg).
(vii) ADG from 25 kg to 100 kg (ADG2) – the boar test ends when the pigs reach 100 kg, as measured through the FIRE system. The pig's final test weight is ∼100 kg, and is corrected to 100 kg. The trait was defined as 75 kg/(age100 kg−age25 kg).
(viii) FCR from 25 to 100 kg – using the FIRE system under an ad libitum feeding regime, the individual daily feed intake is recorded for the boars. All visits to the feeding dispensers are logged, which is the basis for the individual feed consumption daily and for the entire testing period. The pigs are fed two types of feed in a distribution of ∼1 : 2, and the feed energy consumed is estimated assuming 9.56 MJ net energy/kg feed. The trait was defined as feed intake (MJ)/(75 kg).
Statistical analyses
Least square means for breed
SAS Proc GLM with the least square means procedure (SAS Institute Inc., Cary, NC, USA) was used to estimate the effect of breed. An analysis was performed with both breeds in one analysis, but without herd of origin effect, due to confounding between herd and breed. The fixed effects were breed, year × month of birth, mother's parity number and number of live born in the litter the boar originated from.
Quantitative genetic analyses
Initial computations were performed on each breed separately using SAS Proc GLM to evaluate the non-genetic factors to be included in the model. For the traits analysed, the tested fixed effects were herd × year, year × month, parity number and the number of live born. Only significant effects were included in the final models, and various sub-models of the full model were used for further genetic analyses.
The significant effect of pen was included as a random effect in models for all traits. The significance of the random effects of pen was tested using a likelihood ratio test. A random effect of litter was not included due to small full-sib groups. In the quantitative genetic analyses, each breed was analysed separately. The traits (MG, FG, BG, NCG, LMP, ADG1, ADG2 and FCR) were analysed in sub-groups as described below, using a general multi-trait animal model for the genetic analyses:

where Y is a vector of observations, β, u, p and e are vectors of fixed, random additive genetic, random pen and residual effects, respectively, and X, Z and Q are known incidence matrices. An estimation of (co)variance components was performed using multi-trait animal models and analysed using the restricted maximum likelihood methodology. The DMU 6.7 software package (Madsen and Jensen, Reference Madsen and Jensen2008) and the average information (AI) algorithm were used in the estimation. Asymptotic standard errors of (co)variance components were computed from the inverse AI matrix.
Owing to computational constraints because of linear dependency between the growth traits, all traits could not be analysed simultaneously using multi-trait analysis. To obtain the correlations between MG, FG, BG and NCG, these four traits were analysed based on a multi-trait model and presented in a first matrix. The second set of analysed traits (MG, FG, BG, NCG, LMP, ADG1, ADG2 and FCR) was examined in four analyses. Each analysis consists of LMP, ADG1, ADG2 and FCR, with MG, FG, BG or NCG added to each of the four analyses.
The pedigree file contained all tested animals and their ancestors traced back to 2002. The final pedigree files included 9336 Landrace and 6403 Duroc pigs.
Results
Fixed effects
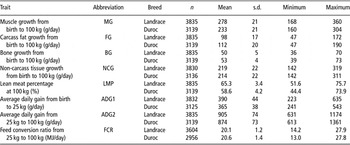
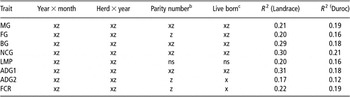
Descriptive statistics of the traits studied are presented in Table 1. Initial analyses on fixed effects for the traits produced the sub-models presented in Table 2, and the significant effects were included in the final models. Among the fixed effects, year × month had a significant effect on all the traits analysed. The herd of origin showed a large effect on the growth traits analysed. On average, the fixed effects account for 20.5% of the total variation (R 2) of the traits analysed here.
Numbers of animals per trait, mean, s.d., minimum and maximum values for Landrace and Duroc

Hypothesis test of fixed effects of the models for the analysed traitsFootnote a in Landrace and Duroc

x = significant effect (P < 0.05) for Landrace; z = significant effect (P < 0.05) for Duroc; ns = non-significant (P < 0.05).
a See Table 1 for definitions of trait abbreviations.
b Parity number of the litter the pig originated from, ranged from 1 to 3.
c Number of live born of the litter the pig originated from, ranged from 1 to 23.
Breed effects
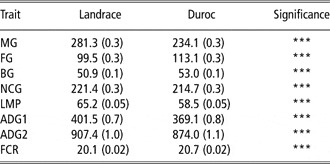
Least square means of the effect for breed are presented in Table 3. Landrace had higher MG and NCG and lower BG and FG than D. Landrace was the most efficient breed, with the highest LMP, ADG1 and ADG2, and the lowest FCR.
Least square meansFootnote a and s.e. (in brackets) of the breed effects for the analysed traitsFootnote b in Landrace and Duroc

a The fixed effects in GLM models were: breed, year × month, mother's parity number and number of live born.
b See Table 1 for definitions of trait abbreviations.
*** = P < 0.001.
Heritability estimates
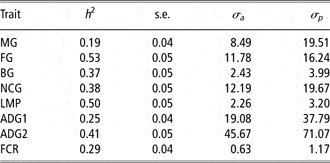
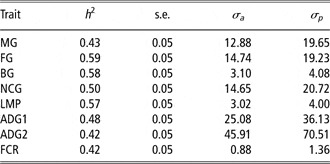
The CT and FIRE technology used to measure production efficiency yielded moderate-to-high heritability estimates for all traits in both breeds (Tables 4a and 4b). In general, Duroc had a higher additive genetic variation for the traits analysed than Landrace, in addition to higher estimated heritabilities. The estimated heritabilities for MG, FG, BG, NCG, LMP, ADG1, ADG2 and FCR ranged from 0.19 to 0.53 in Landrace and from 0.42 to 0.59 in Duroc.
Heritabilities (h 2) for the analysed traitsFootnote a with s.e., genetic and phenotypic s.d. (σa and σp, respectively) in Landrace

a See Table 1 for definitions of trait abbreviations.
Heritabilities (h 2) for the analysed traitsFootnote a with s.e., genetic and phenotypic s.d. (σa and σp, respectively) in Duroc

a See Table 1 for trait abbreviation definitions.
Genetic correlations
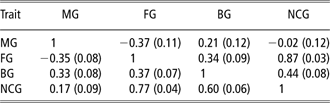
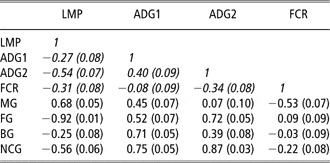
The genetic correlations between the growth of different tissues for the live pigs are shown in Table 5. MG is negatively correlated with FG and uncorrelated with NCG with both breeds. FG and NCG are highly correlated. BG is positively correlated with all other traits (MG, FG and FG).
Genetic correlations and s.e. (in brackets) among traitsFootnote a of growth of body composition for Landrace (above diagonal) and Duroc (below diagonal)

a See Table 1 for definitions of trait abbreviations.
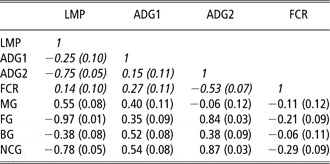
The estimated genetic correlations between traditional production traits and the growth rate of different tissues for the live pigs at 100 kg are shown in Tables 6a and 6b. With only a few exceptions, the sign and magnitude of the parameters were similar for both breeds. The genetic correlations between FCR and the other traits seem to differ most between the two breeds. On the basis of current analyses, LMP is positively correlated with MG and negatively correlated with FG, BG and NCG. ADG1 is positively correlated with MG, FG, BG and NCG and ADG2 is almost uncorrelated with MG. The ADG2 is highly unfavourable and positively correlated with FG and NCG and moderately to positively correlated with BG. FCR showed a moderate-to-high favourable correlation to MG in Duroc.
Genetic correlations and s.e. (in brackets) among traitsFootnote a of slaughter pig efficiency and growth rate of different body tissues for Landrace

a See Table 1 for definitions of trait abbreviations.
Correlations in italic are average values from different analyses.
Genetic correlations and s.e. (in brackets) among traitsFootnote a of slaughter pig efficiency and growth rate of different body tissues for Duroc

a See Table 1 for definitions of trait abbreviations.
Correlations in italic are average values from different analyses.
Discussion
Breed differences
Landrace is a highly efficient breed, and Norwegian Landrace is bred today as a dam line. Owing to high efficiency of the breed (ADG1, ADG2 and FCR) and leanness (Table 3), further genetic gain for increased leanness is not desirable. The Norwegian Duroc is bred as a sire line, but due to the high weighting on meat quality traits and shorter selection history for this breed, the efficiency and leanness are not at the same level as Landrace.
Heritability estimates
This study showed that the CT technology yielded medium-to-high estimated heritabilities for MG, FG, BG, NCG and LMP, and medium high heritabilities for ADG1, ADG2 and FCR. There were no studies with genetic parameters in the literature on FG, BG or NCG, but in this study, all these traits showed higher heritabilities than MG in both breeds. MG is less heritable than LMP. This may be due to the higher heritability for FG, which seems to explain the majority of the genetic variation in LMP. The lower heritability for MG than FG shows that fat tissue growth has a higher heritability than muscle tissue growth.
To the authors’ knowledge, MG, calculated from CT images, has not been analysed previously. Nevertheless, the lean meat content can be predicted from ultrasound measurements of backfat and loin, which can then be used for the prediction of lean meat growth (PLMG). In studies of PLMG, heritability estimates range from 0.37 to 0.47 (Stern et al., Reference Stern, Johansson, Rydhmer and Andersson1993; Cameron, Reference Cameron1994; Chen et al., Reference Chen, Baas, Mabry, Dekkers and Koehler2002). These estimates are in the range of our estimate for Duroc, whereas Cameron and Curran (Reference Cameron and Curran1994) found a lower heritability (0.25) at the same magnitude as our estimate for Landrace. All those parameters for PLMG originate from ultrasound measurements of backfat and loin. This indicates that the heritability of MG from CT in our study does not yield any higher heritability than the PLMG from ultrasound measurements in other studies. However, the CT measures the muscle directly and might yield the true variation of the trait more correctly. The high heritability for PLMG from ultrasound measurements might be a result of the less unfavourable genetic correlation between ADG and ultrasound-predicted LMP in these studies.
This is the first study to present heritabilities for LMP estimated from CT scanning of live pigs. A similar size in heritability has been reported by Kvame and Vangen (Reference Kvame and Vangen2007), who studied genetic variation in a Norwegian sheep population with CT. Duroc exhibited a larger genetic variation for LMP than Landrace. The heritabilities for LMP in this study are slightly higher than those estimated for these two breeds with the previous method used in Norsvin: an experimental dissection for carcass composition of half-sibs tested females and castrates (Gjerlaug-Enger et al., Reference Gjerlaug-Enger, Aass, Ødegård, Kongsro and Vangen2010a). However, the genetic standard deviation of LMP has increased from 1.50 to 2.26 for Landrace and from 1.67 to 3.02 for Duroc, which means that there is a considerably larger genetic variation for LMP measured with CT than measured with dissection. Estimated heritabilities for LMP in our study were consistent with the corresponding estimates (ranging from 0.41 to 0.68) reported by Ducos et al. (Reference Ducos, Bidanel, Ducrocq, Boichard and Groeneveld1993), Sonesson et al. (Reference Sonesson, de Greef and Meuwissen1998) and Gilbert et al. (Reference Gilbert, Bidanel, Gruand, Caritez, Billon, Guillouet, Lagant, Noblet and Sellier2007). All studies calculated an LMP based on a cutting procedure and the weight of lean meat for different premium cuts expressed as a percentage of the half carcass weight. Traits associated with fatness generally have high heritability and estimated heritabilities for ultrasonic backfat ranged from 0.35 to 0.72 in some studies by Ducos et al. (Reference Ducos, Bidanel, Ducrocq, Boichard and Groeneveld1993), Hoque et al. (Reference Hoque, Suzuki, Kadowaki, Shibata and Oikawa2007) and Solanes et al. (Reference Solanes, Reixach, Tor, Tibau and Estany2009).
Heritability estimates were higher for ADG1 in Duroc than in Landrace, and these heritabilities were higher than or comparable to those obtained for the ADG from birth to weaning and the ADG from weaning to 12 weeks (0.15 and 0.27, respectively) as reported by Chimonyo and Dzama (Reference Chimonyo and Dzama2007). Hermesch et al. (Reference Hermesch, Luxford and Graser2000) tested pigs from 3 to 18 weeks, thereby overlapping our ADG1 and ADG2 periods, and the heritability estimates were 0.10 in Large White and 0.48 in Landrace. This study also demonstrated the importance of the litter effect (random effect of the litter that the piglet came from). In our study, we did not include any litter effect, due to the small full-sib group and problems with computational constraints. This might have yielded overestimated heritability for ADG1 in Duroc, as this breed had a full-sib group size of 1.3 and also higher heritability for this trait than Landrace, which had a full-sib group size of 1.1. The heritabilities for growth in the testing station period (ADG2) were of the same magnitude (ranging from 0.30 to 0.52) as those reported by Ducos et al. (Reference Ducos, Bidanel, Ducrocq, Boichard and Groeneveld1993), de Vries et al. (Reference de Vries, van der Wal, Long, Eikelenboom and Merks1994) and Suzuki et al. (Reference Suzuki, Irie, Kadowaki, Shibata, Kumagai and Nishida2005).
The estimated heritabilities for FCR, particularly for Duroc, were larger than those (ranging from 0.15 to 0.27) reported by Hoque et al. (Reference Hoque, Suzuki, Kadowaki, Shibata and Oikawa2007), Hermesch et al. (Reference Hermesch, Luxford and Graser2000) and Ducos et al. (Reference Ducos, Bidanel, Ducrocq, Boichard and Groeneveld1993). The FCR in our study was adjusted to a fixed growth period from 25 to 100 kg live weight, which might have had a positive effect on the size of the estimated heritabilities. The data are also routinely used in the breeding programme and both automated and manual cleaning of these data can be carried out; hence, the quality of data was good.
Relationship among growth of different tissues and slaughter pig efficiency
Genetic correlation between MG, FG, BG and NCG
In general, we expected positive correlations between the growth of different body tissues. Animals with a high growth rate will necessarily need a high growth for all their body components. However, MG was little correlated with the other traits, especially NCG, whereas FG and NCG were highly positively correlated in both breeds. The only negative correlation was estimated for the genetic correlation between MG and FG; thus, an antagonistic relationship exists between the growth of carcass fat and muscles.
Genetic correlation between LMP and MG, FG, BG and NCG
As expected, only MG was positively correlated with LMP. However, the highest genetic correlation was estimated between FG and LMP. This correlation was close to −1. Therefore, selection for increased LMP reduces FG to a high degree and affects the growth of the other body tissues to a smaller degree.
A genetic correlation between FG and LMP of close to −1 means that these traits are almost identical. One explanation for this is that carcasses consist of muscle, fat and bone. As the variation in bone percentage is very small, it can be expected that the correlation between LMP and fat percentage in carcasses is high, at close to −1. Thus, having a high negative correlation between FG and LMP is the same as having a high positive correlation between FG and fat percentage. A high FG is either due to a high ADG, a high fat percentage or a combination of a high ADG and fat percentage. ADG, particularly ADG2, is highly positively correlated with fat percentage. Therefore, the overall correlation between FG and fat percentage has to be high. On the other hand, a high MG is due to a high ADG, a high LMP or a combination of a high ADG and LMP. ADG, however, is negatively correlated with LMP, which means that the correlation between MG is much lower than LMP. This explains why FG is more correlated with LMP than MG.
Genetic correlation between ADG1 and MG
Selection for growth has different effects on the different tissues of the pig. ADG1 is positively correlated with all different types of tissue in the small pig, which indicates a general response in body size when selecting ADG1. Kolstad (Reference Kolstad2001) found no differences in leanness early in life (10 to 25 kg) between three lines that were very different in fatness as finished slaughter pigs. The three lines, the Norwegian Landrace, Duroc and a ‘backfat-line cross’, were CT-scanned several times from 10 to 105 kg. The ‘backfat-line cross’ was a crossbreed between Norwegian Landrace and a line from a selection experiment in which pigs were selected for high backfat and a low growth rate (Vangen, Reference Vangen1977). This ‘backfat-line cross’ had twice the amount of total fat compared with ordinary Norwegian Landrace at 105 kg (Kolstad, Reference Kolstad2001). Consequently, the high degrees of uniform distribution of different tissues in small pigs of different lines and breeds are obvious, and support our results with moderate genetic correlations between ADG1 and growth of all the different tissues.
Genetic correlation between ADG2 and FG
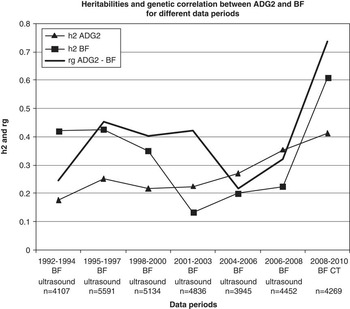
When looking at the parameters for Norwegian Landrace in earlier periods, the genetic correlation between backfat and ADG2 was less unfavourable with ultrasonic backfat measurements than with CT backfat measurements. This is shown in Figure 2, and all the analyses from earlier periods were performed simultaneously in 2010, so that the statistical analyses (models and methods) were the same for all periods. An extra generation for pedigree, in addition to the generations with data, was used for all periods. The backfat from CT was measured in the CT image, and the backfat measurement from ultrasound was real-time measured. Position was at the last rib on the live boars. The genetic correlations between backfat and ADG2 were in the range from 0.21 to 0.45 between 1992 and 2008 with ultrasound measurements. The heritabilities for backfat were in the range from 0.13 to 0.42 during this period. The largest part of fat reduction in Norwegian Landrace was achieved from 1958 to 1992, ranging from ∼30 to 8.1 mm backfat on Landrace boars at 90 to 100 kg. Only a few millimetres of fat reduction, ranging from 8.1 to 5.9 mm backfat on Landrace boars at 100 kg, was achieved from 1992 to 2010. There is a reduction in the phenotypic variation of backfat thickness for this selection period, and a reduction in heritability for backfat for the period of ultrasound measurements from 1992 to 2008. For the period of CT measurements from 2008 to 2010, we observed an increased heritability for backfat. CT uncovers new genetic variation due to the higher accuracy of estimation, and this new part of genetic variation has a stronger covariation with ADG2, yielding an increased genetic correlation between backfat and ADG2. Estimated heritabilities for ADG2 increased for this period (1992 to 2010) despite reduced phenotypic variance. A change from manual to electronic (FIRE) weighing was made in the data period, which positively affected the quality of the data.
Different levels of heritabilities for ADG2 and BF, and genetic correlations between ADG2 and BF at different data recording periods with different measurement methods (ultrasound v. CT) for Norwegian Landrace; ADG2 = average daily gain from 25 kg to 100 kg; BF = back fat; CT = computed tomography).

One theory of growth has been that selection for growth will produce leaner animals because a selection for growth is a selection for animals with steeper growth curves (Krieter and Kalm, Reference Krieter and Kalm1989; Kohn et al., Reference Kohn, Sharifi and Simianer2007). For this reason, selection for growth is expected to result in a higher adult weight and in less mature, leaner animals at a fixed weight, as fat growth is expected to increase around puberty. Estimated genetic correlations between backfat and growth were close to zero in a selection experiment with Landrace selected for increased fatness and reduced growth rate (Vangen, Reference Vangen1979). In a study by Hetzer and Miller (Reference Hetzer and Miller1972), also on relatively fat pigs, the results indicated that a selection for lower fatness should improve the growth rate in Duroc, whereas in Yorkshire, a higher leanness would result in slower growing pigs. A favourable or a small correlation between growth and leanness is, however, far from what we can interpret from our results. Modern, fast-growing, lean pigs such as the Norwegian Landrace and Duroc have a highly unfavourable genetic correlation between ADG2 and FG or LMP, which is in agreement with the results reviewed in a paper by Cleveland et al. (Reference Cleveland, Cunningham and Peo1982). The mean correlation between the ADG and backfat was 0.12, ranging from 0.26 to 0.55 for 11 studies from 1962 to 1994 (Clutter and Brascamp, Reference Clutter and Brascamp1998).
Early dissection studies on farm animals at different ages have made it possible to produce growth curves of different tissues, and the maximum growth rate for bone is reached before that of muscle, whereas fat is the last to be developed (Hammond, Reference Hammond1950). Modern pigs are fast-growing animals, and in our study, FG increased in the ADG2 period from 25 to 100 kg live weight. In addition, a pig is different from other farm animals, because of its high volume of subcutaneous fat in the carcass, whereas ruminants have more internal fat. Hammond (Reference Hammond1950) compared pigs with high/low v. low/high growth, both early (before 16 weeks) and late (from 16 to 34 weeks), in a growth period to 200 Ib live weight (90.7 kg). He found very different frames (body composition), despite having an equal final weight for the two tested groups. The pigs that had grown high/low had more bone and muscles, whereas the pigs that had grown low/high had a higher fat content. Although this was a feeding experiment, it supports our findings that pigs that grow fast in the beginning (ADG1) have higher MG, whereas pigs that grow fast in the later period (ADG2) have a higher FG. Despite the very high age in this study (100 days longer than for our pigs), the final weight was almost similar (10 kg higher in the present study).
Genetic correlation between MG and ADG2
Bennett (Reference Bennett1992) stresses the difference between predicted and actual measurements. If lean meat growth could be measured directly, then selecting for lean meat growth would be straightforward. However, composition is often predicted by indirect means. The relationship between PLMG and other traits can be different from the relationship of actual lean meat growth (ALMG) for the same traits. Hence, a selection for ALMG may be desirable, whereas a selection for PLMG may be undesirable. Therefore, ALMG is distinguished from PLMG, partly because fat affects PLMG more than ALMG.
Chen et al. (Reference Chen, Baas, Mabry, Dekkers and Koehler2002) estimated very high favourable genetic correlations (ranging from −0.80 to −0.86) between growth (number of days to 113.5 kg, not ADG, and therefore the opposite sign) and PLMG in Yorkshire, Duroc, Hampshire and Landrace. Mrode and Kennedy (Reference Mrode and Kennedy1993) also found a high genetic correlation (0.96) between growth (ADG from 30 to 90 kg) and PLMG in Yorkshire, Duroc and Landrace. This is very different from the parameters estimated in our study, with genetic correlations close to 0 between ADG2 and MG for both breeds. Some preliminary analyses attempted to determine the effect of trial (breed and environment) and the effect of the method and technology, as correlations between ADG2 and MG in our study are so different from similar parameters (i.e. PLMG) from other studies. The equation for PLMG (National Pork Producers Council (NPPC, 2000) from a study by Chen et al. (Reference Chen, Baas, Mabry, Dekkers and Koehler2002) was used to generate NPPC's PLMG for our Norwegian Landrace and Duroc pigs. Measurements for backfat and loin area were then taken from analyses of CT images. The NPPC's PLMG equation yielded similar results for the Norwegian breeds in terms of similar means and standard deviations as MG, but with different genetic correlations to other traits. Estimated genetic correlations between NPPC's PLMG and ADG2 were 0.32 (Landrace) and 0.21 (Duroc) points higher and more positive than the corresponding correlations between MG and ADG2, whereas genetic correlations between NPPC's PLMG and LMP were 0.35 (Landrace) and 0.27 (Duroc) points lower and less positive than the corresponding correlations between MG and LMP. Higher genetic correlations between MG and LMP than between NPPC's PLMG and LMP are expected as LMP originate from weight of different tissues measured with CT, but the high genetic correlations between NPPC's PLMG and ADG2 are more problematic. Therefore, the higher correlation between ADG2 and PLMG using ultrasound compared with CT might be overestimated as a result of the technology used. Lower genetic correlations between ultrasound-predicted LMP and ADG2 than between CT-predicted LMP and ADG2 might be one explanation. The growth period used in the studies was not identical, and growth early in life is more positively correlated with MG; nonetheless, this does not explain the differences between the correlations discussed here.
The size of genetic standard deviations (Table 4a and 4b) indicates that FG has a higher genetic variation than MG. Animals with high MG often have low FG, and therefore, not higher ADG2 in total. This is one explanation for the low genetic correlation between ADG2 and MG. A positive correlation between MG and ADG2 can only be estimated if there are less antagonistic relationship between FG and MG.
Genetic correlation between FCR and MG v. FG
Webster (Reference Webster1977) compared the energy required for protein deposition and fat deposition, and concluded that the same amount of metabolic energy is deposited in 1 kg of fat as in ∼8 kg of fat-free muscle. This supports the favourable genetic correlations between FCR and MG, especially in Duroc, as also reported by Hoque et al. (Reference Hoque, Suzuki, Kadowaki, Shibata and Oikawa2007). In contrast, more energy is required to maintain muscle tissue due to the higher metabolism in that tissue, whereas fat has a low metabolic activity. Webster (Reference Webster1981) found the energy demand for maintenance to be less per kg metabolic body weight in obese than in lean rats, but the differences disappeared when the maintenance was expressed as a function of lean mass. Kolstad and Vangen (Reference Kolstad and Vangen1996) found a higher maintenance requirement in Landrace, which was a faster growing breed, than in Duroc. This indicates that a selection for improved MG may increase the maintenance requirement. In our study, genetic correlations between FCR and growth of different tissues were small, except for FCR and MG in Duroc, which showed medium growth. There are small genetic correlations between FCR and the different body tissues in Landrace, and this might be because the low energy demand required for MG is outweighed by the greater need for maintenance for muscles than for fat. FG, on the other hand, costs more to grow but requires less energy to maintain.
There are opposite signs of the genetic correlation between FCR and LMP for Landrace and Duroc, and increased LMP is not positive for FCR in Landrace. This yields a low correlation between MG and FCR for this breed. In Duroc, both ADG2 and LMP are positive for FCR, yielding the positive correlation between MG and FCR.
The high genetic correlation between FCR and MG in Duroc is favourable, but only to a certain level. In the long term, a reduced FCR can reduce the ability of MG due to reduced appetite and feed intake. The minimum feed intake capacity should not be lower than the feed intake that maximises the potential for protein deposition and therefore MG, which was thoroughly discussed in papers by Hermesch et al. (Reference Hermesch, Kanis and Eissen2003) and Hermesch (Reference Hermesch2004).
Genetic correlation between ADG2 and NCG
A large volume of non-carcass tissues is undesirable, as there is no value for this tissue at slaughtering. The high genetic correlations between ADG2 and NCG, particularly in Landrace, may indicate that the pigs need larger internal organs to achieve fast growth. The estimated parameters in this study clearly show the unfavourable connection between ADG2 and NCG. NCG has not been discussed in earlier studies, but our results are in accordance with Bidanel and Ducos (Reference Bidanel and Ducos1996) and Norsvin's selection parameters, in which unfavourable genetic correlations between growth and dressing percentage were estimated. Dressing percentage is almost the inverse trait to the percentage of non-carcass tissues. However, a high ADG2 is highly influenced by FG, and the high genetic correlation between NCG and FG may thus point towards a connection between subcutaneous fat and internal fat. Therefore, large non-carcass tissues may consist of a high amount of internal fat and a lesser degree of internal organs such as the lungs, heart, stomach, intestines and liver, as these vary less between animals (J. Kongsro, personal communication). A selection against NCG or for a higher dressing percentage is controversial as the internal organs are needed to achieve a high production. Nevertheless, the amount of internal fat should be controlled, as this fat has low value. To maintain the dressing percentage unchanged, a balanced selection may be one strategy for this biological challenge.
Selection strategies
In an integrated pig industry, high MG of good quality meat is the main objective. MG combines requirements from both the pig producers and the meat industry. MG has a lower heritability than LMP and ADG2, but a selection for MG yields higher genetic gain than a selection for two unfavourably correlated traits. The estimated genetic correlations between MG and FG, NCG and BG are favourable or small, which makes it possible to select modern pigs for MG without compromising other traits such as FG, NCG and BG. In addition, ADG1, ADG2, LMP and slaughter percentage are not crucial for the breeding goal. Exclusion of so many traits from the breeding goal provides reduced information about the genetic gain in these traits, although it makes the variance component structure less complex. This allows for new possibilities to obtain estimated genetic parameters and breeding values for other traits such as meat quality, maternal ability, reproduction and health traits, together with the slaughter pig efficiency trait MG.
The high negative correlation between LMP and ADG2 makes it a challenge to find the optimal weighting of these traits in a total merit index. The challenge with a selection for only MG is to control the genetic progress for the component traits LMP, ADG1 and ADG2. The estimated genetic correlations indicate that a selection for an increased MG does not result in increased ADG2, whereas ADG1 will show a positive change. In view of maintenance costs, pig producers are aware that ADG2 is a more important trait than ADG1. In view of the estimated parameters, it is difficult to improve ADG2 without increasing FG, whereas animals with a high ADG1 and moderate ADG2 often have high MG and provide a more desirable carcass quality.
The genetic development of other traits is not affected by the choice of the selection strategy of MG v. LMP and ADG2. To illustrate this, the favourable correlation between MG and FCR in Duroc makes selection for both traits easy to obtain, although this is also the case with a selection for LMP and ADG2, with both traits being favourably genetically correlated with FCR.
Conclusions
CT technology has the unique ability to measure body composition in the live animals. Dissection methods of pigs for breeding purpose are often based on the composition of only a few cuts and ultrasound measurements recording leanness and muscle depth only at a few positions. Hence, the CT data provide more knowledge about the actual content of lean muscle in a carcass. This yields a larger variation in lean meat content and different genetic correlations to several traits.
The genetic parameters of the growth of different tissues measured with CT in this study provide new understanding of traditional slaughter pig efficiency traits, such as the antagonistic relationship between LMP and ADG2 in modern pigs.
MG seems to be a suitable trait for carcass quality and slaughter pig efficiency, in addition to being a biologically robust trait. MG is favourably correlated with FG, which simplifies the breeding. In cases in which LMP, ADG1 and ADG2 are optimally combined in a total merit index, the results are almost the same as those in the selection for MG.
Acknowledgements
This project was funded by the Foundation for Research Levy on Agricultural Products, the Research Council of Norway and Norsvin (Norwegian Pig Breeders Association). Norsvin, and in particular my colleagues at Delta, Norsvin's boar testing station, are gratefully acknowledged for their goodwill and enthusiasm in working with our new CT.