1. Introduction
Climate change interacts with multiple dimensions of human systems in different levels (Pachauri et al., Reference Pachauri, Allen, Barros, Broome and Cramer2014). An expanding economic literature has focused on the implications of climate change and variability for a wide set of economic outcomes, ranging from economic growth (Fankhauser and Tol, Reference Fankhauser and Tol2005; Burke et al., Reference Burke, Hsiang and Miguel2015) and agricultural production (Burke and Emerick, Reference Burke and Emerick2016) to fertility change (Casey et al., Reference Casey, Shayegh, Moreno-Cruz, Bunzl, Galor and Caldeira2019), conflicts (Brzoska and Fröhlich, Reference Brzoska and Fröhlich2016), health outcomes (Dasgupta, Reference Dasgupta2018) and migration (Parry et al., Reference Parry, Rosenzweig, Iglesias, Livermore and Fischer2004; Black et al., Reference Black, Bennett, Thomas and Beddington2011; Shayegh, Reference Shayegh2017). These studies have found a negative relationship between temperature rise and economic growth (and income equality) globally (Miguel et al., Reference Miguel, Satyanath and Sergenti2004). At the regional level, increase in rainfall has been positively linked to income growth in Sub-Saharan Africa and Latin America (Barrios et al., Reference Barrios, Bertinelli and Strobl2010; Hsiang, Reference Hsiang2010; Brückner and Ciccone, Reference Brückner and Ciccone2011). In these regions, the agricultural sector dominates the economy while it is largely based on small-holders. Therefore, the main linkage between weather, income and overall welfare can usually be traced through agriculture (Skoufias et al., Reference Skoufias, Vinha and Conroy2011; Dell et al., Reference Dell, Jones and Olken2014). Climate change affects both the quality and quantity of food production, reducing food security and nutrition intake among the most vulnerable population including women and children (Dillon et al., Reference Dillon, McGee and Oseni2015; Phalkey et al., Reference Phalkey, Aranda-Jan, Marx, Höfle and Sauerborn2015). Increasing temperatures and erratic rainfall are likely to harm agricultural production and the nutritional composition of crops (Wheeler and Von Braun, Reference Wheeler and Von Braun2013; Myers et al., Reference Myers, Smith, Guth, Golden, Vaitla, Mueller, Dangour and Huybers2017), while short-term but intense precipitation may damage harvests. Overall, droughts and floods have a larger impacts on the livelihoods of low-income groups and account for 70 per cent of the economic losses in Sub-Saharan countries (Shiferaw et al., Reference Shiferaw, Tesfaye, Kassie, Abate, Prasanna and Menkir2014).
Consequently, people whose livelihood depends on farming activities are likely to be heavily impacted by climatic shocks, starting from damages to their level of nutritional adequacy (Wheeler and Von Braun, Reference Wheeler and Von Braun2013). These effects on nutrition are likely to have repercussions on labor productivity; calorie deficit generally leads to poor health, which in turn reduces labor productivity and the time allocated to work (Aziz, Reference Aziz1995; Croppenstedt and Muller, Reference Croppenstedt and Muller2000). Some studies have established a clear link between labor supply and nutrient intake (Weinberger, Reference Weinberger2004; Jha et al., Reference Jha, Gaiha and Sharma2009; Linderhof et al., Reference Linderhof, Powell, Vignes and Ruben2016). Therefore, the health impacts of malnutrition on labor productivity can be considered as an indirect effect of climate change on labor supply (Kjellstrom et al., Reference Kjellstrom, Kovats, Lloyd, Holt and Tol2009; Graff Zivin et al., Reference Graff Zivin, Hsiang and Neidell2018).
Nevertheless, a direct effect of weather on labor supply has also been established; higher temperatures can lead to changes in the allocation of time to labor as well as leisure activities by modifying the marginal productivity of labor, especially in climate-exposed sectors such as agriculture or construction. Using data on time use, Graff Zivin and Neidell (Reference Graff Zivin and Neidell2014) find that workers in climate-exposed sectors reduce daily time allocated to labor by as much as 1 h (14 per cent reduction in labor supply) when daily maximum temperatures are above 29.4°C.
While labor supply is positively affected by the level of nutritional intake (Deolalikar, Reference Deolalikar1988; Thomas and Frankenberg, Reference Thomas and Frankenberg2002; Fink et al., Reference Fink, Jack and Masiye2014), the existing literature suggests that better nutritional status is also associated with higher wages, implying that access to adequate and nutritious food improves people's health along with their ability to work and be productive (Strauss, Reference Strauss1986; Hoddinott and Kinsey, Reference Hoddinott and Kinsey2001; Jha et al., Reference Jha, Gaiha and Sharma2009). Inadequate nutrition, on the other hand, creates a loss of income and growth through declining labor productivity (Croppenstedt and Muller, Reference Croppenstedt and Muller2000). Thus, nutrition plays a key role in improving labor productivity and boosting economic growth in regions where the labor force consists mainly of low-skilled and undernourished individuals (Case and Paxson, Reference Case and Paxson2008). Therefore, understanding the relationship between climatic factors and economic outcomes through the channels of labor supply and nutrition is crucial to better estimate the climate damage functions under future climate scenarios (Burke et al., Reference Burke, Hsiang and Miguel2015) and to support policy makers in implementing effective adaptation strategies.
This paper focuses on Uganda, a Sub-Saharan African country that is susceptible to the effects of climate change (Pearce et al., Reference Pearce, Cline, Achanta, Fankhauser, Pachauri, Tol, Vellinga, Bruce, Lee and Haites1996; McCarthy et al., Reference McCarthy, Canziani, Leary, Dokken and White2001). Malnutrition is already a major cause of morbidity in Uganda (FANTA-2, 2010) and any adverse climatic effects will likely lead to a deterioration of the current situation. Agricultural production is heavily dependent on rainfall; 80 per cent of the population is dependent on rain-fed agriculture for their livelihood (Turyahabwe et al., Reference Turyahabwe, Kakuru, Tweheyo and Tumusiime2013) and it is widely-based on the adoption of traditional technologies. Thus, Uganda can be considered a relevant case study for the analysis of labor supply, food security and climate change.
This paper aims to fill the gap in the existing literature by empirically investigating both the direct effect of climatic shocks on labor supply and the indirect effect through variation in dietary intakes using longitudinal micro survey data from Uganda combined with high-resolution climatic data. These econometric estimates are then used to calibrate an overlapping generations (OLG) model to project the future impacts of climate under a moderate Shared Socioeconomic Pathway (SSP) (Riahi et al., Reference Riahi, van Vuuren, Kriegler, Edmonds, O'Neill, Fujimori, Bauer, Calvin, Dellink, Fricko, Lutz, Popp, Cuaresma, KC, Leimbach, Jiang, Kram, Rao, Emmerling, Ebi, Hasegawa, Havlik, Humpenöder, Da Silva, Smith, Stehfest, Bosetti, Eom, Gernaat, Masui, Rogelj, Strefler, Drouet, Krey, Luderer, Harmsen, Takahashi, Baumstark, Doelman, Kainuma, Klimont, Marangoni, Lotze-Campen, Obersteiner, Tabeau and Tavoni2017) and four Representative Concentration Pathway (RCP) scenarios (Moss et al., Reference Moss, Edmonds, Hibbard, Manning, Rose, van Vuuren, Carter, Emori, Kainuma, Kram, Meehl, Mitchell, Nakicenovic, Riahi, Smith, Stouffer, Thomson, Weyant and Wilbanks2010).
The econometric results show that there is a non-linear impact of temperature on both calorie intake and labor supply and that weekly labor supply is maximized at a mean temperature of 21.3°C and a 10 per cent increase in calorie consumption leads to an increase in labor supply of approximately 0.86 h per week. Results from the OLG model suggest that under unmitigated climate change, relative productivity of the agricultural sector to the non-agricultural sector drops by 10 per cent while the supply of low-skilled labor to high-skilled labor drops by 12 per cent by the end of the century. Furthermore, an increase in the amount of low-skilled labor coupled with climate change impacts on sectoral productivity and labor supply reduces output per adult by 20 per cent during the last part of the century.
The paper is structured as follows. Section 2 describes the conceptual framework and the empirical strategy and section 3 depicts the dataset. Sections 4 and 5 provide the empirical and simulation results, respectively, while section 6 presents the final discussion and conclusions.
2. Empirical strategy
The impacts of climate change on nutrition and food security and labor supply have been investigated separately in the literature. However, since nutrition also affects labor supply, estimating the climatic impact of climate or weather-related variables on labor supply via ordinary least squares (OLS) could potentially result in biased estimates. In order to identify the full effect of climatic variability on labor supply, we employ a two-stage least squares (2SLS) fit with a Limited Information Maximum Likelihood (LIML) approach to estimate the effect of climate on food intake and labor supply separately. The first step derives a relationship between climatic variables and calorie intake ($C_{it}$ ) from food consumption for each individual i at time t (measured as week and year). Since $C_{it}$
 is endogenous, the two climate indicators, the Standardized Precipitation Index (SPI) and the Warm Spell Duration Index (WSDI),Footnote 1 are used as exogenous instruments;

Both the six-month SPI and WSDI are long-term climatic variables affecting food supply and agricultural production. In particular, in Uganda where own-grown production is the major source of food consumption, climatic factors can play a major role in food supply. However, these indicators are determined over the last six months (in the case of the SPI) and twelve months (in the case of the WSDI). Availability of the household members to work and be productive, on the other hand, is measured as the number of hours worked in a given week. Thus, these long-term indicators should have no impact on current labor supply decisions or unobserved factors affecting labor decisions of the household. Yet current climate variables, including precipitation and average or maximum temperatures during the week of the household survey, will have a direct impact on labor supply in the contemporaneous period. In order to estimate this effect, it is important to ensure that calorie intake, which is endogenously determined, is instrumented to use only the past climatic variable's explained part in the variation in food consumption as an explanatory variable in the labor supply equation. Moreover, all additional control variables in the second stage are included in the first stage regression as explained below, including household-specific and time fixed-effects, and a vector of additional control variables $\boldsymbol {X}_{it}$ . Hence, the estimation approach consists of estimating calorie intake based on the following equation including the exogenous regressors $Z_{it}$
 in the first stage (2);

In the second step, the causal effects of calorie intake and contemporaneous climate on weekly labor supply $({\rm LS}_{it})$ are identified. The structural equation can be written as:

The climatic variables included are average (weekly) temperature $T_{it}$ and its squared term to capture potential non-linear effects and total weekly precipitation $P_{it}$
 . The estimated calorie intake from the first stage, $\hat{C}_{it}$
 , also enters in the second equation, along with a matrix $\boldsymbol {X}_{it}$
 of other relevant control variables influencing individual labor supply including gender, marital status, number of years of education and total household income. Finally, a year-week interaction term is included along with household $\alpha _{i}$
 and survey wave fixed-effects $\gamma _{t}$
 .
Given the existing findings on the non-linear and ∩-shaped relationship of economic performance and in particular local temperatures, it is expected that for the set of coefficients of temperatures, $\tau _{1}>0,\tau _{2}<0$ . For this case, the results indicate a non-linear relationship with an ‘optimal’ value of the local temperature computed as $T^{\rm opt}= \vert \tau _{1}/(2\tau _{2}) \vert$
 . These estimates from the second stage are used to parametrize the economic model to project labor allocation under various climate change and socioeconomic scenarios. In order to account for the impacts of climate change on both labor supply and food consumption, we develop a structural model of a representative household where the decision on the education (skill) level of children is taken by altruistic parents. We use the framework provided by OLG models to study the behavior of each household and the mechanisms through which they adapt to the impacts of climate change, especially by adjusting their working hours and food consumption.
3. OLG model framework
The OLG framework is developed with two types of labor and a two-sector economy (Diamond, Reference Diamond1965; Galor, Reference Galor2011; Casey et al., Reference Casey, Shayegh, Moreno-Cruz, Bunzl, Galor and Caldeira2019). This model is generally able to capture most of the transformation characteristics of economy and labor. The services sector is not included here in order to get the closed form solutions for the model but it will be possible to add a third sector to the model in the future. One economic sector is assumed to be agriculture (denoted by a) that uses only low-skilled labor (Caselli and Coleman, Reference Caselli and Coleman2001; Gollin et al., Reference Gollin, Lagakos and Waugh2014). The other sector is non-agriculture (denoted by b) that uses only high-skilled labor. Individuals are distinguished by their skill level (denoted by s for high-skilled and u for low-skilled). The low substitutability assumption between the two types of goods allows labor to reallocate towards the more impacted sector and region where the demand is higher. The population projection under the SSP2 scenario is then used to calibrate the model.
Individuals live for two periods and can be either high-skilled (s) or low-skilled (u). The decision about the skill level of the children is made by their parents in order to maximize the utility function that reflects consumption of goods and altruistic benefits from the future wages of the children (Becker and Barro, Reference Becker and Barro1988). Parents will provide different skill levels to their children in order to make them suitable for higher wages in the future.
In the first period of their lives, they are children who only consume parental time (Galor, Reference Galor2011). In the model, a child of type j consumes $\tau ^{j}$ units of parental time. In the second period of their life, they will be assigned to each of the two sectors based on their skill level. As adults, they work, consume goods, and have children for the next period of their life. The objective of each individual is to maximize lifetime utility of consumption and their children's future well-being by making consumption and fertility decisions. Providing different skill levels for children is considered a child-rearing cost that consumes parental time. The child-rearing costs for raising low-skilled and high-skilled children are different and they depend on the skill level provided. Although the model can be solved to yield the optimal fertility decision in addition to skill levels of the children, we only focus on the skill optimization part of the model and do not allow for fertility to be a decision variable. Instead, the model is calibrated to reflect the projection of adult population growth and skill ratio under the middle-of-the-road SSP2 scenario.
3.1. Utility maximization
The utility function comprises the immediate consumption of the adults and the future wages of their children based on their skill level and supply under different climate projections. This captures the altruistic attitude of parents;

where $n_{t}^{j}$ is the number of children with skill level j, and $c_{t}$
 is consumption of a bundle of agricultural and non-agricultural goods. The variable $w_{t+1}^{j}$
 is the future wages of children of type j and $d_{t+1}^{j}$
 is the future supply of the children under projected climate change impacts. Variable $d_{t+1}^{j}$
 ranges from 0 to 100 per cent and reflects the change in labor supply due to climate change. We use the empirical equation (3) in section 2 to estimate the loss in labor supply due to increase in mean temperature. In other words, variable $d^{j}$
 is the normalized form of variable ${\it LS}_{it}$
 . When temperature is at its optimal point, the loss in labor supply is zero (i.e., $d_{t+1}^{j}=1$
 ) and the labor force will be fully accounted for in the production function. However, any deviation from the optimal temperature will result in $d_{t+1}^{j}<1$
 and therefore only a fraction of labor will contribute to economic production. We assume that parents' wages are spent either on raising children or consumption of goods and therefore, there is no saving in the model. This is particularly true for rural areas of Uganda with subsistence farming. The price index of the consumption composite is normalised to one. Thus, the budget constraint corresponding to equation (4) for every adult is given by:

The maximization of (4) subject to (5) yields:

Equation (6) encapsulates the quantity-quality trade-off. Because of $\tau ^s>\tau ^u$ and the total time devoted to raising children (γ) is fixed, individuals must decide between investing in a smaller number of children but with higher skills and higher potential income and having a greater number of total children with lower skills and lower potential income. This equation also shows that only the parents' consumption level is dependent on their wages and the number and skill level of the children are independent of the level of their parents' wages. For individuals to have both types of children, it must be:

This equation shows that the future wages of children when they enter the labor market in their adulthood is a reflection of the time their parents spent on raising them. In the absence of climate change impacts on labor supply (i.e., $d_{t+1}=0$ ), the wage ratio remains constant and equal to the ratio of child-rearing costs.
3.2. Consumption
The level of utility for the labor of skill level j is a constant elasticity of substitution (CES) function given byFootnote 2 :

where ε is the elasticity of substitution, $c_{a}$ is consumption of the agricultural good, $c_{b}$
 is consumption of the non-agricultural good, and δ is the food consumption factor that reflects the change in food consumption due to the changes in temperature. We use the empirical equation (2) in section 2 to estimate the change in food consumption due to increase in mean temperature. In other words, variable δ is the normalized form of variable $C_{it}$
 . Together, $\alpha \cdot \delta$
 represents the share of agricultural good in the composite good. Variable δ demonstrates how the share of agricultural good (i.e., food consumption) changes from the baseline food consumption in year 2000 due to climate change. The food consumption at each time step is estimated by equation (2) given the temperature in that time. As ε approaches zero, consumers get less satisfaction from substituting non-agricultural goods for agricultural goods. In the limit, there is no substitution and the goods are consumed in fixed proportions. The consumer optimization problem conditioned on the budget constraint can be formulated using the Lagrangian multiplier λ,

where $p_{b}$ and $p_{a}$
 are the prices of non-agricultural and agricultural goods, respectively. The solution to this optimization problem provides a relationship between these prices:

3.3. Production
The linear production function employed captures the fact that agricultural production is relatively less skill-intensive (Caselli and Coleman, Reference Caselli and Coleman2001; Gollin et al., Reference Gollin, Lagakos and Waugh2014). In this respect, this model can therefore be seen as a simplified version of the sectoral migration model of di Giovanni et al. (Reference di Giovanni, Levchenko and Ortega2015). Specifically,


where $Y_{a}$ and $Y_{b}$
 are outputs in the agricultural and non-agricultural sectors respectively. $L^{j}$
 is the available labor with skill level j after considering climate impacts on labor supply. Total factor productivity (TFP) in sector ϰ is defined as $A_{\varkappa }$
 , and $D_{\varkappa }$
 is the climate impact function for sector ϰ at temperature T.
TFP evolves exogenously according to following equations:

The gross number of laborers with skill level j will be:

where $N_{t}$ is the adult population at time t. The net number of laborers with skill level j will be calculated by taking into account the impacts of climate change on labor supply:

Wages can be calculated by taking the derivative of equations (11) and (12):


This will immediately give

This equation can be rearranged to get

where $D^{r}={D_{b}}/{D_{a}}$ and $A^{r}={A_{b}}/{A_{a}}$
 are relative productivity and relative TFP in the non-agricultural sector compared to the agricultural sector, and $d^{r}={d^{s}}/{d^{u}}$
 is the relative supply of high-skilled to low-skilled labor.
The consumption of good type ϰ by adults of each skill level is calculated by solving a system of equations:

which gives us:

3.4. Climate change impacts
To analyze the effect of carbon concentrations in the present model, the projections from four RCPs are combined to obtain the average annual temperature of Uganda in the 21st century. There are three forms of climate change impacts represented in the present model.
First, the sector-specific impact function can be obtained from Desmet and Rossi-Hansberg (Reference Desmet and Rossi-Hansberg2015) as:

where $g_{b,0}=0.3$ , $g_{b,1}=0.08$
 , $g_{b,2}=-0.0023$
 , $g_{a,0}=-2.24$
 , $g_{a,1}=0.308$
 , and $g_{a,2}=-0.0073$
 . The constant $D_{\varkappa }^{\min }$
 guarantees the minimum level of economic output at very high climate impacts. For the present analysis the main assumption is that $D_{\varkappa }^{\min }=10\%$
 . The impact function thus has the shape of a quadratic function with an optimal temperature between 17.4°C (non-agriculture) and 21.1°C (agriculture), and with a maximum productivity loss of 90 per cent. The shape of this function is depicted in figure 1.
Impact function for the agricultural and manufacturing sectors (sectoral efficiency for different temperatures) based on Desmet and Rossi-Hansberg (Reference Desmet and Rossi-Hansberg2015).

Second, low-skilled labor supply is also affected by temperature. The econometric analysis is used to obtain the marginal impacts of climate change on labor supply (parameter $d_{t+1}^{j}$ in equation (4)). Finally, as food consumption can change as a result of climate change, the final empirical results are used to obtain the marginal impacts of climate change on agricultural consumption (parameter δ in equation (8)).
3.5. Equilibrium
Combining equations (10) and (19), we can calculate the optimal ratio of high-skilled to low-skilled labor. We use the fact that total consumption of each type of good is equal to the production of that good. Therefore, starting from equation (10) we have:

If we combine this with equation (19), we get:

Rearranging this equation will give us:

At each time period the population of adults is given from the SSP2 projection data:

Using equations (22) and (23), it is possible to calculate the number of children with each skill level given the future climate and population growth trajectories. This equation allows us to investigate the role of climate change in altering human capital accumulation in the long term. If an increase in temperature negatively affects the agricultural sector more than the non-agricultural sector, then the ratio $D^{r}$ is increasing in temperature. Similarly, if low-skilled labor is more affected by the rise in temperatures than high-skilled labor, the supply ratio $d^{r}$
 is increasing in temperature. If $\epsilon <1$
 (i.e., the substitution between goods is sufficiently low), then both factors will contribute to a decrease in the relative wages of high-skilled individuals. This raises the relative return to working in agriculture, causing parents to have relatively more low-skilled children. The third factor, the impacts of temperature on food consumption, is captured by parameter δ which has a non-linear behavior in temperature. Therefore, it can either amplify the impacts of climate change in lowering the skill ratio or counteract it and help reduce the impact of climate change on the skill ratio.
4. Data description
The empirical analysis uses a micro data dataset from the World Bank Living Standards Measurement Study - Integrated Surveys on Agriculture (LSMS-ISA). This is a longitudinal dataset on Ugandan rural households. Although it is designed mainly to address agricultural issues, the stratification by urban/rural and district ensures their appropriate representativeness. This is a nationally representative dataset, collected annually and conducted in two visits with the purpose of better capturing agricultural outcomes from the two cropping seasons of the country. It provides detailed information on household and individual demographic characteristics, local market structure, agricultural production, off-farm income and other sources of income. The data also includes idiosyncratic shocks and variables strictly related to labor supply, food security and nutrition from three waves conducted in 2009–2010, 2010–2011 and 2011–2012.
In the following analysis, two dependent variables are considered: labor supply and calorie intake. Labor supply is constructed based on the question of ‘how many hours the household member worked during the last week’. That is, it measures actual hours worked and can be interpreted as the equilibrium in the labor market, given that we do not have specific data on labor supply and demand. Furthermore, given the large share (around two-thirds) of the informal sector in Uganda, we assume that labor supply decision is measuring mostly labor supply and hours worked decided by each household member rather than the (formal) labor market.
Calories are not directly reported in the LSMS-ISA for Uganda but can be constructed by using the information recorded on food consumption in the household questionnaire. More specifically, each household head responding to the interviewer provides information on the food purchased, home-produced or received as a gift and consumed in the last seven days by the household. In order to do so, a detailed and extensive list of food (pulses, fruit, vegetables, cereals, fish, meat and animal products) and beverages is included in the questionnaire each year. The respondents are asked whether or not their household consumed that specific food item, for how many days in the last week and the quantity consumed. Similar to survey data from other developing countries, Uganda provides information on food quantities in terms of non-standard units of measures. We converted the local units of measures into kilograms using the conversion table provided by the World Bank (Oseni et al., Reference Oseni, Durazo and McGee2017) for the Uganda LSMS-ISA survey (Carletto et al., Reference Carletto, Zezza and Banerjee2013). Since not all the food item measurements could be converted in kilograms, some of them were replaced by values reported by the farmers. Where both forms of information are missing, manual imputations were made from the abovementioned study. As mentioned above, calories are not collected in LSMS ISA surveys, therefore calorie tables have been built based on the Uganda LSMS-ISA survey data 2005–2006 (Harttgen and Klasen, Reference Harttgen and Klasen2012). The decomposition of calorie consumption across food items (figure 2) shows that more than half of the calorie intake comes from six main stable crops.
Composition of average calorie intake per capita by major food item in Uganda between 2009 and 2011.

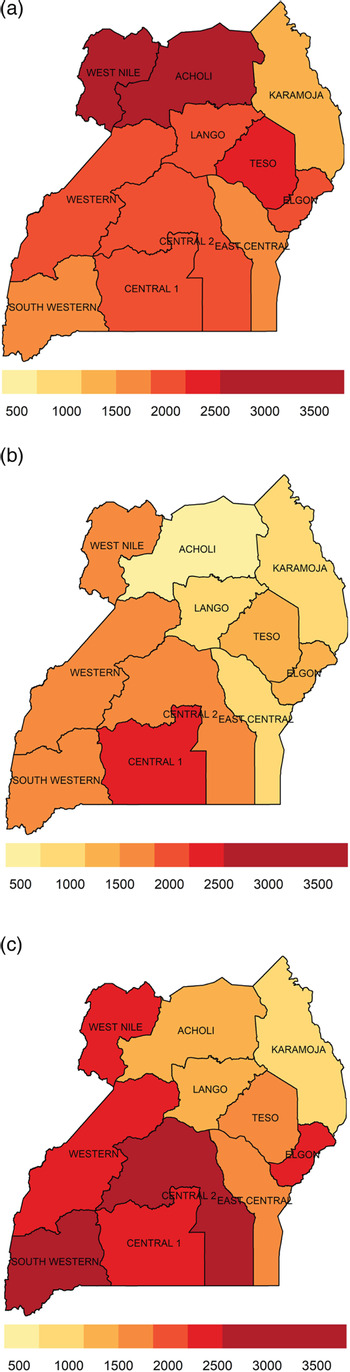
Calorie intake is weighted according to an adult-equivalent scale for calorie requirements. Weekly individual calorie intake is obtained by weighting the weekly household calorie intake by 14 different coefficients depending on the sex and age of each individual (Claro et al., Reference Claro, Levy, Bandoni and Mondini2010). Finally, individual daily calorie intake is computed by dividing the weekly variable by seven.Footnote 3 The maps in figure 3 show the spatial distribution of calorie intake across Uganda over time and suggest a substantial variation in both dimensions.
Average daily calorie intake per capita by regions in Uganda between 2009 and 2011. (a) 2009, (b) 2010 and (c) 2011.

The estimated values are consistent with those presented in the work by Ssewanyana and Kasirye (Reference Ssewanyana and Kasirye2010). Following Dell et al. (Reference Dell, Jones and Olken2014), we distinguish between weather and climate shocks, where climate describes the distribution of outcomes which may be summarized by averages over several decades (long periods of time), while weather refers to a particular realization from that distribution. The advantage of using climate/weather variables, as noted by Angrist and Krueger (Reference Angrist and Krueger2001), is that they are exogenous and random in most economic applications. In particular, this paper distinguishes between contemporaneous weather (based on the condition in the week of the interview) and medium- and long-term measures commonly used to evaluate conditions relevant for agricultural yields and other outcomes.
Climatic data come from the Global Land Data Assimilation System (GLDAS) v2.1. This is a global gridded reanalysis dataset (Rodell et al., Reference Rodell, Houser, Jambor, Gottschalck, Mitchell, Meng, Arsenault, Cosgrove, Radakovich, Bosilovich, Entin, Walker, Lohmann and Toll2004) with a spatial resolution of $0.25^{\circ } \times 0.25^{\circ }$ and 3-hourly temporal resolution. Along with weekly mean temperature and total precipitation, the analysis includes the 6-month SPI and the WSDI. The indices were obtained and extracted for Uganda from the dataset of climate extreme indices documented in Mistry (Reference Mistry2019a, Reference Mistry2019b). The six-month SPI is based on the probability of precipitation for any time scale and the calculation is based on the long-term precipitation. The long-term record is then fitted to a probability distribution, which is then transformed into a normal distribution (Edwards and McKee, Reference Edwards and McKee1997). The six-month SPI is an indicator of seasonal to medium-term trends in precipitation (World Meteorological Organization (WMO), 2012) and a comparison of precipitation for a specific six-month period to the precipitation totals for the same six-month period for the period 1970–2016. The frequency of the 6-month SPI below the threshold of $-1.5$
 in a given year is computed to obtain an indicator of medium-term drought. The WSDI is the annual count of days with at least six consecutive days when the daily maximum is above the 90th percentile. Table 1 shows the summary statistics of the variables used in the analysis.
Summary statistics

5. Empirical results
Empirical findings show that the weekly labor supply is maximized at $T^{\rm opt}=21.3^{\circ }$ C and that the labor supply is non-linear and concave in weekly mean temperature (figure 4). These results suggest that while the low-skilled labor supply increases with initial increases in weekly mean temperature, beyond this threshold, any increments in temperature result in a negative impact on the number of hours worked. Food consumption, as expected, has a positive and strong impact on labor supply, indicating that a 10 per cent increase (column 2 in table 2) in calorie intake leads to an increase of about 0.86 h worked per week.
Non-linear relationship between mean weekly temperature and weekly labor supply (dark navy line) for the low-skilled sector with 95 per cent confidence interval (light blue spikes). Instrumental variable regression with six-month SPI and WSDI as instruments. Specification controls for gender, number of years of education, marital status, total household income, total weekly precipitation, and a year-week interaction-term. $\alpha _{i}$ and $\gamma _{t}$
 are household and wave fixed-effects, respectively.

Main regression results

Notes: Robust p-values in parentheses, $\text {***}p<0.01,\ \text {**}p<0.05,\ \text {*}p<0.10$ .
In the main specification of the regression model used in this paper, the coefficients of both the instrumental variables are negative, suggesting that both medium- and long-term climatic stressors have negative impacts on calorie consumption channeled through agricultural production. We find that the under-identification test (Kleibergen-Paap rk LM statistic) is rejected while the Hansen test based on the J-statistic (over-identification test of all instruments) cannot be rejected, suggesting that the instruments used are valid. Table 2 shows the estimation results of the main specification alongside the simple (biased) OLS estimation of labor supply.
Interestingly, mean weekly temperature has a ∪-shaped relationship with weekly calorie intake (figure 5). This indicates that food intake is lowest at intermediate temperatures, while both relatively low as well as high temperatures lead to a higher calorie intake. This is in line with findings from the medical literature stating that energy requirements are lowest at intermediate temperatures while relatively cold and hot temperatures lead to a higher energy requirement (Brobeck, Reference Brobeck1948; Davis, Reference Davis1964; National Research Council (US) Committee on Diet and Health, 1989; Westerter, Reference Westerter2017).
Non-linear relationship between mean weekly temperature and weekly calorie intake (dark navy line) for the low-skilled sector with 95 per cent confidence interval (light blue spikes). First-stage of the instrumental variable regression instrumented by six-month SPI and WSDI. Specification controls for gender, number of years of education, marital status, total household income, total weekly precipitation, and a year-week interaction-term. $\alpha _{i}$ and $\gamma _{t}$
 are household and wave fixed-effects, respectively.

It is worth noting that the estimation is based on the individual level but includes household characteristics of individuals in each household. For instance, the variable Married takes the value of one if the household head is married. The fact that this variable has a positive impact on labor supply can be interpreted as follows. In developing countries, married individuals as compared to single ones have more incentive to work longer hours to support their children and relatives. As argued by Baah-Boatenga et al. (Reference Baah-Boatenga, Nketiah-Amponsah and Frempong2013) for Ghana, the willingness of married individuals, especially women, to participate in the labor force is due to the need for household food and health security.
Comparing the results with the OLS estimation reported in the third column of table 2, significant differences are noted, as expected. While most of the control variables show similar coefficients, the effect of calorie consumption becomes insignificant. The same holds for the climatic variables, which no longer show any significant impact on labor supply. These results indicate that endogeneity of food supply is indeed substantial and appropriately controlling for it provides consistent estimates of the true effect of climatic variables and food consumption on labor supply.
Moreover, both the direct and indirect effects can be imputed by comparing the estimations; there is evidence of a ∩-shaped impact of ambient temperature on labor supply with an optimal intermediate temperature of around 21°C, while at the same time ambient temperature of the intermediate range implies lowest calorie needs whereas more extreme temperatures require higher calorie intake to maintain a constant body temperature. Secondly, food intake is also affected by the climate through long-term measures of climate in the past season significantly affecting crop yields. These exogenous factors on current labor supply allow us to identify the effect of food consumption on labor supply, which has a strong and significant impact. In a simple OLS regression, this effect along with the impact of contemporary weather disappears, implying that using this particular method would lead to highly biased results of the underlying indirect effects.
6. Simulation results
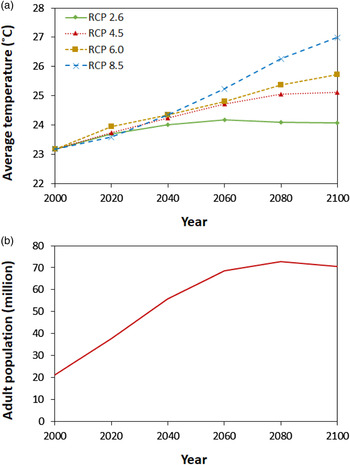
In this section, we present the results of the OLG model. The findings are based on the calibration of the economic model to replicate the population and human capital accumulation projections under the SSP2 scenario. The SSP2 scenario assumes a moderate economic growth with medium changes in socioeconomic variables. Figure 6 demonstrates some socioeconomic dimensions of this scenario. Furthermore, four RCP projections of temperature have been taken into consideration, each representing a distinct global climate policy. The lowest RCP scenario (RCP2.6) represents a stringent policy that significantly limits the level of carbon concentration and future temperature rises. The average temperature starts from 23.2°C in year 2000 and reaches about 24°C under RCP2.6 and 26°C under RCP8.5 (see panel (a) in figure 6). Under the SSP2 scenario, the adult population in Uganda peaks at about 72.8 million around 2080 and then stabilizes at that level for the rest of the century (see panel (b) in figure 6).
The climate and socioeconomic projections for Uganda under the SSP2 scenario with four RCP projections. (a) Average temperature, and (b) Adult population from the Wittgenstein Centre projections (Lutz et al., Reference Lutz, Butz and Samir2014).

In order to capture the full impact of temperature rise on different economic aspects of household in Uganda, four scenarios are developed. Scenario 1 only examines the impacts of temperature rise on economic output (equations (11) and (12)). On the other hand, scenario 2 is only concerned with the impacts of temperature on labor supply (equation (15)) while scenario 3 investigates the effect of temperature rise on food consumption (equation (8)). Finally in scenario 4, all the impacts of temperature rise are combined on different socioeconomic indicators. Each scenario is then compared with the baseline scenario where temperatures are assumed to be constant for the future.
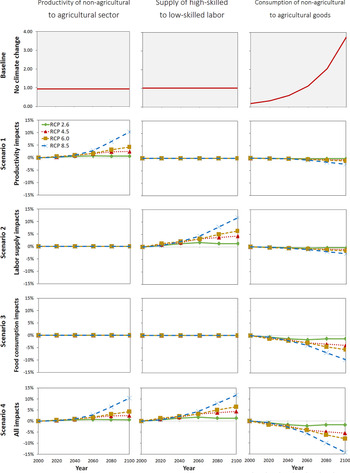
Figure 7 demonstrates the change from the baseline case under different scenarios. The results of each scenario are presented in a corresponding row. The top row demonstrates the values in the baseline case without climate change. In this case, the productivity of non-agricultural sector is about 0.94 of the productivity of the agricultural sector, and both high-skilled and low-skilled labor have similar availability. The ratio of non-agricultural goods to agricultural goods (i.e., food) increase from 0.2 in the year 2000 to 3.7 by the end of the century.
Four climate change impact scenarios. The left column indicates the change in relative productivity of the non-agricultural sector to the agricultural sector. The middle column shows the change in relative supply of high-skilled to low-skilled labor. The right column demonstrates the ratio of non-agricultural to agricultural consumption. All graphs represent percentage change relative to the baseline scenario without climate change.

The second row in figure 7 shows the results for scenario 1 where temperature increases raise the relative productivity of non-agriculture to agriculture under all RCPs. For example, under RCP4.5, the relative productivity of non-agriculture to agriculture increases by 2.5 per cent by the end of the century. By definition, in this scenario we only consider the sectoral impact of climate change and will assume that the ratio of labor supply remains unchanged. Therefore, a decline in productivity of the agricultural to the non-agricultural sector increases food prices and reduces non-agricultural to agricultural good consumption by about 0.6 per cent under RCP4.5 in the year 2100.
The third row in figure 7 shows the results for scenario 2 where future increase in mean temperature in Uganda increases the relative supply of high-skilled to low-skilled labor under all RCPs. For example, under RCP6.0, the relative supply of high-skilled to low-skilled labor increases by 6.5 per cent by the end of the century. In this case, the ratio of non-agricultural to agricultural productivity remains unchanged. Similar to the previous case, a reduction in agricultural output induces higher food prices and reduces non-agricultural to agricultural good consumption by about 1.6 per cent under RCP6.0 in the year 2100.
The fourth row in figure 7 shows the results for scenario 3 where future increase in mean temperature in Uganda increases food consumption under all RCPs. For example, under RCP8.5, food consumption increases by 10 per cent by the end of the century, due to the increased energy demand to maintain thermoregulation at higher temperatures.
The bottom row in figure 7 shows the results for scenario 4 where future increase in mean temperature in Uganda increases relative productivity of non-agriculture to agriculture, relative supply of high-skilled to low-skilled labor, and food consumption under all RCPs. The results of this case are the combination of the results of the previous three cases.
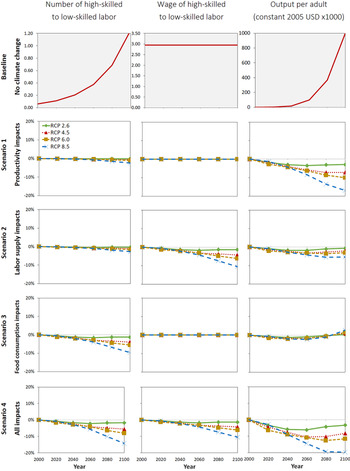
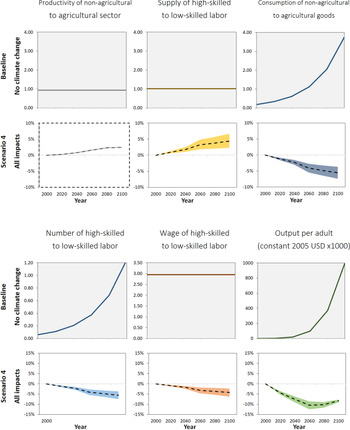
Given this set of scenarios and their impact on economic indicators in figure 7, it is now possible to examine a broader impact of climate change on key socioeconomic indicators under each scenario as presented in figure 8. The results of each scenario are presented in a corresponding row. The top row demonstrates the values in the baseline case without climate change. In this case the ratio of high-skilled to low-skilled labor grows and reaches 1.2 while the wage ratio stays at the initial value of about 3, and the output per adult grows slowly until mid-century and then grows rapidly to reach its maximum by 2100.
The impacts of climate change on socioeconomic indicators under each scenario. The left column indicates the change in ratio of high-skilled to low-skilled labor. The middle column shows the change in relative wages of high-skilled to low-skilled labor. The right column demonstrates the overall change in output per adult. All graphs represent percentage change relative to the baseline scenario without climate change.

The second row in figure 8 shows the results for scenario 1 where temperature rise induces a larger economic impact on the productivity of the agricultural sector. This creates a modest demand for low-skilled labor and lowers the relative skill ratio. For example, under RCP4.5, the ratio of high-skilled to low-skilled labor decreases by 0.6 per cent by the end of the century. The relative supply of high-skilled to low-skilled labor is fixed in this scenario. This keeps the wage ratio of high-skilled to low-skilled labor unchanged in this scenario as explained in equation (7). However, the overall impact of climate change on output per adult is relatively high in this scenario. Under RCP4.5, output per adult decreases by 7.2 per cent by the end of the century.
The third row in figure 8 shows the results for scenario 2 where temperature rise induces a larger impact on the supply of low-skilled labor. Similar to scenario 1, this creates a modest demand for low-skilled labor and lowers the relative skill ratio. For example, under RCP4.5, the ratio of high-skilled to low-skilled labor decreases by 1.1 per cent by the end of the century. The change in relative supply of high-skilled to low-skilled labor also affects the wage ratio of high-skilled to low-skilled labor in this scenario. Under RCP4.5 the wage ratio drops by 4.2 per cent by the end of the century. As a result, the overall impact of climate change on output per adult is relatively low in this scenario. Under RCP4.5, output per adult decreases by 2.1 per cent by the end of the century.
The fourth row in figure 8 shows the results for scenario 3 where temperature rise induces an increase in food consumption. In this model, an increase in food consumption induces an increase in demand for low-skilled labor in the agricultural sector. For example, under RCP4.5, the ratio of high-skilled to low-skilled labor decreases by 4.1 per cent by the end of the century. However, because the relative supply of high-skilled to low-skilled labor remains unchanged in this scenario, the relative wage ratio of high-skilled to low-skilled labor does not change. As a result, the overall impact of climate change on output per adult is rather negligible in this scenario. Under RCP4.5, after a slight decline, the output per adult increases by 1 per cent by the end of the century.
Finally, in the bottom row in figure 8, the results of scenario 4 are shown where temperature rise induces an increase in relative productivity of non-agriculture to agriculture, an increase in relative supply of high-skilled to low-skilled labor, and an increase in food consumption under all RCPs, similar to previous scenarios. The net effect as shown here is a drop in the ratio of high-skilled to low-skilled labor. For example, under RCP4.5, the ratio of high-skilled to low-skilled labor decreases by 5.7 per cent by the end of the century. An increase in relative supply of high-skilled to low-skilled labor also reduces the wage ratio of high-skilled to low-skilled labor by 4.2 per cent under RCP4.5 projections. Such a drop in relative wages has an overall negative impact on the welfare, reducing output per adult by 8.2 per cent in RCP4.5 by the end of the century.
The empirical evidence showing the relationship between temperature rise and labor supply and food consumption is subject to uncertainties. Based on the joint distribution of the empirical estimates, figure 9 shows the results under RCP4.5 with its 95 per cent confidence intervals. This uncertainty regarding the impact on labor supply and food consumption shows that the differences across scenarios are significantly different from zero in the model simulations also.
The 95 per cent confidence intervals based on the regression coefficients (shaded area) for the RCP4.5 scenario (dotted line).

7. Conclusion
In this paper, the impact of climate change on labor supply through variation in food consumption is investigated in the Ugandan framework. Empirical results show that weekly labor supply is maximized at a mean temperature of 21.3°C; however, beyond this threshold, any increase in temperature leads to a decline in the number of hours worked. Results also suggest that a 10 per cent increase in calorie consumption leads to an increase in labor supply of about 0.86 h per week; however, calorie intake is relatively higher in the extreme ranges of temperature. In particular it is possible to distinguish a ∩-shaped effect of mean temperature on labor supply, while calorie intake shows a ∪-shaped form.
Using an OLG model, the long-term impacts of future climate change are projected on food consumption, human capital development and social welfare. Our results show that by the end of the century, and under an unmitigated climate change (RCP8.5) scenario, relative productivity of the agricultural sector to the non-agricultural sector decreases by approximately 10 per cent, the supply of low-skilled to high-skilled labor drops by 12 per cent, and the relative consumption of food to non-agricultural goods increases by approximately 15 per cent. The long-term implications of such changes in labor markets will be a strong incentive for parents to have low-skilled children who can compensate for the loss in the agricultural sector and earn higher wages due to the increase in demand for agricultural products. Therefore, by 2100 the relative population of low-skilled labor compared to high-skilled labor increases by 15 per cent and the wage ratio of these two groups of labor drops by 11 per cent. However, an increase in number of low-skilled laborers coupled with climate change impacts on sectoral productivity and labor supply leads to a significant drop in total economic output and reduces output per adult by 20 per cent in the last part of the century.
The analysis sheds light on an important but understudied linkage between climate change and labor productivity through food consumption. This is particularly important when considering the broader impact of climate change on growing staple crops in developing countries, which will impact food availability, food access and overall food security in these countries (FAO, IFAD, UNICEF, WFP and WHO, 2018). Food insecurity not only reduces the supply of productive workforce members but also increases the risk of stunting in children with long-term consequences into adulthood (Phalkey et al., Reference Phalkey, Aranda-Jan, Marx, Höfle and Sauerborn2015). Rural households will require a variety of adaptation strategies to mitigate the negative impacts and to maintain their livelihoods. Policy makers should encourage the use of specific adaptation strategies such as changing the timing of planting, use of heat and drought resistant varieties, practicing conservation techniques, fertilizer use, irrigation, and crop and income diversification strategies (Ibrahim and Alex, Reference Ibrahim, Alex, Lee and Schaaf2008; Bezabih and Sarr, Reference Bezabih and Sarr2012; Gao and Mills, Reference Gao and Mills2018). In carrying out the econometrics and following OLG studies, this research intends to pave the way for more thorough analysis of long-term impacts of climate change on public health and the labor market. Although the present analysis does not take into account the impacts of climate change on food quality, it is still reasonable to expect that changes in climatic patterns will have a negative impact on nutrients in Uganda over time, which would be an interesting but more importantly an useful analysis to develop.
Acknowledgments
This work has received funding from the European Research Council under the European Community's Programme ‘Ideas’ - Call identifier: ERC-2013-StG / ERC grant agreement no. 336703 - project RISICO ‘Risk and uncertainty in developing and implementing climate change policies’.