Introduction
Undernutrition in infancy and childhood is related to increased risk of morbidity, mortality and poor developmental outcomes in childhoodReference Black, Allen and Bhutta1, Reference Mendez and Adair2 and has long-term consequences for adult health and human capital.Reference Victora, Adair and Fall3 Analyses in low- and middle-income countries demonstrate that stunting in the first 2 years of life relates to shorter adult height, lower attained schooling and decreased offspring birth weight.Reference Victora, Adair and Fall3 As a result of such findings, the promotion of compensatory growth, especially in lower-income settings, has been strongly endorsed.Reference Victora and Barros4
Recently, however, concern has been raised about the potential long-term adverse consequences of accelerated child weight gain, including increased risk of overweight and higher prevalence of chronic disease risk factors.Reference Ong and Loos5, Reference Fisher, Baird and Payne6 Rapid weight gain is particularly relevant in low- and middle-income countries undergoing the nutrition transition and facing the dual burden of under and overweight.Reference Popkin7 Specifically, the risk of cardiovascular and metabolic disease may be highest in children who are undernourished in infancy but subsequently gain weight rapidly,Reference Bhargava, Sachdev and Fall8–Reference Barker, Osmond, Forsen, Kajantie and Eriksson10 suggesting that overall patterns of growth are important.
Typically, early growth is represented as size at one time point (e.g. birth weight) or as a simple increment (e.g. weight gain from 0 to 6 months). Although sophisticated methods have been utilized to model growth curves as outcomes, these methods have not commonly been used to characterize repeated measures of size as exposure variables.
In this paper, we extend the large body of literature on the consequences of infant growth by analyzing data from a Filipino birth cohort undergoing the nutrition transition. The aim was to characterize trajectories of body mass index (BMI) over the first 2 years of life using latent class growth analysis (LCGA) and identify distinct groups of infants with different shaped trajectories. We then examined whether identified trajectories were differentially associated with distinct adult anthropometric measures of body composition. Finally, to assess whether the LCGA approach adds to our understanding of the relation between early BMI gain and adult outcomes, we compared identified trajectories with three conventional analytic approaches: (1) accelerated growth between two time points (0–4 months), (2) continuous BMI gain between two points (0–4 and 0–24 months) and (3) size at one time point (24 months).
Methods
Study population
Data were from the Cebu Longitudinal Health and Nutrition Survey (CLHNS), a community-based cohort study of infants born in 1983–1984 in Metro Cebu, the second-largest metropolitan area in the Philippines. In 1983–1984, the Metro Cebu area comprised 243 administrative units; 33 (17 rural and 16 urban) were randomly selected. All pregnant women residing in these communities who gave birth during a 1-year period from 1983 to 1984 were invited to participate (n = 3327). The resulting child sample (n = 3080 singleton live births) is representative of singleton births in Metropolitan Cebu. Data were collected during the last trimester of pregnancy, immediately following birth, and bimonthly for 2 years. Full follow-up surveys were conducted in 1991–1992, 1994, 1998, 2002 and 2005. All surveys collected comparable socioeconomic, demographic, environmental, diet and anthropometric data. The present analysis used data from the first 2 years and the 2002 and 2005 follow-up surveys. For women who were pregnant during the 2005 follow-up but not pregnant in the 2002 follow-up (n = 68), we used anthropometric measures collected in 2002. The final analytic sample included 1749 participants (Fig. 1).
Participant retention across follow-up periods for Cebu Longitudinal Health and Nutrition Survey (CLHNS) sample, 1983–2005.

We compared birth characteristics of the analytic sample with those who were excluded (Fig. 1). Birth weight and length did not differ between the two groups. The subjects lost to follow-up were more likely than those retained in the sample to be urban residents and to have more highly educated mothers. There were no differences in household assets or maternal height, age or parity. Weight velocity from 0 to 4 months was greater in those retained in the sample, which may have reflected slower growth among those who subsequently died during infancy.
Infant anthropometric measures
Infant recumbent length was measured using custom-designed length boards and infant weight was measured with dial-faced hanging-type scales. BMI (kg/m2) at each age was used to define infant growth trajectory classes. Measures were also converted into z-scores (weight-, length- and BMI-for-age) using the World Health Organization (WHO) Growth Standards.11 Accelerated BMI gain from 0 to 4 months was defined as >0.67 change in BMI z-score from 0 to 4 months.Reference Monteiro and Victora12 We chose this interval to capture the first months of life, a period hypothesized to be critical for the development of obesity.Reference Gillman13 We also examine the attained BMI at age 2 years because of the importance of the first 2 years as a window of opportunity for growth promotion.Reference Victora, de Onis, Hallal, Blossner and Shrimpton14–Reference Martorell16
Adult anthropometric measures
BMI was calculated from measured weight and height in 2005 (2002 if pregnant in 2005). Waist circumference (WC) was measured at the midpoint between the bottom of the ribs and the top of the iliac crest. Triceps and subscapular skinfold thicknesses represent the mean of three consecutive Harpenden caliper measurements. We calculated percent body fat from skinfold thickness equationsReference Durnin and Womersley17 validated for Asian populations.Reference Deurenberg and Deurenberg-Yap18 Fat mass (FM; kg) was calculated as percentage body fat × weight, and lean mass (LM; kg) was calculated as weight minus FM. FM and LM were adjusted for height according to sample-specific coefficients calculated from allometric models using the approach suggested by Heymsfield et al.Reference Heymsfield, Gallagher, Mayer, Beetsch and Pietrobelli19 [fat mass index (FMI) = FM/height3.3 (males) FM/height2.3 (females); lean mass index (LMI) = LM/ height2.1 (males) LM/ height1.8 (females)]. BMI, FMI, LMI and WC were log-transformed and geometric means [mean (s.e.)] are presented.
Additional variables
Gestational age was estimated from the mother's report of her last menstrual period. In cases where this date was unknown, when pregnancy complications occurred, or when the infant weighed <2.5 kg at birth, gestational age was determined by nurses using the Ballard method.Reference Ballard, Novak and Driver20 Small-for-gestational age (SGA) was defined as birthweight below the 10th centile of individually customized birthweight centiles calculated according to the methodology described by Gardosi.Reference Gardosi21
Information on infant feeding included frequency and predominance of breastfeeding in the past 24 h and general feeding pattern 7 days prior. Time predominantly breastfed was defined as the number of months the infant was fed breast milk and no other nutritive foods or liquids. Morbidity data reflected the maternal report of the number of episodes of diarrhea and severe respiratory symptoms experienced by the infant in the past week.
Maternal height (cm) was selected to represent the child's genetic potential for size both as an infant and as an adult. Parity was reported by mothers at baseline. Socioeconomic status at baseline was represented by a summary asset score derived from information on 10 key assets. Socioeconomic status in young adulthood was represented by total household income. A multicomponent urbanicity scaleReference Dahly and Adair22 was chosen as an indicator of the urban nature of the environment in which the child was raised. A hygiene index represented the overall cleanliness of the environment within and surrounding the house.
All data were collected by project staff during in-home interviews. Quality control measures included extensive training and periodic inter-observer reliability assessments. All procedures were reviewed and approved by the Institutional Review Board at the University of North Carolina at Chapel Hill.
Statistics
We used latent class growth curve analysis (LCGA)Reference Nagin23, Reference Jones, Nagin and Roeder24 implemented in Mplus (version 5.2) to identify BMI trajectories from 0 to 24 months. LCGA identifies distinct groups (latent classes) of infants who share similar trajectories. This approach is different from conventional latent growth curve modeling, which assumes that all individuals are drawn from a single population and that a single population average trajectory adequately approximates the entire population. Although conventional latent growth curve models allow individual differences in development over time captured by random slopes and random intercepts, individuals are assumed to vary around a single mean growth curve. In contrast, the LCGA method relaxes the single population assumption to allow for parameter differences across unobserved subpopulations. LCGA assumes a number of discrete classes, each having a specific functional form. We used BMI measured at birth and bimonthly until 24 months (13 time points) to define a latent class model in which the latent classes correspond to different growth curve shapes.
We estimated a series of models with progressively greater numbers of trajectory classes specifying 1000 initial stage starts, 100 final stage starts and 10 initial stage iterations for each model estimated.
Using bimonthly indicator variables, we estimated a freed-loading modelReference Bollen and Curran25 that estimates the functional form of the BMI trajectory without any a priori assumptions about its shape. We allowed for differences in the unconditional means of the growth parameters across trajectory classes but did not allow the growth factor variances or covariances to differ across classes. Our specification allowed the functional form of BMI trajectories between groups to be different.
LCGA modeling produces several possible solutions varying in both growth parameters and number of classes. We evaluated model fit using a combination of: (i) sample size-adjusted Bayesian Information Criterion (BIC; lowest adjusted BIC is preferred solution),Reference Schwarz26 (ii) separation of latent classes summarized using an entropy measure based on the posterior class membership probabilities (a higher entropy – closer to 1 – is preferred),Reference Wedel and Kamakura27 (iii) the shape of the trajectories to assess face validity of the solution (e.g. is it consistent with theory and observed individual growth trajectories) and to identify differences in functional form (e.g. nonparallel trajectories) and (iv) interpretability of trajectory groups. Model selection in LCGA models is an active research area, and no single criterion has been shown to be superior in general settings.
Given gender differences in early growth, all models were sex stratified. Individuals were assigned to the BMI trajectory class for which they had the highest probability of membership. We used Stata version 11.0 (StataCorp LP, College Station, TX, USA) to calculate descriptive statistics by trajectory class and to examine associations between class membership and covariates previously shown to affect growth. A likelihood ratio χ 2 test for each variable tested differences among trajectory classes. Multivariate linear and logistic regression was used to examine associations between BMI trajectory class with adult anthropometric outcomes, controlling for age and household income.
To compare BMI trajectories with conventional approaches, we present the F-value and adjusted R 2 values from adjusted linear regression models separately examining associations between (1) BMI trajectory class, (2) accelerated BMI gain from 0 to 4 months, (3) continuous BMI gain between two points (0–4 months), (4) continuous BMI gain between two points (0–24 months) and (5) BMI at age 2 years with adult measures. The F-test value assesses the overall statistical significance of the adjusted regression model. The adjusted R 2 describes the proportion of the total variance that is explained by the exposure measure and is adjusted for the number of parameters in the model, allowing comparisons between models with different degrees of freedom.
Finally, to assess whether trajectory class is important independent of attained BMI in late infancy, we controlled for BMI at age 2 years in multivariate linear regression models examining associations of trajectory class with adult outcomes.
Results
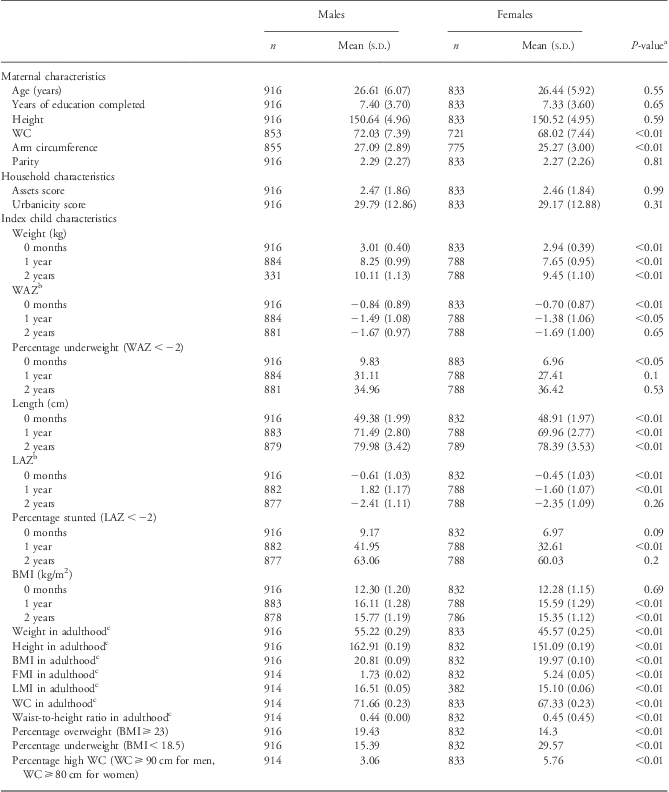
The prevalence of stunting (length-for-age z-score <−2) at birth was 9% for males and 7% for females and substantially increased with age, such that by age 2 years, 63% of males and 60% of females were stunted (Table 1). The sample was lean in young adulthood (Table 1). Using cutpoints proposed for Asians by the WHO,28 17% were overweight (BMI ⩾ 23) and 4% had high abdominal adiposity (WC ⩾ 90 cm for men, WC ⩾ 80 cm for women). Underweight (BMI < 18.5) prevalence (22%) was higher than overweight and high abdominal adiposity. The top panels of Figs 2 and 3 present the single population BMI curves from 0 to 24 months with the median values from the WHO BMI standards for reference. In males and females, the CLHNS mean BMI curves fall below the WHO curves at all points except 24 months, when the curves converge.
Selected characteristics of participants with infant and young adult measures (Cebu, Philippines, 1983–2005)
WC, waist circumference; WAZ, weight-for-age z-scores; LAZ, length-for-age z-scores; BMI, body mass index; FMI, fat mass index; LMI, lean mass index; WHO, World Health Organization.
aP-value for comparison between sexes.
bCalculated from WHO growth standards.
cGeometric mean (s.e.).
Body mass index (BMI) trajectory classes from 0 to 24 months of life from males (Cebu, Philippines, 1983–1985). (a) Median BMI values from 0 to 24 months among Cebu Longitudinal Health and Nutrition Survey (CLHNS) sample males who were present in the young adult follow-up survey as compared with the World Health Organization (WHO) child growth standards. (b) 7-class freed-loading longitudinal latent class analysis model for repeated, continuous BMI measures at 13 time points (bimonthly 0–24 months) in the CLHNS (n = 916).
Body Mass Index (BMI) trajectory classes from 0 to 24 months of life from females (Cebu, Philippines, 1983–1985). (a) Median BMI values from 0 to 24 months among Cebu Longitudinal Health and Nutrition Survey (CLHNS) sample females who were present in the young adult follow-up survey as compared with the World Health Organization (WHO) child growth standards. (b) 7-class freed-loading longitudinal latent class analysis model for repeated, continuous BMI measures at 13 time points (bimonthly 0–24 months) in the CLHNS (n = 833).
Supplementary Table S1 presents the LCGA model fit statistics. Differences in the functional forms of trajectories became apparent starting with the 5-class model (solutions with a lower number of classes identified parallel trajectories). We favored the 7-class solution in males and females based on the BIC, entropy values and considerations regarding the interpretability of solutions with a higher number of groups.
The bottom panels of Figs 2 and 3 present the nominal 7-class solutions, including the median values from the WHO BMI standards. The single population curves in Figs 2a and 3a, do not capture the differences in the trajectory shapes in Figs 2b and 3b. Although some comparable trajectory curves are present in both males and females, unique trajectory shapes are noticeable in each sex.
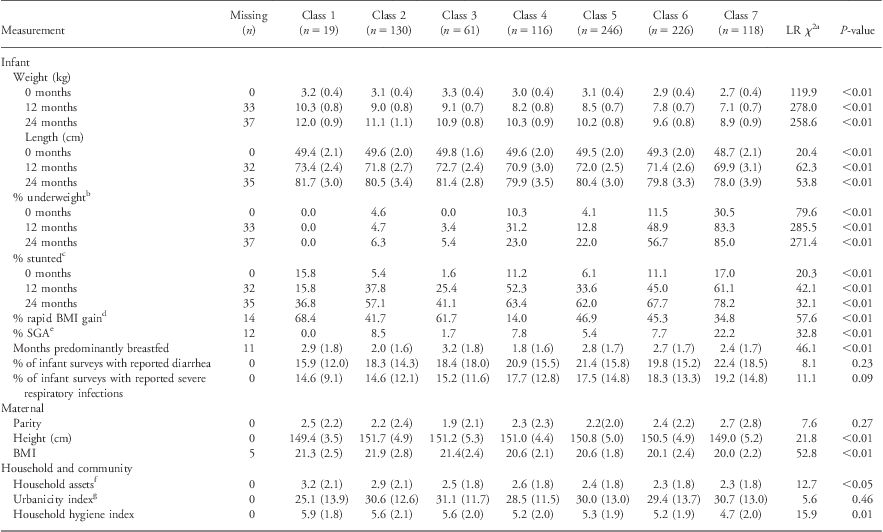
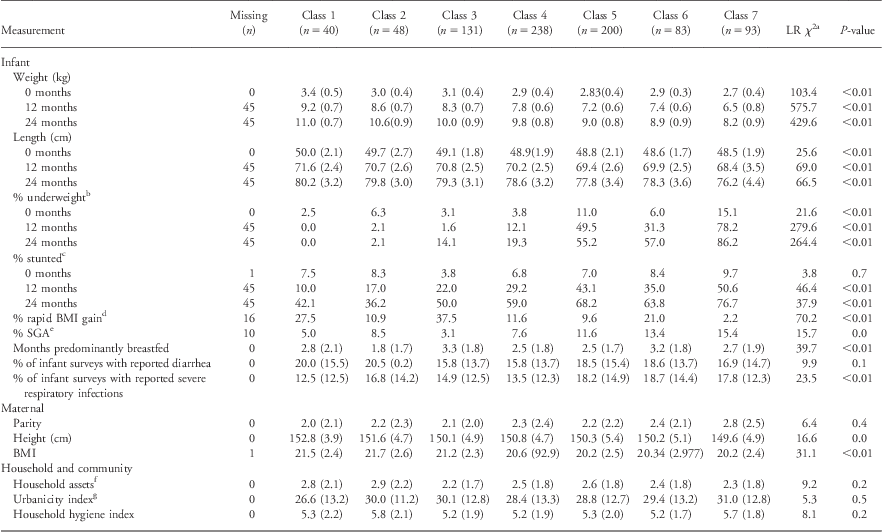
To assess whether the trajectory shapes correspond with factors known to influence infant growth, we examined characteristics of trajectory classes (Tables 2 and 3). For example, we expect a higher linear growth potential for infants with taller mothers, greater weight gain among infants who are breastfed longer and growth faltering among infants with more diarrhea and severe respiratory infections. Among both males and females, the groups differed as expected in maternal height and BMI, SGA status and severe respiratory infections. The trajectory classes with the greatest duration of predominant breastfeeding (male trajectory classes 1 and 3, female trajectory classes 1, 3 and 6) also showed the greatest BMI gain in the first 4 months. To further illustrate, female trajectory class 1 has the highest BMI at all time points. Their mothers were the tallest with the highest BMIs and lowest parity in the sample. This class was relatively wealthy, and the infants had the lowest reported severe respiratory infections. In contrast, female trajectory class 7 had the lowest BMI at all time points. Their mothers were the shortest with the lowest BMIs and highest parity. This class was predominantly urban, and the infants had the highest levels of wasting and stunting throughout infancy.
Selected characteristics in seven BMI trajectory classes from 0 to 24 months of life from males (Cebu, Philippines, 1983–2005)
BMI, body mass index; LR, likelihood ratio; SGA, small-for-gestational age.
aComparisons in means and prevalences between classes were made using likelihood ratio χ 2 tests for equality of means and proportions across classes.
bWeight-for-age z-score <−2.
cLength-for-age z-score <−2.
dChange in BMI z-score >0.67 from 0 to 4 months.
eSGA: birthweight <10th centile of individually customized birthweight centiles (Gardosi methods employed).
fSummary of 10 key assets.
gMulticomponent urbanicity index.
Selected characteristics in seven BMI trajectory classes from 0 to 24 months of life from females (Cebu, Philippines, 1983–2005)
BMI, body mass index; LR, likelihood ratio; SGA, small-for-gestational age.
aComparisons in means and prevalences between classes were made using likelihood ratio χ 2 tests for equality of means and proportions across classes.
bWeight-for-age z-score <−2.
cLength-for-age z-score <−2.
dChange in BMI z-score >0.67 from 0 to 4 months.
eSGA: birthweight <10th centile of individually customized birthweight centiles (Gardosi methods employed).
fSummary of 10 key assets.
gMulticomponent urbanicity index.
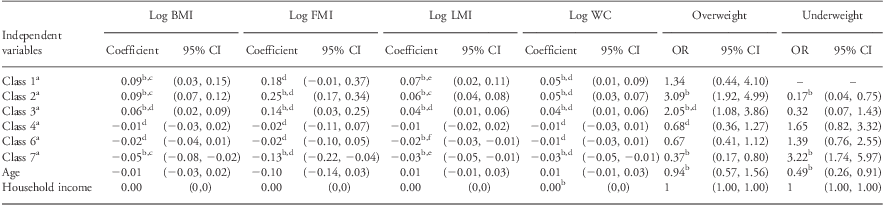
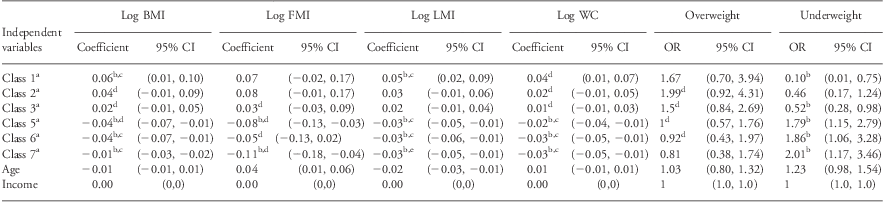
Tables 4 and 5 present associations between trajectory classes and adult outcomes adjusted for adult age and household income. The referent group is the largest class and that which most closely approximates the WHO median. Trajectory classes in Tables 4 and 5 are presented in rank order according to BMI at age 2 years (largest to smallest). A greater number of trajectory classes were predictive of adult outcomes in males than in females. In both sexes, BMI trajectories predicted adult BMI, FMI, LMI and WC and rank order was generally maintained from age 2 years to ∼22 years. BMI trajectory classes were associated with overweight in males only and with underweight in both sexes.
Multivariable linear and logistic regression models of associations between male infant BMI trajectories and anthropometric measures of adult body composition (Cebu, Philippines, 1983–2005)
BMI, body mass index; FMI, fat mass index; LMI, lean mass index; WC, waist circumference.
All models adjusted for adult age and adult household income.
aReference group is Group 6.
bP < 0.05.
cAfter adjustment for BMI at 2 years, coefficient was attenuated but remained significant.
dAfter adjustment for BMI at 2 years, results unchanged.
eAfter adjustment for BMI at 2 years, coefficient was attenuated and P-value was 0.05–0.15.
fAfter adjustment for BMI at 2 years, coefficient was attenuated and P-value >0.20.
Multivariable linear and logistic regression models of associations between female infant BMI trajectories and anthropometric measures of adult body composition (Cebu, Philippines, 1983–2005)
BMI, body mass index; FMI, fat mass index; LMI, lean mass index; WC, waist circumference.
All models adjusted for adult age and adult household income.
aReference group is Group 4.
bP < 0.05.
cAfter adjustment for BMI at 2 years, coefficient was attenuated but remained significant.
dAfter adjustment for BMI at 2 years, results unchanged.
eAfter adjustment for BMI at 2 years, coefficient was attenuated and P-value was 0.05–0.15.
fAfter adjustment for BMI at 2 years, coefficient was attenuated and P-value >0.20.
To account for the error associated with trajectory class assignment, we also considered models in which the posterior probability of assignment to the class with the highest posterior probability was treated as a covariate and results were unchanged.
Supplementary Tables S2 and S3 present summary statistics from adjusted regression models separately examining associations between (1) BMI trajectory class, (2) accelerated BMI gain from 0 to 4 months, (3) continuous BMI gain from 0 to 4 months, (4) continuous BMI gain from 0 to 24 months and (5) BMI at age 2 years with adult outcomes. Early accelerated BMI gain did not predict any of the adult measures, while BMI trajectory classes, BMI gain from 0 to 24 months and BMI at age 2 years did predict adult measures. Among males, the proportion of the total variance that was explained by the trajectory classes (adjusted R 2 value) was substantially higher than for other measures of infant growth or size. Among females the differences were less extensive. Among both males and females, after trajectory classes, models containing BMI at 2 years of age provided the greatest explanation of variation in adult anthropometry.
A key question is whether trajectories add to the literature that uses BMI at age 2 years to predict adult outcomes. After controlling for BMI at age 2 years, trajectory classes were still statistically significant and provided additional explanation of variation in adult anthropometry (Tables 4 and 5). In addition, a null association was found between BMI at age 2 years and adult FMI and WC in both males and females and between BMI at age 2 years and adult BMI in males only.
Discussion
This study explores the development of body composition in a young, lean Filipino population undergoing the kinds of rapid changes in diet and physical activity that have been labeled ‘the nutrition transition’ using a data-driven LCGA to explore distinct patterns of BMI change across infancy. Substantial differences among trajectory shapes suggest that a single population curve may not represent all individuals adequately. After controlling for BMI at 2 years of age, trajectory classes were still associated with anthropometric measures of body composition in adulthood, suggesting that overall patterns of BMI change in infancy have long-term implications for the development of body composition.
The LCGA approach is a marked departure from conventional methods of examining growth that assume a single population curve. A number of familial and environmental factors known to influence BMI gain were associated with trajectory class membership, suggesting that the shapes of trajectories reflect the biological and environmental characteristics of the individuals assigned to them.
Conventional approaches to examining the relationship between early growth and adult size focus on specific time points or intervals hypothesized to be sensitive or critical periods for the development of obesity. A key strength of the LCGA approach is that it permits simultaneous examination of tempo, timing and magnitude of size without incorporation of a priori hypotheses regarding critical or sensitive periods.
Research demonstrating that accelerated weight gain in early infancy increases the risk of overweight later in lifeReference Ong and Loos5 has led to hypotheses that the first months of the life are critical for the development of overweight.Reference Gillman13 In this large cohort, accelerated BMI gain from 0 to 4 months was not predictive of adult outcomes but BMI trajectories from 0 to 24 months were, suggesting that accelerated early infant BMI gain does not have long-term consequences. Our sample includes a substantial number of babies who were born small, but were subsequently exclusively breastfed and had accelerated early weight gain, likely representing compensation from intrauterine growth restriction.
A recent review demonstrated that in South Asian countries weight-, length- and weight-for-length z-scores faltered until age 2 years and remained reasonably stable thereafter,Reference Victora, de Onis, Hallal, Blossner and Shrimpton14 highlighting the long-term implications of attained size by age 2 years. Consistent with this review, in our sample, BMI at age 2 years predicted all adult anthropometric measures of body composition and rank order of groups by BMI at age 2 years remained generally stable. To test whether the pattern of BMI gain leading to attained BMI at 2 years of age was important, we examined how infant BMI trajectories related to adult body composition measures, controlling for BMI at age 2 years. Independent of BMI at age 2 years, trajectory classes still explained variation in adult measures. Although BMI at age 2 years was predictive of all adult outcomes in models presented in Supplementary Tables S2 and S3, in both sexes we found a null association between BMI at age 2 years and adult FMI and WC in trajectory class models. Among males, trajectory class coefficients were unchanged and among females trajectory coefficients were slightly attenuated in FMI models only. In males, we also found a null association between BMI at age 2 years and adult BMI in trajectory class models with only slight attenuation of trajectory class coefficients. Taken together, these results suggest that, despite the stable rank order by BMI at age 2 years and adult anthropometric measures, for BMI, FMI and WC the trajectory groups provide important additional information not provided by a single BMI measure.
In contrast, we found a significant association between BMI at age 2 years and adult LMI in trajectory class models and also the most attenuation of trajectory class coefficients. These results suggest that the infant BMI trajectories do not explain LM development, rather relative weight gain.
The gender differences that we document are not surprising given that sex hormones may have important influences on early life growth and the development of body composition.Reference Lampl, Thompson and Frongillo29 The present findings extend evidence for gender differences in long-term health effects in the CLHNS sample to the outcome of anthropometry in early adulthood.
Our findings of consistent associations between overall patterns of growth from 0 to 24 months and adult BMI, FMI and WC independent of attained BMI at age 2 years suggest that intervention strategies to address malnutrition in transitional countries should focus on overall growth patterns throughout the first 2 years of life.Reference Popkin, Adair and Ng30
In young adulthood, most of our sample is lean with higher rates of underweight than overweight. At 22 years of age, the sample may be just beginning the body composition transition experienced by their mothers in their late 20s to 30s.Reference Adair31, Reference Adair, Gultiano and Suchindran32 To better understand the role of infant BMI patterns in the development of overweight, similar analyses could be conducted in a population with a higher prevalence of overweight.
Infancy is a period of rapid changes in both length and weight. We chose to model BMI as we were interested in excess weight relative to length. However, because the nature of rapid weight gain in infancy may vary between individuals in terms of fat and fat-free mass and the relative rates of growth in weight and length may vary significantly, BMI has been shown to be less associated with fatness during infancy than other ages.Reference Wells33 Despite this limitation, BMI is still recommended to compare relative weight between and within populations over time.Reference Wells33, 34
Other statistical techniques are available for characterizing trajectories. One approach is to use standard growth analyses to estimate a single trajectory that averages all of the individual trajectories in a given sample and provides an averaged intercept and slope terms. Differences in the shapes of individual trajectories can be captured by estimating random intercepts, slopes and quadratic terms, providing three unique covariates for every individual in the sample.Reference Andruff, Carraro, Thompson, Gaudreau and Louvet35 While providing a great deal of information about individual variation, these results are difficult to interpret (e.g. how do you interpret random intercepts conditional on random slopes) and to draw inferences. In contrast, one strength of the LCGA approach is its simple interpretation. Classifying subjects into a limited number of groups that share a developmental pattern enables public health recommendations and facilitates the targeting of interventions.
Another strength of LCGA is that the forms of the infant BMI trajectories emerged from the data. Identified trajectory shapes may therefore be especially valuable in the generation of new hypotheses regarding determinants and consequences of early growth. Future research could examine the influence of time-varying modifiable factors on trajectory class membership to identify targets for intervention.
It is important to note one limitation of the LCGA approach characteristic of all growth models, the number of assessments needed. In order to estimate models containing complex trajectories (e.g. those following cubic or quadratic forms), four or five time points are preferred.Reference Curran and Muthen36
This research is a novel application of LCGA to identify the heterogeneity of infant growth trajectories. Although this method is used extensively in the developmental psychology literature, it has not yet been taken advantage of by public health researchers. Latent class analysis could be utilized by public health researchers to identify trajectories of health behaviors that vary greatly across population subgroups both in terms of the level of behavior at the outset of the measurement period and in the rate of growth and decline over time. Such a method is far more useful in understanding health behavior than the commonly utilized modeling strategy designed to identify averages and explain variability about those averages.
Evidence that early life experiences play an important role in the long-term health of individuals holds promise for the identification of public health strategies to modify prenatal and perinatal determinants of adverse adult health outcomes. The current study is a novel approach to identifying differences in patterns of early life growth as they affect adult body composition and health. After controlling for BMI at 2 years of age, infant BMI trajectory classes were associated with anthropometric measures in adulthood, suggesting that overall patterns of BMI change in infancy have long-term implications for the development of body composition.
Acknowledgments
This work was supported by the National Institutes of Health Interdisciplinary Training in Maternal and Child Obesity Grant: 1T32HD057824. The authors are grateful to the CLHNS field study team and to all participants.
Supplementary materials
For supplementary materials referred to in this article, please visit http://dx.doi.org/doi:10.1017/S2040174412000554