1. Introduction
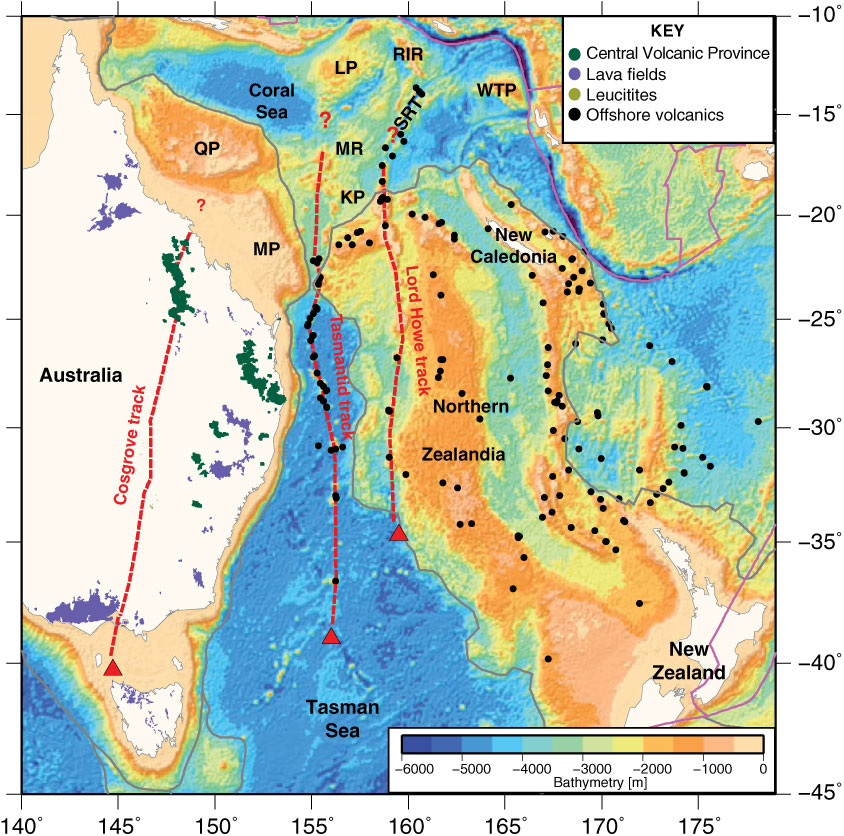
The seas off eastern Australia host two parallel, age-progressive seamount chains: the ∼2500 km long Tasmantid and ∼2000 km long Lord Howe seamount chains (McDougall & Duncan, Reference McDougall and Duncan1988). These chains are coeval with the world’s longest chain of continental hotspot volcanoes – the central volcanoes of eastern Australia (Wellman & McDougall, Reference Wellman and McDougall1974) – which was called the Cosgrove Track by Davies et al. (Reference Davies, Rawlinson, Iaffaldano and Campbell2015). Collectively, these volcanic rocks form part of one of the world’s largest intraplate volcanic provinces, spanning eastern Australia, Zealandia and East Antarctica (Johnson et al. Reference Johnson, Knutson and Taylor1989; Finn et al. Reference Finn, Müller and Panter2005; Mortimer et al. Reference Mortimer, Gans, Meffre, Martin, Seton, Williams, Turnbull, Quilty, Micklethwaite, Timm, Sutherland, Bache, Collot, Maurizot, Rouillard, Sensarma and Storey2018) (Fig. 1). The volcanic rocks range in age from Late Cretaceous to Holocene and include a variety of syn- and post-Gondwana break-up volcanic rocks (Tulloch et al. Reference Tulloch, Ramezani, Mortimer, Mortensen, van den Bogaard, Maas, Ring and Wernicke2009; Timm et al. Reference Timm, Hoernle, Werner, Hauff, van den Bogaard, White, Mortimer and Garbe-Schönberg2010; Sutherland et al. Reference Sutherland, Graham, Meffre, Zwingmann and Pogson2012), the aforementioned age-progressive chains and randomly distributed volcanism with no known age or spatial correlation (Wellman & McDougall, Reference Wellman and McDougall1974; Finn et al. Reference Finn, Müller and Panter2005; Mortimer et al. Reference Mortimer, Gans, Meffre, Martin, Seton, Williams, Turnbull, Quilty, Micklethwaite, Timm, Sutherland, Bache, Collot, Maurizot, Rouillard, Sensarma and Storey2018) (Fig. 1). While most studies agree that the age-progressive chains formed by the northward motion of the Australian plate over a stationary or slowly moving mantle source or sources (Wellman & McDougall, Reference Wellman and McDougall1974; McDougall & Duncan, Reference McDougall and Duncan1988; Johnson et al. Reference Johnson, Knutson and Taylor1989; Cohen et al. Reference Cohen, Vasconcelos and Knesel2007; Knesel et al. Reference Knesel, Cohen, Vasconcelos and Thiede2008; Davies et al. Reference Davies, Rawlinson, Iaffaldano and Campbell2015; Jones & Verdel, Reference Jones and Verdel2015; Kalnins et al. Reference Kalnins, Cohen, Fitton, Mark, Richards and Barfod2015), debate continues regarding the type of plume(s) that are active in the area, the plate–mantle interactions, the ultimate source of and connections between the varying styles of magmatism, and how the close spatial separation between tracks compares with other known parallel hotspot tracks.
Regional bathymetry of northern Zealandia and the Australian margin showing known offshore volcanic rock samples of presumed or demonstrable intraplate affinity and those from the South Rennell Trough (black dots), the intraplate volcanic rocks along eastern Australia (taken from Davies et al. Reference Davies, Rawlinson, Iaffaldano and Campbell2015) and indicative age-progressive tracks from the Cosgrove (according to Davies et al. Reference Davies, Rawlinson, Iaffaldano and Campbell2015) and the Tasmantid and Lord Howe tracks (red dashed lines). Red triangles are inferred present-day hotspot locations. Grey lines are the continent–ocean boundaries of Zealandia (Mortimer et al. Reference Mortimer, Campbell, Tulloch, King, Stagpoole, Wood, Rattenbury, Sutherland, Adams, Collot and Seton2017) and Australia (Müller et al. Reference Müller, Seton, Zahirovic, Williams, Matthews, Wright, Shephard, Maloney, Barnett-Moore and Hosseinpour2016). Magenta lines are present-day plate boundaries from Bird (Reference Bird2003). KP – Kenn Plateau; LP – Louisiade Plateau; MP – Marion Plateau; MR – Mellish Rise; QP – Queensland Plateau; RIR – Rennell Island Ridge; SRT – South Rennell Trough; WTP – West Torres Plateau.

This uncertainty can partly be explained by the paucity of geochemical and age constraints from the two offshore tracks (Fig. 2), the absence of an obvious bathymetric swell or plume-like thermal anomaly in seismic tomography images close to the youngest volcanoes (e.g. Fichtner et al. Reference Fichtner, Kennett, Igel and Bunge2010; Montelli et al. Reference Montelli, Nolet, Dahlen, Masters, Engdahl and Hung2004) and a poorly sampled tapestry of plateaus and ridges at the oldest end of the tracks whose relationship to hotspot volcanism remains enigmatic. Recent geochemical and 40Ar–39Ar dating of dredge samples from the Tasmantid seamounts (Kalnins et al. Reference Kalnins, Cohen, Fitton, Mark, Richards and Barfod2015; Crossingham et al. Reference Crossingham, Vasconcelos, Cunningham and Knesel2017) and two samples from the northern Lord Howe seamounts (Mortimer et al. Reference Mortimer, Gans, Meffre, Martin, Seton, Williams, Turnbull, Quilty, Micklethwaite, Timm, Sutherland, Bache, Collot, Maurizot, Rouillard, Sensarma and Storey2018) have redressed one of the major shortcomings, resulting in a more comprehensive dataset that can be used to evaluate the eruptive history of these volcanic edifices.
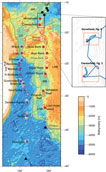
Regional bathymetry of the Tasmantid and Lord Howe seamount chains. Purple filled circles indicate 40Ar–39Ar dated Tasmantid seamounts from Crossingham et al. (Reference Crossingham, Vasconcelos, Cunningham and Knesel2017). Red filled circles indicate dated Lord Howe seamounts (see text for references); black dots are dredge samples from the South Rennell Trough. Unfilled circles are identified seamounts that may be related to the Tasmantid (purple) and Lord Howe (red) trails but are yet to be sampled or dated. Black triangles are the location of the Tasmantid and Lord Howe hotspots based on the Whittaker et al. (Reference Whittaker, Afonso, Masterton, Müller, Wessel, Williams and Seton2015) dataset. Grey lines are the continent–ocean boundaries of Zealandia and Australia. Black box denotes the area shown in the insert. Inset shows bathymetry contours in grey, ECOSATI ship track in blue, dredge sites as red symbols and the frames of Figures 3–4 as orange boxes. CT – Cato Trough; LHB – Lord Howe Basin; LHR – Lord Howe Rise; MB – Middleton Basin; MR – Mellish Rise; SRT – South Rennell Trough.

In this study, we focus on the easternmost extent of this volcanism, the seamounts of the Lord Howe Seamount Chain. Volume calculations of the volcanic edifices along a hotspot trail can provide an important quantitative first-order constraint on the relationship between the mantle and surface plate motions. We therefore estimate both the volume and flux and compare these estimates to those of the Tasmantid and onshore trails to determine if changes in magma production across all the trails can be related to plate motion changes. We also compare these estimates globally to make inferences about the behaviour of the hotspot(s) interacting with East Australia and the Tasman and Coral Sea region. Using available geochemical data and plate motion modelling, we explore the relationship between hotspot volcanism and back-arc spreading in the Coral Sea region. Specifically, we investigate the relationship between the Lord Howe Seamount Chain and the South Rennell Trough, and whether some of the plateau and ridge features in the Coral Sea are likely candidates for the ultimate source of the age-progressive volcanism within eastern Australia and Zealandia. This paper can be considered a companion to Seton et al. (Reference Seton, Mortimer, Williams, Quilty, Gans, Meffre, Micklethwaite, Zahirovic, Moore and Matthews2016) and Mortimer et al. (Reference Mortimer, Gans, Meffre, Martin, Seton, Williams, Turnbull, Quilty, Micklethwaite, Timm, Sutherland, Bache, Collot, Maurizot, Rouillard, Sensarma and Storey2018).
2. Regional setting
The Tasmantid and Lord Howe seamount chains are collinear, broadly N–S-trending age-progressive volcanic trails (McDougall & Duncan, Reference McDougall and Duncan1988) that each span over 2000 km in length (Figs. 1, 2). The Lord Howe Seamount Chain has largely erupted through the continental crust of northern Zealandia.
The northernmost identified extent of the Lord Howe seamount trail was previously limited to the Bellona Plateau at the northern end of the Lord Howe Rise (Figs. 1, 2), tentatively dated as 25 Ma (Exon et al. Reference Exon, Hill, Lafoy, Heine and Bernardel2006 b) or younger than middle Eocene (Missègue & Collot, Reference Missègue and Collot1987). Recent 40Ar–39Ar dating of volcanic samples from RV Southern Surveyor voyage ss2012_v06 extend the age range of the trail to ∼27–28 Ma and to the southern end of the South Rennell Trough, north of the Chesterfield Plateau (Mortimer et al. Reference Mortimer, Gans, Meffre, Martin, Seton, Williams, Turnbull, Quilty, Micklethwaite, Timm, Sutherland, Bache, Collot, Maurizot, Rouillard, Sensarma and Storey2018) (Fig. 2). In this northern area, the seamounts likely erupted through continental crust of the Kenn Plateau, as the basement of the Bellona Plateau is thought to be contiguous with this plateau (Harris et al. Reference Harris, Heap, Passlow, Sbaffi, Fellows, Porter-Smith, Buchanan and Daniell2003). Further south, the seamounts (Nova, Argo, Kelso and Capel banks) erupted through the continental crust of the Lord Howe Rise and Capel Basin, whereas the Gifford Seamount and Middleton and Elizabeth reefs cross the Middleton Basin, which may be underlain by oceanic or highly thinned continental crust (Norvick et al. Reference Norvick, Langford, Hashimoto, Rollet, Higgins, Morse, Blevin, Bradshaw and Uruski2008). The youngest dated seamount along the trail is at Lord Howe Island, with a K–Ar age of ∼7 Ma (McDougall et al. Reference McDougall, Embleton and Stone1981) and is located on the Lord Howe Rise, near the edge of the Lord Howe Basin (Fig. 2). Of the 18 identified seamounts along the Lord Howe Seamount Chain, only seven have been dated, and of those only five have been dated radiometrically. Foraminiferal ages of the limestone capping the Nova, Argo and Gifford seamounts yielded ages of latest Oligocene – earliest Miocene, middle Miocene and early Miocene, respectively (Quilty, Reference Quilty1993), providing minimum eruption age constraints. Although Lord Howe Island represents the youngest dated seamount, the chain may extend as far south to the, as yet unsampled, Flinders Seamount, located at the edge of the Tasman Sea and Lord Howe Rise (Fig. 2). There is also the prospect that older seamounts associated with this seamount chain exist north of the Horsehead Seamount and interacted with an active South Rennell Trough spreading ridge at the time of formation (Seton et al. Reference Seton, Mortimer, Williams, Quilty, Gans, Meffre, Micklethwaite, Zahirovic, Moore and Matthews2016).
The Tasmantid Chain can be traced northwards just south of the Louisiade Plateau into the Coral Sea with an oldest age of > 50 Ma based on recent 40Ar–39Ar dating of dredge samples collected during RV Southern Surveyor voyage ss2012_v07, ss5/2004 and ss02/2005 (Exon et al. Reference Exon, Hill, Lafoy, Burch, Post, Heine, Quilty, Howe and Taylor2005, Reference Exon, Bernardel, Brown, Cortese, Findlay, Hoffmann, Howe and Quilty2006 a; Kalnins et al. Reference Kalnins, Cohen, Fitton, Mark, Richards and Barfod2015). The youngest dated seamount associated with this trail is the Gascoyne Seamount with an age of ∼7 Ma (McDougall & Duncan, Reference McDougall and Duncan1988; Kalnins et al. Reference Kalnins, Cohen, Fitton, Mark, Richards and Barfod2015; Crossingham et al. Reference Crossingham, Vasconcelos, Cunningham and Knesel2017) and lies 250 km north of the presumed location of the Tasmantid hotspot (Fig. 2). The majority of the Tasmantid trail (from the Gascoyne Seamount to the North Fraser Seamount; Fig. 2) erupted through 55–20 Ma oceanic crust of the Tasman Sea. North of the Fraser seamounts, magma erupted through the Cato Trough and Mellish Rise. While the Mellish Rise is interpreted as a continental fragment that rifted off the east Australian margin at the time of the Tasman Sea opening (Exon et al. Reference Exon, Hill, Lafoy, Heine and Bernardel2006 b; Gaina et al. Reference Gaina, Müller, Royer, Stock, Hardebeck and Symonds1998), the composition of the Cato Trough is more ambiguous, although likely floored by oceanic crust (Gaina et al. Reference Gaina, Müller, Royer, Stock, Hardebeck and Symonds1998). The majority of the seamounts along the Tasmantid trail have been dated using the 40Ar–39Ar method (Kalnins et al. Reference Kalnins, Cohen, Fitton, Mark, Richards and Barfod2015; Crossingham et al. Reference Crossingham, Vasconcelos, Cunningham and Knesel2017) providing a well-sampled hotspot track.
3. Materials and methods
3.a. Dredge site and sample characterization
In October–November 2012, a geophysical mapping and dredging campaign in the eastern Coral Sea was conducted on the RV Southern Surveyor during voyage ss2012_v06 (ECOSATI). As part of this survey, samples were collected from the northern reaches of Zealandia to identify the northern part of the Lord Howe Seamount Chain (Figs 2–4). Multibeam bathymetry was collected using a 30 kHz Simrad EM300 multibeam echo sounder system. These data were then combined with an existing Geoscience Australia bathymetry grid of the region to complete coverage, as presented in Seton et al. (Reference Seton, Mortimer, Williams, Quilty, Gans, Meffre, Micklethwaite, Zahirovic, Moore and Matthews2016). Slope and azimuth grids were derived for each dredge site location using GMT’s gradient function (Wessel et al. Reference Wessel, Smith, Scharroo, Luis and Wobbe2013). Detailed descriptions of the petrology, geochemistry and geochronology of the dredge samples can be found in Mortimer et al. (Reference Mortimer, Gans, Meffre, Martin, Seton, Williams, Turnbull, Quilty, Micklethwaite, Timm, Sutherland, Bache, Collot, Maurizot, Rouillard, Sensarma and Storey2018), and photos of the samples can be found in the post-voyage report (Seton et al. Reference Seton, Williams, Mortimer, Meffre and Micklethwaite2017). However, since detailed multibeam maps of the rock dredge sites have not previously been published, for completeness they are included and interpreted in this paper (Figs 3, 4).
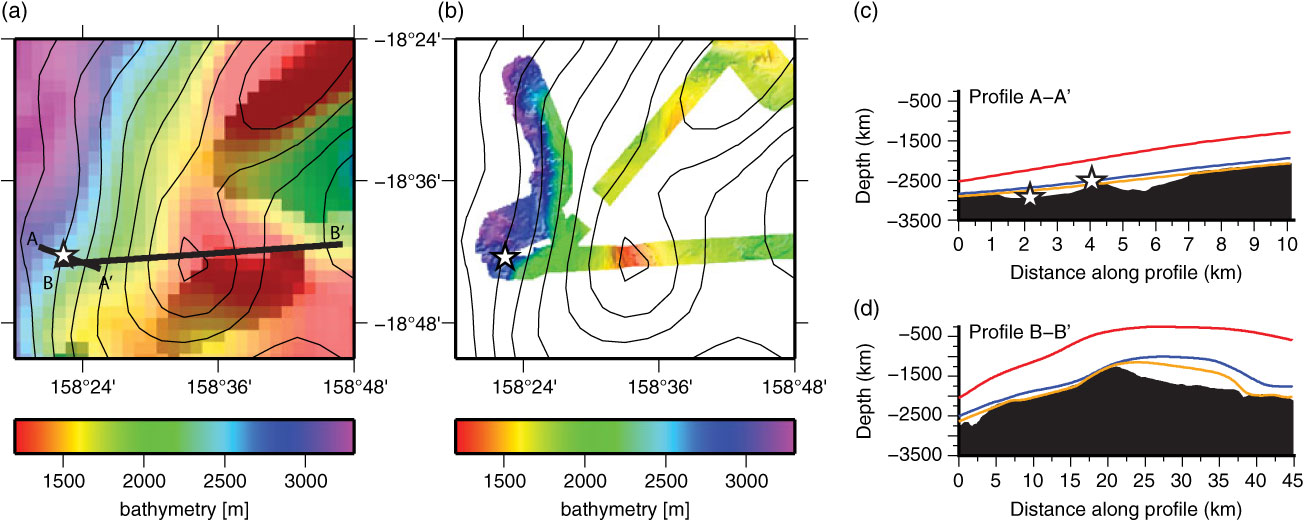
(a) Regional bathymetry from satellite altimetry and (b) higher resolution swath bathymetry from ECOSATI voyage at the Chesterfield Islands dredge site with gravity contours in 20 mGal intervals (black lines) (Sandwell & Smith, Reference Sandwell and Smith2009). Dredge site location (white star) and profiles along which bathymetry profiles were taken (thick black lines) are shown. Letters denote profile names. (c, d) Bathymetry profiles across the dredge site location based on the swath data (black), GEBCO dataset (red), ETOPO1 (blue) and Smith & Sandwell (Reference Smith and Sandwell1997) satellite-derived bathymetry (orange).

(a) Regional bathymetry from satellite altimetry and (b) higher resolution swath bathymetry from ECOSATI voyage at the Horsehead Seamount dredge site with gravity contours in 20 mGal intervals (black lines) (Sandwell & Smith, Reference Sandwell and Smith2009). Dredge site location (white stars) and profiles along which bathymetry profiles were taken (thick black lines) are shown. Letters denote profile names. (c, d) Bathymetry profiles across the dredge site location based on the swath data (black), GEBCO dataset (red), ETOPO1 (blue) and Smith & Sandwell (Reference Smith and Sandwell1997) satellite-derived bathymetry (orange).

3.b. Magma production and volume flux calculations
To calculate volume estimates and compute volume flux along the Lord Howe Seamount Chain, we followed the approach used by Wessel (Reference Wessel2016) and White (Reference White1993). These methods utilise bathymetry data to define the size of plume-related volcanic edifices, together with 40Ar–39Ar dates from individual seamounts and reconstructions of absolute plate motion relative to the underlying mantle. When computing the volume flux of offshore seamount trails, the volcanic edifices and a longer wavelength bathymetric swell need to be considered (e.g. Hawaiian seamount trail; Vidal & Bonneville, Reference Vidal and Bonneville2004; Wessel, Reference Wessel2016). The Lord Howe hotspot, in common with the nearby Tasmantid hotspot, is not associated with any clear bathymetric swell either at the inferred present-day hotspot location or along their trails, resulting in zero or negligible estimates of present-day buoyancy flux (King & Adam, Reference King and Adam2014). In addition, regional seismic tomography (Fichtner et al. Reference Fichtner, Kennett, Igel and Bunge2010) shows that the present-day plume location for the Lord Howe hotspot does not correspond to a pronounced low velocity zone in the upper mantle. Thus, we disregard any swell component within our analysis and focus solely on the volcanic edifices. The analysis is further complicated by variations in the nature of the crust into which volcanic material has been emplaced. In the case of the Lord Howe Seamount Chain, this spans both oceanic and stretched continental lithosphere and includes regions such as the Middleton Basin where the nature of the crust remains unclear. Given these complexities, we adopt a deliberately simplistic approach, excluding flexural effects. As illustrated by Wessel (Reference Wessel2016) for the Hawaiian trail, the absolute values of flux estimates are significantly influenced by the methods and assumptions used to derive them; however, the first-order trends in terms of periods of relatively high or low flux rate are generally consistent between different studies.
To make basic estimates of magma production along the Lord Howe Seamount Chain, we used bathymetry derived from satellite altimetry (Smith & Sandwell, Reference Smith and Sandwell1997). Using this bathymetry, we calculated variations in Moho depth assuming Airy isostasy, using densities of 2800 kg m−3 for the volcanic load, 3300 kg m−3 for the mantle and 1030 kg m−3 for seawater. We manually defined a polygon around the regions of excess volcanism associated with the Lord Howe Seamount Chain (Fig. 5a), and generated a bathymetry grid in which the observed bathymetry values within the polygon are masked and filled by smoothly interpolating values from the surrounding area; this constitutes the regional grid for the regional-residual separation. The difference between the observed and regional bathymetry yields a map of volcanic edifice thickness; combining this with the estimates of Moho depth yields a map of the total excess crustal thickness (edifice plus compensating crustal root; Fig. 5b). As a sensitivity study, this process was repeated using a regional bathymetry compilation (Seton et al. Reference Seton, Mortimer, Williams, Quilty, Gans, Meffre, Micklethwaite, Zahirovic, Moore and Matthews2016), which included the detailed swath data from our dredge sites. This procedure was followed for the Tasmantid Seamount Chain and compared to the estimates of Crossingham et al. (Reference Crossingham, Vasconcelos, Cunningham and Knesel2017).
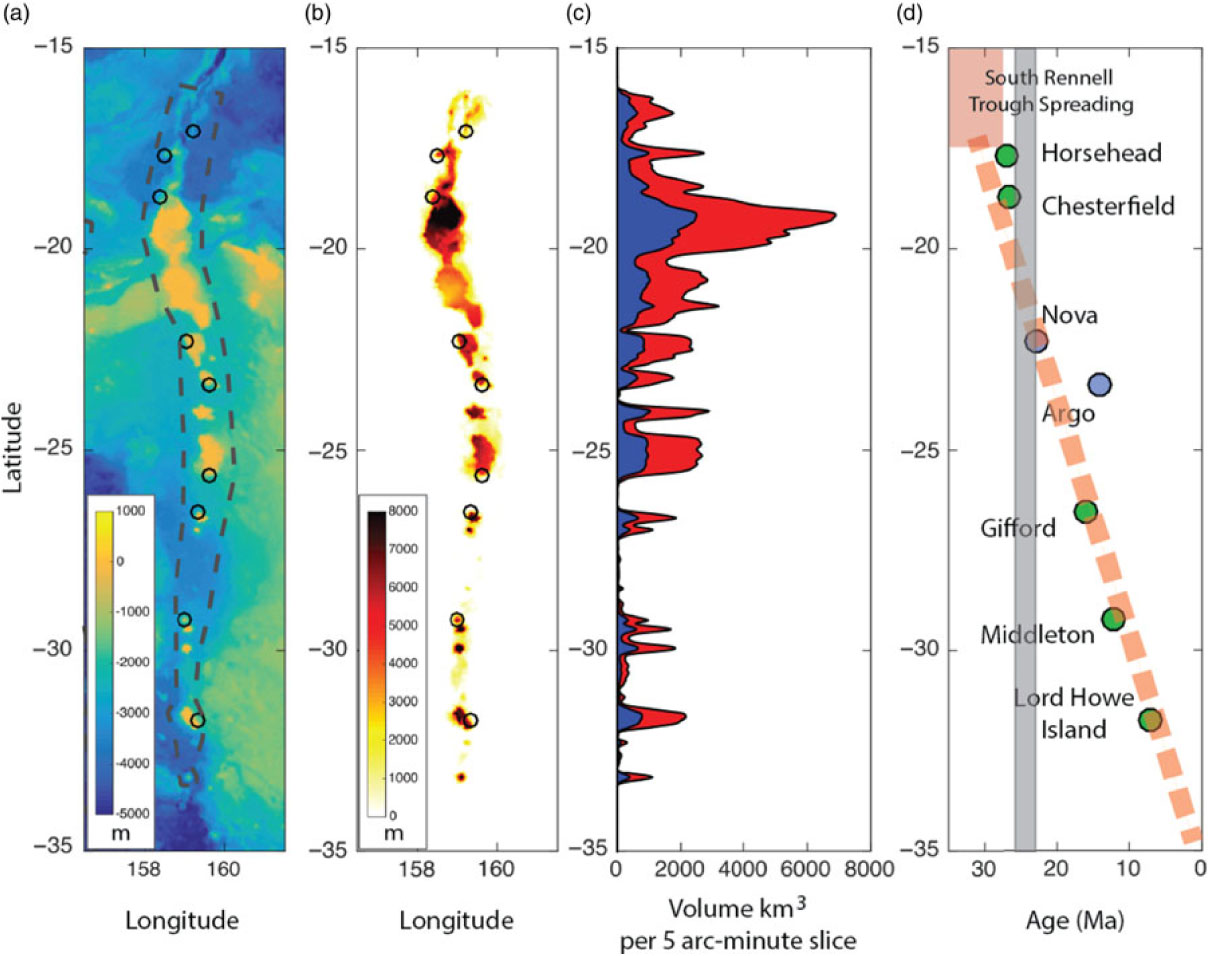
Estimates of volume of lavas along the Lord Howe hotspot trail. (a) Bathymetry data (Smith & Sandwell, Reference Smith and Sandwell1997); the dashed grey line shows the polygon to perform the regional-residual separation. (b) Residual crustal thickness derived by subtracting regional bathymetry (with seamounts removed) from the crustal thickness assuming Airy isostasy. (c) Volume of crust within 5 arc-minute latitude slices; blue region shows volume of edifice, and red area shows area of edifice plus compensating crustal root. (d) Geological ages for samples from Lord Howe trail seamounts; green symbols denote radiometrically dated volcanic samples; blue symbols denote limestones (see Mortimer et al. Reference Mortimer, Gans, Meffre, Martin, Seton, Williams, Turnbull, Quilty, Micklethwaite, Timm, Sutherland, Bache, Collot, Maurizot, Rouillard, Sensarma and Storey2018); pink dashed line marks the southward-younging trend of the Lord Howe Seamount Chain; pink box denotes the South Rennell Trough spreading system; faint grey stripe denotes approximate time range of transient slowdown in Australia’s northward motion (Knesel et al. Reference Knesel, Cohen, Vasconcelos and Thiede2008). There was a negligible difference in the resultant crustal thickness estimates if using the swath bathymetry data collected during ss2012_v06 or the global data (Smith & Sandwell, Reference Smith and Sandwell1997), consistent with the small difference observed along profiles at the dredge sites (Figs 3, 4).

To illustrate how the magmatism along the Lord Howe Seamount Chain has varied in space and time, we plotted the volume of excess estimated volcanic crust in latitudinal bins (5 arc-minutes, ∼8 km in width) (Fig. 5). This provides a first-order impression of the volume of magmatism versus time, since the overall absolute motion of the Australia plate in a mantle reference frame has been consistently northwards over the last > 30 Ma, at an average velocity of ∼60 mm yr−1. However, this figure does not directly account for changes in plate motion during this time period (Fig. 5c).
3.c. Plate motion modelling
The most likely cause of age-progressive seamount trails is the absolute motion of plates over hotspots within the mantle (Morgan, Reference Morgan1971; Wilson, Reference Wilson1973). Comparing the bathymetric expression of seamount trails, and the available age constraints, to the predicted plate motion paths from alternative absolute plate motion (APM) models allows us to determine whether changes in the eruptive history of the hotspot trails correspond to documented plate motion changes, and predict where plume-related material may reside outside the well-sampled parts of the hotspot trails. We tied a series of published fixed (Müller et al. Reference Müller, Royer and Lawver1993; Wessel & Kroenke, Reference Wessel and Kroenke2008) and moving (Steinberger et al. Reference Steinberger, Sutherland and O’Connell2004; O’Neill et al. Reference O’Neill, Müller and Steinberger2005; Doubrovine et al. Reference Doubrovine, Steinberger and Torsvik2012) APM models to a relative plate motion model (Müller et al. Reference Müller, Seton, Zahirovic, Williams, Matthews, Wright, Shephard, Maloney, Barnett-Moore and Hosseinpour2016) to assess the effectiveness of each APM model in predicting the Tasmantid and Lord Howe seamount chains. The APM models used here were selected based on evaluation of their global consistency with both hotspot trails and other geodynamic criteria (Williams et al. Reference Williams, Flament, Müller and Butterworth2015) and have a resolution of 10 million years, which is a consequence of the ways in which the models are derived.
4. Results
4.a. Chesterfield Plateau dredge site
The Chesterfield Islands are a small group of uninhabited islands and shallow reef systems in the northern part of the Chesterfield Plateau, which is presumed to be floored by continental crust (Terrill, Reference Terrill1975; Mortimer et al. Reference Mortimer, Gans, Meffre, Martin, Seton, Williams, Turnbull, Quilty, Micklethwaite, Timm, Sutherland, Bache, Collot, Maurizot, Rouillard, Sensarma and Storey2018) (Fig. 1). Much of the Chesterfield Plateau appears to be flat and smooth topped (guyot-like). At our specific site location ∼50 km north of the Chesterfield Islands (Figs 2, 3), the highest elevation is at ∼1300 m below sea level, forming a small ∼7 km wide peak, with relatively smooth elevations ranging from 1500–1800 m in the northeast. A small knoll and ridge complex in deeper water (down to 3100 m) exists to the west of the plateau. Slopes in excess of 30° are present.
Dredging at this site occurred along profile A (Fig. 3) starting at a depth of ∼2630 m at the base of the slope and ending at ∼2522 m upslope. As reported in Mortimer et al. (Reference Mortimer, Gans, Meffre, Martin, Seton, Williams, Turnbull, Quilty, Micklethwaite, Timm, Sutherland, Bache, Collot, Maurizot, Rouillard, Sensarma and Storey2018), the dredge recovered pebble-sized pieces of thinly manganese-coated lava and limestone. The lavas included a 4 × 2 × 1 cm angular piece of subtrachytic, sparsely olivine-phyric basalt and three ∼1 cm pieces of olivine-plagioclase porphyritic altered basalt with a subtrachytic groundmass (see Mortimer et al. Reference Mortimer, Gans, Meffre, Martin, Seton, Williams, Turnbull, Quilty, Micklethwaite, Timm, Sutherland, Bache, Collot, Maurizot, Rouillard, Sensarma and Storey2018 for detailed description). Geochemically, these samples are consistent with those collected from the younger seamounts of the Lord Howe Seamount Chain, and the samples have a preferred 40Ar–39Ar age of 28.1 ± 1.0 Ma (Mortimer et al. Reference Mortimer, Gans, Meffre, Martin, Seton, Williams, Turnbull, Quilty, Micklethwaite, Timm, Sutherland, Bache, Collot, Maurizot, Rouillard, Sensarma and Storey2018).
The Bellona Plateau (just to the south of the Chesterfield Islands) has previously been interpreted as the site of the northernmost part of the Lord Howe Seamount Chain and inferred as either middle Eocene in age or younger (Missègue & Collot, Reference Missègue and Collot1987) or c. 25 Ma based on hotspot migration rate estimates (Exon et al. Reference Exon, Hill, Lafoy, Heine and Bernardel2006 b). The results of Mortimer et al. (Reference Mortimer, Gans, Meffre, Martin, Seton, Williams, Turnbull, Quilty, Micklethwaite, Timm, Sutherland, Bache, Collot, Maurizot, Rouillard, Sensarma and Storey2018) and our study confirm that intraplate volcanism occurred on the Chesterfield Plateau, with the seafloor morphology suggesting a larger volume of material was erupted at this site than at the younger seamounts that make up the Lord Howe Seamount Chain. The timing of eruption occurred sometime between 28 and 23 Ma, consistent with the Exon et al. (Reference Exon, Hill, Lafoy, Heine and Bernardel2006 b) estimate.
4.b. Horsehead Seamount dredge site
At the southern termination of the South Rennell Trough lies a flattish, slightly convex feature with two distinct elevated areas separated by a featureless (perhaps highly sedimented) ∼2300 m deep trough. This site location has been unofficially named the Horsehead Seamount by Mortimer et al. (Reference Mortimer, Gans, Meffre, Martin, Seton, Williams, Turnbull, Quilty, Micklethwaite, Timm, Sutherland, Bache, Collot, Maurizot, Rouillard, Sensarma and Storey2018) owing to its shape in regional bathymetry compilations. The elevated region to the northeast of the area shown in Figure 4a, b is characterized by a small (15 km wide) peak with an elevation of 1300 m below sea level. There is a flattish elevated area to the west and south of the area shown in Figure 4a, b at depths between 1700 and 1900 m (Fig. 4). The gradual slope in the southwest corner may be a debris flow or mass wasting sourced from the platform.
The dredge site targeted a steep slope in the southwestern corner (Fig. 4), hitting the bottom at 2537 m at the base of the slope and being dragged upslope along profile A (Fig. 4) to ∼1900 m. As reported in Mortimer et al. (Reference Mortimer, Gans, Meffre, Martin, Seton, Williams, Turnbull, Quilty, Micklethwaite, Timm, Sutherland, Bache, Collot, Maurizot, Rouillard, Sensarma and Storey2018), the dredge yielded predominantly hard cream-coloured shallow-water limestone, manganese crusts and small (0.5–3 cm diameter) pieces of lava. Geochemically, the lavas are typically intraplate basalts with a preferred 40Ar–39Ar age of 27.24 ± 0.24 Ma (Mortimer et al. Reference Mortimer, Gans, Meffre, Martin, Seton, Williams, Turnbull, Quilty, Micklethwaite, Timm, Sutherland, Bache, Collot, Maurizot, Rouillard, Sensarma and Storey2018).
4.c. Magma production along the onshore and offshore trails
Volume calculations of the volcanic edifices along a hotspot trail can provide an important first-order relationship between the mantle and surface plate motions and a direct record of the volcanic output from a hotspot trail. Our results produce an estimate of 320 000 km3 for the amount of volcanic material along the Lord Howe Seamount Chain since ∼28 Ma (Fig. 5c). This compares to around 210 000 km3 of volcanic material for the Tasmantid Seamount Chain since ∼32 Ma using the same methodology (Fig. 7) or 46 000 km3 based on the calculations of Crossingham et al. (Reference Crossingham, Vasconcelos, Cunningham and Knesel2017). For the Tasmantid Seamount Chain, the significant (∼80 %) difference between the two estimates can largely be explained by the inclusion of the compensating root of the volcanic edifices (see Wessel, Reference Wessel2016) and smaller scale features along the inferred track in our methodology. In contrast, the Crossingham et al. (Reference Crossingham, Vasconcelos, Cunningham and Knesel2017) method uses a digital elevation model restricted to the coverage of the swath data and a simple volume calculation based on a height estimate relative to the surrounding seafloor. Combined, the total magma production for the offshore trails is calculated to be 530 000 km3 over a 35 Ma period, which may be important to consider if the two trails are being fed by a single plume source. Volume estimates can be converted into a volume flux over the entire length of the hotspot trails. This yields estimates of 0.4 m3 s−1 and 0.27 m3 s−1 for the Lord Howe and Tasmantid seamount chains, respectively.
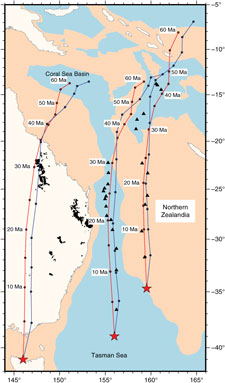
Comparison of our two preferred APM models. Red line indicates the plate motion path using a global moving hotspot reference model (Steinberger et al. Reference Steinberger, Sutherland and O’Connell2004). Blue line indicates a fixed Pacific hotspot model (Wessel & Kroenke, Reference Wessel and Kroenke2008). Tick marks are every 5 Ma, but note that the models themselves have a resolution only every 10 Ma. Black triangles denote the dated seamounts from the Tasmantid and Lord Howe seamount chains for comparison to the motion paths. Black polygons onshore are the volcanic provinces of Davies et al. (Reference Davies, Rawlinson, Iaffaldano and Campbell2015). Red stars denote the inferred present-day location of the hotspots for each trail. Peach coloured polygons denote submerged continental crust.

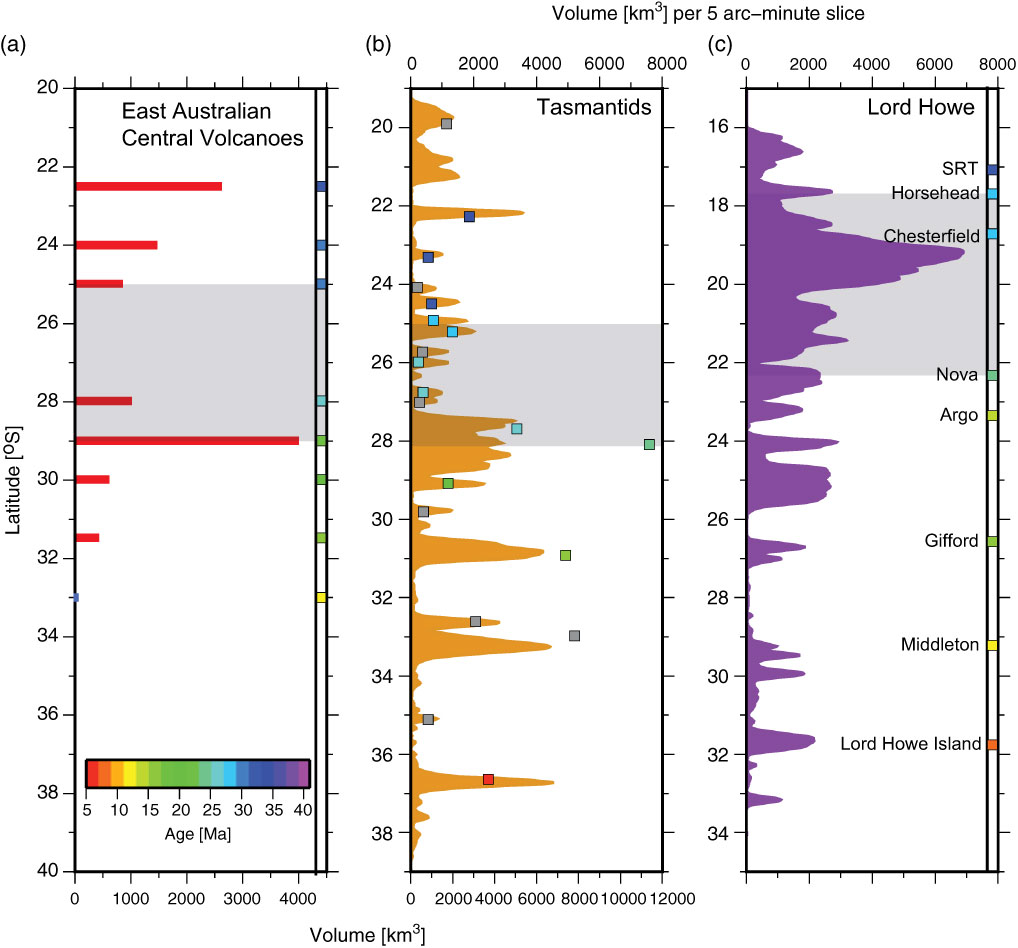
Comparison of volume estimates from both the onshore and offshore trails. (a) Volume estimates for the central volcanoes (red bars) with age estimates represented as coloured squares based on Jones & Verdel (Reference Jones and Verdel2015). These volcanic edifices have erupted on mostly Australian continental crust. Note that age estimates are shown by the coloured squares in all three columns, with an age scale in the horizontal bar in column (a). (b) Volume estimates for the Tasmantid Seamount Chain based on our study (orange curve) with the coloured squares representing not just the ages but also the volume estimates for individual seamounts from Crossingham et al. (Reference Crossingham, Vasconcelos, Cunningham and Knesel2017). These volcanic edifices have erupted on mostly Tasman Sea oceanic crust. (c) Volume estimates for the Lord Howe Seamount Chain based on our study (purple curve) with age estimates from dredge samples represented as coloured squares. These volcanic edifices have erupted on mostly continental crust of Northern Zealandia. SRT – South Rennell Trough. Grey bar represents the 27–23 Ma slowdown of the Australian plate, based on the age ranges of the dated seamounts. See Figure 6 for the locations of the present-day hotspots for each trail.

Comparing the volume estimates from both the onshore and offshore tracks, we find that the seamount with the highest apparent volume is located in the northern part of the Lord Howe Seamount Chain at the Bellona and Chesterfield plateaus (Figs 5, 7). The age constraint from the Chesterfield Plateau places the start of the peak in volcanism at c. 28–27 Ma, with the peak continuing southward on the Bellona Plateau where there are no age constraints, but according to Exon et al. (Reference Exon, Hill, Lafoy, Heine and Bernardel2006 b) could extend to ∼25 Ma. The start of the peak in volcanism along the Lord Howe Seamount Chain corresponds to a slight peak along the Tasmantid Chain at the North and South Recorder seamounts (Crossingham et al. Reference Crossingham, Vasconcelos, Cunningham and Knesel2017) (Fig. 2). The highest volumes along this chain occur at the Britannia and Queensland seamounts, corresponding to an age range of between 25 and 23 Ma (Fig. 7) and overlapping with the inferred 25 Ma age at the Bellona Plateau along the Lord Howe Seamount Chain. The peak in magmatism along the Tasmantid Chain is also interpreted to coincide with the onshore Tweed and Main Range central volcanoes in eastern Australia (Knesel et al. Reference Knesel, Cohen, Vasconcelos and Thiede2008).
The general trend in magma production along the Lord Howe Seamount Chain is a southward decrease (i.e. towards the present day) reflected in both the spatial frequency and magnitude of eruption (Fig. 5c). This southward-decreasing trend is replicated in the onshore central volcanoes from c. 35 Ma to the present day, except for a volume increase between 25 and 23 Ma at the time of a slowdown in Australian plate motion (Knesel et al. Reference Knesel, Cohen, Vasconcelos and Thiede2008) (Fig. 7). After the slowdown, a notable volcanic gap of 250 km (∼4 Ma) exists between the Gifford and Middleton sites along the Lord Howe Seamount Chain in which negligible magmatism is suggested based on both bathymetry and seismic profiles that image undisturbed sediments where the trail would have passed under the Middleton Basin (Norvick et al. Reference Norvick, Langford, Hashimoto, Rollet, Higgins, Morse, Blevin, Bradshaw and Uruski2008). In contrast, the opposite trend in the magnitude of eruption is observed along the Tasmantid trail, irrespective of whether our methodology or that of Crossingham et al. (Reference Crossingham, Vasconcelos, Cunningham and Knesel2017) (Fig. 7) is used. The northern (old) end of the Tasmantid trail has volumes of ∼2000 km3 for individual volcanic centres (Fig. 7), which increases to reach a maximum of just under 8000 km3 around 28° S, again corresponding to a slowdown in Australian plate motion. Higher volumes at individual seamounts (∼3000–5000 km3) are erupted along the youngest part of the trail. The consistent trend observed along all trails is in the spatial frequency of eruption, particularly the change to decreased spatial frequency after the magmatic peak at 27–23 Ma. Investigating the reason for this change in behaviour of the hotspot source is hindered by the lack of age constraints for the younger parts of the trails, particularly of the Taupo Seamount along the Tasmantid Chain and the lack of radiometric ages for the Nova and Argo banks and Flinders Seamount along the Lord Howe Seamount Chain.
4.d. Plate modelling of the offshore trails
We computed three plate motion paths for each APM model based on the predicted position of the present-day hotspot related to the East Australia/Cosgrove, Tasmantid and Lord Howe trails, sampling at 5 Ma intervals over a 60 Ma time period (Fig. 6). We limited our analysis to 60 Ma as global moving hotspot reference frames are most reliable for the past 60–70 Ma (Williams et al. Reference Williams, Flament, Müller and Butterworth2015), and also to account for the oldest identified seamounts along the Tasmantid trail being > 50 Ma (Kalnins et al. Reference Kalnins, Cohen, Fitton, Mark, Richards and Barfod2015).
The plate motion paths computed for the alternative APM models reveal that the global moving hotspot reference frame of Steinberger et al. (Reference Steinberger, Sutherland and O’Connell2004) (GMHS) embedded within the Müller et al. (Reference Müller, Seton, Zahirovic, Williams, Matthews, Wright, Shephard, Maloney, Barnett-Moore and Hosseinpour2016) relative plate motions and the Wessel & Kroenke (Reference Wessel and Kroenke2008) fixed Pacific hotspot (W08) model best match with the observed bathymetric expression of seamount trails for both the Tasmantid and Lord Howe hotspot tracks (Mortimer et al. Reference Mortimer, Gans, Meffre, Martin, Seton, Williams, Turnbull, Quilty, Micklethwaite, Timm, Sutherland, Bache, Collot, Maurizot, Rouillard, Sensarma and Storey2018) (Fig. 6). The new age constraints for the northern end of the Lord Howe trail fit in well with our expectations based on the predicted paths (within ∼100 km), without the need to invoke large hotspot motions. The correlation is strongest for the past 20–25 Ma, with the GMHS model matching best for the Lord Howe Seamount Chain and the W08 model for the Tasmantid Chain. Owing to the much thicker continental lithosphere beneath eastern Australia, where the distribution of volcanoes is influenced by factors such as thicker lithosphere impeding magma ascent (Davies et al. Reference Davies, Rawlinson, Iaffaldano and Campbell2015) and zones of crustal weakness enhancing magma ascent, it is difficult to resolve between models, but the preferred predicted trails broadly follow the Cosgrove Track presented in Davies et al. (Reference Davies, Rawlinson, Iaffaldano and Campbell2015). The two predicted tracks diverge at c. 35 Ma across all trails, reflecting a combination of relative plate motions within the area of interest (for example, the opening of the South Rennell Trough between ∼40 and 28–25 Ma and the opening of the Tasman and Coral seas and Louisiade Trough prior to 52 Ma), greater global uncertainty in plate motions and, perhaps, an increase in motion between the hotspots of the Pacific and Indo-Atlantic realm during this time.
5. Discussion
5.a. Magma production and plate motion changes
Our estimates of magma production along the Lord Howe and Tasmantid seamount chains (320 000 km3 and 210 000 km3, respectively) account for material erupted both above the surrounding ocean floor and the compensating root of the volcanic edifices. For comparison, previous estimates for the volume of magma produced along onshore eastern Australia (central volcanoes) are ∼11 000 km3 (Vasconcelos et al. Reference Vasconcelos, Knesel, Cohen and Heim2008; Jones & Verdel, Reference Jones and Verdel2015) (Fig. 7), more than an order of magnitude less than the offshore trails. This is likely owing to some combination of an underestimate of the real thickness of the units, extensive erosion and weathering, and the thicker continental lithosphere impeding magma ascent. Jones & Verdel (Reference Jones and Verdel2015) attempted to produce better volume estimates by calculating basalt thickness from an extensive core dataset. However, their estimates are based on a smaller portion of the eastern volcanic rocks (for example, Hillsborough, Nebo, Mainrange and others are not included) and also suffer from weathering and erosion. Volume estimates for the volcanic rocks produced along the Cosgrove Track are < 3 km3 (Cundari, Reference Cundari and Johnson1989) and insignificant when compared to the central volcanoes. In summary, the eruptive estimates from the onshore trail are likely to be a gross underestimation of the true volume of material erupted onshore, and great caution should be taken when these estimates are used to infer the type or behaviour of the plume(s) operating in the area. A comparison of volume estimates for the Lord Howe and Tasmantid trails with other offshore trails reveals that they are at least an order of magnitude smaller than Iceland (22.1 million km3; Mjelde & Faleide, Reference Mjelde and Faleide2009) and Hawaii (6.2 million km3; Adam et al. Reference Adam, Vidal and Escartín2007) and significantly smaller than the Ninetyeast Ridge associated with the Kerguelen hotspot (4.7 million km3; Coffin et al. Reference Coffin, Pringle, Duncan, Gladczenko, Storey, Müller and Gahagan2002) and the Walvis Ridge in the South Atlantic (2.1 million km3; Adam et al. Reference Adam, Vidal and Escartín2007), albeit these trails cover a longer age range. However, the magma production volumes along the Lord Howe and Tasmantid trails individually are higher than those calculated for the long-lived Louisville trail in the South Pacific (130 000 km3; Koppers et al. Reference Koppers, Gowen, Colwell, Gee, Lonsdale, Mahoney and Duncan2011), for example.
Volume estimates can be converted into a volume flux over the entire length of the hotspot trails. This yields estimates of 0.4 m3 s−1 and 0.27 m3 s−1 for the Lord Howe and Tasmantid seamount chains, respectively. While the volcanic flux for the Lord Howe and Tasmantid trails is a tentative estimate, this flux similarly is an order of magnitude smaller than the present flux at Hawaii (Wessel, Reference Wessel2016), the Ninetyeast Ridge (Coffin et al. Reference Coffin, Pringle, Duncan, Gladczenko, Storey, Müller and Gahagan2002; Sreejith & Krishna, Reference Sreejith and Krishna2015) and Iceland (Mjelde et al. Reference Mjelde, Wessel and Müller2010), but is closer to fluxes calculated for sections of the Hawaiian trail > 30 Ma old (Wessel, Reference Wessel2016) and St Helena in the South Atlantic (Adam et al. Reference Adam, Vidal and Escartín2007) and larger than those calculated for the Madeira, Yellowstone and Louisville hotspots (Mjelde et al. Reference Mjelde, Wessel and Müller2010). Jones & Verdel (Reference Jones and Verdel2015) provided a volume flux (or eruptive rate) estimate from the onshore Central Volcanic Province of 0.04 m3 s−1, an order of magnitude smaller than the Lord Howe Seamount Chain volcanic rocks, but this should be thought of as a significant underestimation. Although the rate of magma production along the Lord Howe and Tasmantid trails is on the lower end of the volume flux scale when compared to a global dataset (Mjelde et al. Reference Mjelde, Wessel and Müller2010), together with the volume estimates, they are consistent with the values at some long-lived hotspot trails that have been attributed to a deep-plume source.
The age progression from the more highly sampled Tasmantid trail and Australian onshore volcanism has previously been interpreted to show a transient deceleration in Australia’s northward motion in late Oligocene time, lasting 3–6 Ma (Knesel et al. Reference Knesel, Cohen, Vasconcelos and Thiede2008; Crossingham et al. Reference Crossingham, Vasconcelos, Cunningham and Knesel2017). The new age constraints from the Horsehead and Chesterfield sites support the view that the kinks in the Tasmantid and Lord Howe trails formed roughly contemporaneously, although the peak in magma production rate seems to be broader along the Lord Howe trail than the Tasmantid trail. The volume versus latitude plot for the Lord Howe Seamount Chain (Fig. 5c) shows a pronounced peak at the Bellona and Chesterfield plateaus that broadly corresponds to this time of interpreted transient plate motion change. This may reflect slower motion of the plate over a hotspot source, enhanced volcanic flux triggered by changes in plate motion and intraplate stress fields, or some combination of these processes. Another alternative to explain the peak in magma flux is that it is associated with plume temperatures at the start-up phase of volcanism, as has been documented in Iceland (Spice et al. Reference Spice, Fitton and Kirstein2016). However, it is unknown whether the Horsehead and Chesterfield sites mark the start-up phase of volcanism along this trail and, secondly, edifice volumes along the Tasmantid trail calculated in this study as well as by Crossingham et al. (Reference Crossingham, Vasconcelos, Cunningham and Knesel2017) also peak in late Oligocene time, suggesting that the increase in magma flux may be more regional in nature. The peak in magmatism may also be influenced by the known presence of carbonate platform growth in the area. However, the reduction in volume is likely small (in the order of 200 km3 per 5 arc-minute slice) if we assume a similar carbonate thickness as the adjacent Coriolis Ridge of 200 m (Exon et al. Reference Exon, Hill, Lafoy, Heine and Bernardel2006 b).
Another clear observation is that over the last > 20 Ma, the dominant trend within the Lord Howe Seamount Chain is one of decreasing output, consistent with a waning plume not associated with any swell or strong mantle seismic velocity signature at the present day (Montelli et al. Reference Montelli, Nolet, Dahlen, Masters, Engdahl and Hung2004). Jones & Verdel (Reference Jones and Verdel2015) also attributed the decrease in volume estimates along the central volcanoes together with the decreasing eruption rate to waning plume influence. More general variations in magma output within the > 25 Ma lifespan of the trail may result from plume pulsation, changes in plate motion or spatial variations in the lithosphere (Mjelde et al. Reference Mjelde, Wessel and Müller2010; Davies et al. Reference Davies, Rawlinson, Iaffaldano and Campbell2015; Sreejith & Krishna, Reference Sreejith and Krishna2015; Wessel, Reference Wessel2016). Taken broadly, the Lord Howe Seamount Chain appears to show eruption peaks around every 5 Ma, consistent with the plume pulsations noted by Mjelde et al. (Reference Mjelde, Wessel and Müller2010), who attributed them to fluctuations in core–mantle interactions of deep-plume sources.
5.b. Relationship of the Lord Howe Seamount Chain to South Rennell Trough spreading
The northernmost dated seamount that can be directly related to the Lord Howe Seamount Chain, the Horsehead Seamount, is located at the southwestern end of the South Rennell Trough (Figs 1, 2). The South Rennell Trough is a relict Eocene–Oligocene slow to ultra-slow spreading centre (Mortimer et al. Reference Mortimer, Gans, Palin, Herzer, Pelletier and Monzier2014), with spreading rates ranging from 10 to 30 mm yr−1 (Seton et al. Reference Seton, Mortimer, Williams, Quilty, Gans, Meffre, Micklethwaite, Zahirovic, Moore and Matthews2016). The South Rennell Trough ceased spreading at ∼28 Ma (Mortimer et al. Reference Mortimer, Gans, Palin, Herzer, Pelletier and Monzier2014), roughly contemporaneously with the initiation of Lord Howe trail ‘intraplate’ volcanism. In addition, the total volume of magmatism produced along the Lord Howe trail (320 000 km3) suggests a similar rate of crustal production to the ultra-slow spreading South Rennell Trough (∼480 000–720 000 km3). One hypothesis consistent with these observations is that the mantle upwelling associated with the Lord Howe Seamount Chain is genetically related to upwelling beneath the South Rennell Trough spreading centre.
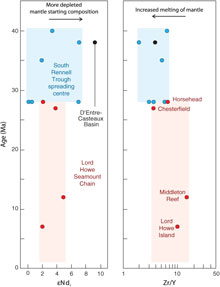
Previously reported whole-rock geochemistry of basalts from the South Rennell Trough spreading system (Fig. 1) confirms mainly mid-ocean ridge basalt (MORB) back-arc basin type basalts (Mortimer et al. Reference Mortimer, Gans, Palin, Herzer, Pelletier and Monzier2014; Seton et al. Reference Seton, Mortimer, Williams, Quilty, Gans, Meffre, Micklethwaite, Zahirovic, Moore and Matthews2016). However, with the scant available data, the basalts in the southern part of the South Rennell Trough, near the intraplate Lord Howe Seamount Chain, possibly show a southward-increasing plume-like ocean island basalt influence (Mortimer et al. Reference Mortimer, Gans, Meffre, Martin, Seton, Williams, Turnbull, Quilty, Micklethwaite, Timm, Sutherland, Bache, Collot, Maurizot, Rouillard, Sensarma and Storey2018). In any case, basalts from the northern seamounts of the Lord Howe chain at least show an overlap in key geochemical parameters (e.g. Zr/Y, initial ɛNd) intermediate between the clearly intraplate compositions of the younger seamounts to the south, and enriched-MORB (E-MORB)-like lavas of the older South Rennell Trough slow spreading system to the north (Fig. 8). This overlap in geochemical signature supports ridge–hotspot interaction along the South Rennell Trough during its opening. We speculate that when spreading at the South Rennell Trough ceased around 28–25 Ma, perhaps related to the soft collision of the Ontong Java Plateau (Seton et al. Reference Seton, Mortimer, Williams, Quilty, Gans, Meffre, Micklethwaite, Zahirovic, Moore and Matthews2016), the upwelling could no longer find an outlet at a divergent plate boundary and instead switched into an intraplate hotspot mode. This may explain why the APM models for the Lord Howe Seamount Chain work well until 25 Ma but are less reliable for older times, as the surface expression of the volcanism before 28 Ma was controlled by the upwelling associated with South Rennell Trough spreading rather than dominated by the upwelling plume. To further explore this genetic relationship between an ultra-slow spreading system and along-ridge hotspot migration and to confirm this hypothesis, denser sampling of seamounts from both flanks of the South Rennell Trough will be required, as well as more complete isotopic characterization of lavas.
ɛNd (mantle composition proxy) and Zr/Y (% melting proxy) of selected igneous rocks plotted as a function of age. Lord Howe Seamount Chain samples are in red; basalts from the E-MORB South Rennell Trough spreading system blue; samples from the nearby N-MORB D’Entrecasteaux Basin are black. Given the N–S-oriented hotspot track, Lord Howe Seamount Chain age co-varies with latitude (Fig. 6); South Rennell spreading centre ages vary laterally with distance from the South Rennell Trough. Data from Mortimer et al. (Reference Mortimer, Gans, Palin, Herzer, Pelletier and Monzier2014, Reference Mortimer, Gans, Meffre, Martin, Seton, Williams, Turnbull, Quilty, Micklethwaite, Timm, Sutherland, Bache, Collot, Maurizot, Rouillard, Sensarma and Storey2018) and Seton et al. (Reference Seton, Mortimer, Williams, Quilty, Gans, Meffre, Micklethwaite, Zahirovic, Moore and Matthews2016). Errors in ages omitted for clarity.

5.c. Plume inception
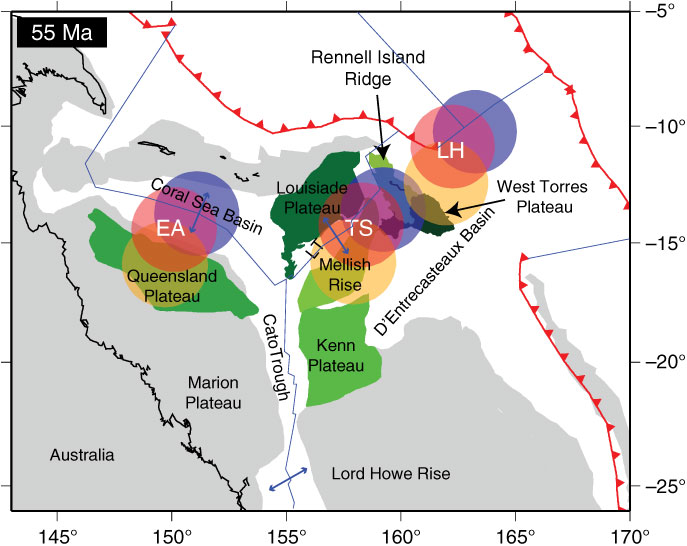
The oldest identified seamounts of the Lord Howe Seamount Chain are the Horsehead and Chesterfield seamounts (Fig. 2) with an age of ∼27–28 Ma (Mortimer et al. Reference Mortimer, Gans, Meffre, Martin, Seton, Williams, Turnbull, Quilty, Micklethwaite, Timm, Sutherland, Bache, Collot, Maurizot, Rouillard, Sensarma and Storey2018). If a connection with South Rennell Trough E-MORB spreading is accepted, then volcanism started above the Lord Howe plume as early as 40–38 Ma (Seton et al. Reference Seton, Mortimer, Williams, Quilty, Gans, Meffre, Micklethwaite, Zahirovic, Moore and Matthews2016). In contrast, the oldest identified seamounts of the Tasmantid Chain have been reported as > 55 Ma at the Mellish Rise (Kalnins et al. Reference Kalnins, Cohen, Fitton, Mark, Richards and Barfod2015), and the oldest reported ages of the Cosgrove Track onshore is 34 Ma (Cohen et al. Reference Cohen, Knesel, Vasconcelos and Schellart2013). These trails likely continue further north, into the Coral Sea, as previously suggested by Sutherland (Reference Sutherland1983), but no associated northern bathymetric expression of these trails has been identified. These potential bathymetric expressions could either be in the form of a continuation of a seamount chain or the presence of a Large Igneous Province (LIP). Based on our analysis of our preferred APM model for the three trails (East Australia, Tasmantid and Lord Howe), we make predictions on where early plume products associated with these trails may reside.
Following the East Australia track, we find that the Queensland Plateau and parts of the ocean floor that would have existed to the north of Papua New Guinea are predicted to contain plume products (Fig. 9). The Queensland Plateau (Fig. 1) is separated from the Marion Plateau by the Townsville Trough. Samples from Queensland Plateau Ocean Drilling Program (ODP) drillholes 824 and 825 recovered schist and greywacke, thus confirming a continental basement for the Queensland Plateau (Feary et al. Reference Feary, Champion, Bultitude, Davies, McKenzie and Davies1993). Several metres of altered basaltic and andesitic continental tholeiites are present in ODP 824 (Mortimer et al. Reference Mortimer, Hauff and Calvert2008). These are, as yet, undated, but may represent pre-Eocene volcanism related to that further south in eastern Australia. Recent plate reconstructions of Papua New Guinea and Melanesia (Seton et al. Reference Seton, Mortimer, Williams, Quilty, Gans, Meffre, Micklethwaite, Zahirovic, Moore and Matthews2016; Zahirovic et al. Reference Zahirovic, Matthews, Flament, Müller, Hill, Seton and Gurnis2016) indicate that the area to the north of the Coral Sea contained oceanic crust of the Sepik and Melanesian back-arc basins at c. 60–50 Ma. While this material may have been subducted or obducted along the southeastern part of Papua New Guinea, there is no geological evidence to suggest that plume-related material has been obducted onto Papua New Guinea. We therefore suggest that the Queensland Plateau is the most likely candidate to host plume material associated with the eastern Australian hotspot.
Reconstruction at 55 Ma of the northeastern corner of the Australian plate based on Seton et al. (Reference Seton, Mortimer, Williams, Quilty, Gans, Meffre, Micklethwaite, Zahirovic, Moore and Matthews2016). Circles indicate the predicted location of the hotspot for the three trails (EA – Eastern Australia; TS – Tasmantid; LH – Lord Howe) based on the APM model of Steinberger et al. (Reference Steinberger, Sutherland and O’Connell2004) and a radius of 400 km at 50 Ma (orange), 55 Ma (red) and 60 Ma (blue). The bathymetric features in the area that have the potential to either contain plume products or be a candidate LIP for the plume(s) are coloured in various shades of green. Red lines denote subduction zones; blue lines are transform faults and spreading ridges.

According to our plate modelling, plume products associated with the Tasmantid trail may be found either on the Kenn Plateau, Mellish Rise, Louisiade Plateau and/or Rennell Island Ridge (Fig. 9). At least some of the Kenn Plateau has been confirmed as containing continental basement (Exon et al. Reference Exon, Hill, Lafoy, Heine and Bernardel2006 b), which likely continues eastwards to underlie the Bellona and Chesterfield plateaus (Harris et al. Reference Harris, Heap, Passlow, Sbaffi, Fellows, Porter-Smith, Buchanan and Daniell2003). The submerged Louisiade Plateau and Mellish Rise may be composed of continental material that rifted from the Australian margin during Tasman and Coral Sea opening in Late Cretaceous–Paleocene times (Willcox et al. Reference Willcox, Symonds, Hinz and Bennett1980; Gaina et al. Reference Gaina, Müller, Royer, Stock, Hardebeck and Symonds1998; Gaina et al. Reference Gaina, Müller, Royer and Symonds1999), yet only sediments with terrigenous material from basement highs on the Mellish Rise (Hoffmann et al. Reference Hoffmann, Exon, Quilty, Findlay and Wickins2008) infer a continental origin. Global compilations of LIP locations (Coffin et al. Reference Coffin, Duncan, Eldholm, Fitton, Frey, Larsen, Mahoney, Saunders, Schlich and Wallace2006; Bryan & Ernst, Reference Bryan and Ernst2008) include the Louisiade Plateau in their datasets, implying that it is either entirely volcanic or capped by volcanic rocks (Cowley et al. Reference Cowley, Mann and Gahagan1998). Such an interpretation is, however, speculative. Further east, MORB-type and subduction-related basalts have been recovered from the Rennell Island Ridge, with no plume-like signature. Yet whether these samples are reflective of the ridge’s basement remains unclear, and obtaining basement from this feature is difficult as it is believed to be capped by at least 500 m thick carbonates (Récy et al. Reference Récy, Dubois, Daniel, Dupont and Launay1977). Chromite chemistry obtained from detrital chromite within a thin sandstone bed in mid to upper Eocene mudstone that was collected from the western flank of the Rennell Island Ridge indicates derivation from an eroding ocean island basalt-type volcanic source (Seton et al. Reference Seton, Mortimer, Williams, Quilty, Gans, Meffre, Micklethwaite, Zahirovic, Moore and Matthews2016). This suggests that plume-related magmatism may have occurred on this ridge prior to 34 Ma.
As noted previously, there appears to be a genetic relationship between the Lord Howe hotspot and the South Rennell Trough. We suggest that volcanism along the South Rennell Trough may be the northward continuation of a precursor to the Lord Howe Seamount Chain. The E-MORB-like volcanism associated with this ‘proto-Lord Howe trail’ may have been funnelled through the South Rennell Trough spreading axis, thereby deviating from the simple linear bathymetric expression of seamounts associated with this trail and plate motion paths. Other than the South Rennell Trough, there are several candidate features for early Lord Howe Seamount Chain plume products (Fig. 1). These include the Rennell Island Ridge, noted above, and the West Torres Plateau. Plate reconstructions, which close spreading along the Santa Cruz Basin – South Rennell Trough, imply that the West Torres Plateau formed adjacent to the Rennell Island Ridge (Seton et al. Reference Seton, Mortimer, Williams, Quilty, Gans, Meffre, Micklethwaite, Zahirovic, Moore and Matthews2016) (Fig. 9). While these two features are now ∼250 km apart, they may contain a common history, which might involve plume activity. Plume products may also have existed on the now-subducted ocean floor of the Melanesian back-arc basin (Fig. 9), although much of this evidence would have been subducted at the Melanesian subduction zone or later obducted on to the Solomon Islands during Pliocene arc reversal (Cooper & Taylor, Reference Cooper and Taylor1985).
6. Conclusions
We have used a combination of radiometric dating of dredged volcanic samples, magma production estimates and plate modelling of the offshore Lord Howe and Tasmantid seamount chains to examine the history of magmatic activity along the trails. Our results from the Lord Howe Seamount Chain combined with an analysis of the Tasmantid and East Australian volcanic rocks show that these trails are broadly consistent with northward motion of the Australian plate over fixed or slow-moving sources of magmatism within the mantle predicted by global plate motion reconstructions (Williams et al. Reference Williams, Flament, Müller and Butterworth2015; Mortimer et al. Reference Mortimer, Gans, Meffre, Martin, Seton, Williams, Turnbull, Quilty, Micklethwaite, Timm, Sutherland, Bache, Collot, Maurizot, Rouillard, Sensarma and Storey2018). A peak in Lord Howe chain magmatism in late Oligocene time, also a characteristic of the Tasmantid and onshore trails, may be related to a slowdown in Australian plate motion. A decrease in the volume of material erupted over time towards the present day for the combined trails suggests that the plume(s) associated with these trails is waning, which is also supported by seismic velocity studies. The average flux rate of the Lord Howe Seamount Chain is estimated at 0.4 m3 s−1, similar to rates of crustal production at the older South Rennell Trough, immediately to the north, thus showing a potential genetic relationship to this spreading system. This relationship is further supported by geochemical and Nd isotopic studies that show overlaps in composition between basaltic samples from the South Rennell Trough spreading centre and the purely intraplate Lord Howe Seamount Chain. Our analysis of APM models shows that the global moving hotspot reference frame (Steinberger et al. Reference Steinberger, Sutherland and O’Connell2004) and fixed Pacific hotspot reference frame (Wessel & Kroenke, Reference Wessel and Kroenke2008) best match the bathymetric expression of the Tasmantid and Lord Howe seamount chains. Using these APM models, we predict that plume products related to the hotspot(s) operating in the area may be found in the Coral Sea, including within the Queensland, Louisiade, Kenn and West Torres plateaus, the Mellish Rise and the Rennell Island Ridge. Of the three major age-progressive chains, the Lord Howe remains the least well sampled and analysed in terms of high-quality age and geochemical data. Further sampling and analysis of igneous rocks will help identify the early products of plume-related magmatism, characterize their mantle sources and test the tectonomagmatic model of a spreading ridge converting to an intraplate volcanic seamount chain.
Author ORCIDs
Maria Seton 0000-0001-8541-1367
Acknowledgements
We would like to thank the captain, crew and scientific party on board the RV Southern Surveyor for contributing to the success of the voyage; the Marine National Facility (MNF) for funding time on the research vessel and Geoscience Australia, DIMENC, ADECAL and Agence des Aires Marines Protégées for their additional support. We gratefully acknowledge funding from the Australian Research Council through grants FT130101564 (MS), DP180102280 (SEW) and IH130200012 (SEW and SZ), support from the Alfred P Sloan Foundation through grant G-2017-9997 (SZ) and support from the New Zealand Government through core funding to GNS Science (NM). Rhodri Davies is thanked for providing shapefiles of the onshore volcanic provinces. Ben Cohen, Neville Exon and an anonymous reviewer are thanked for their comments, which have improved the manuscript.