




No CrossRef data available.
Article contents
Investigating antigenic variation and other parasite–host interactions in Plasmodium falciparum infections in naïve hosts
Published online by Cambridge University Press: 16 April 2004
Abstract
Mathematical models of the in-host dynamics of malaria infections provide a valuable tool to explore aspects of the host–parasite interaction that are not possible to investigate experimentally. This paper presents predictions of several important parameter values for 2 parasite strains/groups: parasite PfEMP1 switching rates, dynamics of host anti-PfEMP1 antibodies and parameters related to specific and non-specific host immune responses. A stochastic simulation model of the in-host dynamics of Plasmodium falciparum infections in naïve hosts was used to make these predictions. This model incorporates a novel process to simulate antigenic variation by the parasite, and specific and non-specific immune responses by the host. Comparison of model output to a range of published statistics indicated that the model is capable of reproducing the features of clinical P. falciparum infections, including the characteristic recrudescent behaviour. Using the model, we explored the hypothesized switching mechanism of a fast overall rate of antigenic variation early in an infection and found that it is compatible with chronic infections when the var genes are split into 2 groups; fast and slow switching.
Information
- Type
- Research Article
- Information
- Copyright
- © 2004 Cambridge University Press
INTRODUCTION
Plasmodium falciparum malaria contributes to high morbidity and mortality in many regions of the world. Parasite antigenic variation has been flagged as an important component of the parasite's survival strategy (Borst et al. 1995), and also an important aspect in acquired immunity (Bull et al. 1998). P. falciparum erythrocyte membrane protein 1 (PfEMP1), a protein encoded by the var genes, is thought to be a major contributor to antigenic variation (Craig & Scherf, 2001), and possibly responsible for some of the severe disease complications such as cerebral malaria (Smith et al. 2000) and placental malaria (Andrews & Lanzer, 2002).
In recent years technological advances have provided opportunities to learn more about the P. falciparum parasite, and its interactions with human hosts. However, many aspects of the disease process are still not well understood. This is particularly true for the process of antigenic variation where details about the switching mechanism and rates, and the kinetics of the antibodies generated by the host, still elude us. Many of these issues are currently extremely difficult to investigate by laboratory or epidemiological means, and it is in these areas that the use of mathematical models becomes invaluable.
Several mathematical models have been proposed to explore the complex interaction between human host and malaria parasite (reviewed by Molineaux & Dietz, 1999). However, only two recent mathematical models have incorporated antigenic variation, or more precisely variation in PfEMP1 (Molineaux et al. 2001; Paget-McNicol et al. 2002). The model by Molineaux et al. (2001) contributes to our understanding of the interactions between different immune responses and the influence each of these has on parasite density. However, the process of antigenic variation and, in particular, the probability of a variant switching on, is assumed to depend on the host's variant-specific immune response, such that in the absence of a variant-specific immune response, only a small subset of variants have a high chance of being expressed. This contradicts both in vivo data obtained from naïve volunteers (Peters et al. 2002), and in vitro data where many variants can be expressed in the absence of immune pressure (Duffy et al. 2002; Noviyanti et al. 2001).
Paget-McNicol et al. (2002) developed a model to explore PfEMP1 switching, and their conclusions provide important information about possible switching mechanisms and rates, along with the role that various immune responses play in the development of a chronic infection. However, some of the parameters in the model, such as the parasite density required to trigger a non-specific immune response, were assumed constant, ignoring the large degree of variation seen within individual hosts. Additionally, the output from the model was never rigorously compared to statistics from clinical infections.
While both of these models incorporate better biological representations of the parasites than previous mathematical models, the predictions of parameters related to PfEMP1 switching, and the corresponding host response, are highly sensitive to the assumptions made about the parasite biology. Only when the parasite biology is adequately represented can the parameters predicted be expected to mimic the real process.
In this paper we describe a stochastic simulation model of the in-host dynamics of P. falciparum infections that incorporates features of the parasite and host immune response thought to be important in the disease process. This model is fitted to existing clinical data from chronic P. falciparum infections, resulting in predictions of several parameters of interest such as PfEMP1 switching rates and anti-PfEMP1 antibody kinetics. In the process, the feasibility of a novel PfEMP1 switching mechanism is tested. The biological significance of the different predictions resulting from the model is discussed.
MATERIALS AND METHODS
The model
The stochastic simulation model is an extension of that reported by Paget-McNicol et al. (2002) incorporating parasite antigenic variation and, numerous host immune responses. The main differences between this and the model reported by Paget-McNicol et al. (2002) include changes to the threshold for the non-specific immune (NSI) response, defined antibody kinetics, increasing clonal immunity throughout the infection, and a different switching methodology to produce antigenic variation in PfEMP1.
The model assumes that a host is infected by only 1 sporozoite which, on maturation, releases 40000 genetically identical merozoites into the bloodstream. This constitutes the start of the asexual infection, and from this point on, the model uses a 48 h time-step in line with the parasite erythrocytic replication cycle. Parasites are assumed to replicate at a fixed rate of 16 merozoites per schizont, and the infection is assumed to cease when the number of parasites decreases below 1. A blood volume of 5 l is assumed in the conversion from total parasite load to parasite density. A flowchart describing the steps in the model, along with relevant equations, is given in Fig. 1.

Fig. 1. Flowchart of simulation model. Parameters that were estimated during the fitting process are indicated in bold. Bi(a,b) represents the use of a binomial distribution with sample size a and probability b. Where a is large (>100 000), a normal distribution is used. N(a,b) represents the use of a normal distribution with mean a and standard deviation b.
To mimic the process of antigenic variation in PfEMP1, the model assumes that each parasite has a repertoire of 50 var genes. The model incorporates the switching process recently hypothesized by Gatton et al. (2003); that var genes fall into 2 distinct categories, fast switching and slow switching, with an overall switch rate of ~18% per generation in the early stages of the infection. To implement this switching process it is assumed that (a) all parasites express the same var gene when released from the liver, (b) once parasites switch away from this initial var gene they are unable to switch back to it, and (c) the switch rates for all individual var genes are pre-determined (Fig. 1).
The development of antibodies against PfEMP1 commences after the number of parasites expressing a particular PfEMP1 phenotype reaches a threshold (assumed to be 12 parasites/μl). The antibodies become active 7 days after they are triggered. An exponential function is used to describe the ‘amount’ of anti-PfEMP1 antibody in the host, with the magnitude of the antibody response being dependent on whether the specific antibody has been previously produced. The model allows for limited cross-reactivity between the anti-PfEMP1 antibodies such that any specific antibody generated against one PfEMP1 type kills approximately 5% of parasites expressing other PfEMP1 phenotypes (Fig. 1).
The combined effect of other immune responses including cell-mediated immunity, and humoral immune responses directed against clonally conserved surface antigens of a parasite line (e.g. AMA1, MSP1), are included in the model. These various immune responses are referred to as clonal immunity and are implemented by reducing the probability of a merozoite reinvading and surviving to maturity. This acts to reduce the overall growth rate. The development of this response is assumed to be dependent on the duration of the infection instead of parasite density, since some cell-mediated immune responses appear to develop at very low parasite densities (Pombo et al. 2002). However, the sigmodial shape of the function describing mt (Fig. 1) provides a rapidly increasing response after the primary parasite peak, corresponding to the development of progressively more components of the immune response; components that could be triggered by parasite density.
A non-specific immune (NSI) response, which usually presents clinically as a fever, is important for most naïve hosts to control a P. falciparum infection (Molineaux et al. 2001; Paget-McNicol et al. 2002). The effect of the NSI response is controlled by 2 factors, the level of parasitaemia triggering the immune response (T), and the sensitivity of the parasites to the response (k). While there is no information regarding the parasitaemia required to trigger the NSI, data describing the pyrogenic threshold in P. falciparum infections is available (Gatton & Cheng, 2002). It has been noted that the pyrogenic threshold is specific for the infecting parasite strain, increases during an infection in malaria-naïve hosts, and is highly variable between individuals (Jeffery et al. 1959; Gatton & Cheng, 2002). It is also assumed that the pyrogenic threshold is higher than T since the host appears to elicit a NSI response prior to the development of a clinically defined fever (Gatton & Cheng, 2002). To incorporate these observations, a two-piece linear representation with coefficients based on the pyrogenic threshold for the McLendon strain of P. falciparum is used to represent the number of parasites required to trigger a NSI response (Fig. 1).
Simulations of the model were conducted by implementing the steps outlined in Fig. 1. A random number generator was used to assign values to variables defined by binomial or normal distributions. In all circumstances, new random numbers were generated each time the equations were implemented. Output from the model included the total parasitaemia, the number of parasites expressing each PfEMP1 variant and the magnitude of the NSI response (if any) for each day, as well as summary variables such as the number of PfEMP1 types expressed, the length of infection and the number of recrudescences.
Fitting of the model using clinical data
The model required that 6 parameters be fitted; 1 to define the switching probabilities (c), 2 to define the NSI response (SF and k), 1 to define the strength of the specific immunity at the start of the infection (m0), and 2 to define the kinetics of the anti-PfEMP1 antibodies (α and ψ) (Fig. 1). A subset of the data reported by Collins & Jeffery (1999a) for P. falciparum infections in naïve patients was used to achieve this fit. Patient data were selected for inclusion if they received no treatment to modify the primary parasitaemia, and no curative or subcurative treatment after the primary attack. Data for a total of 90 patients were included with 56, 5 and 29 patients being infected with the McLendon, El Limon and Santee Cooper parasite strains respectively. The maximum parasitaemia, the number of days of fever [ges ]104 °F (40 °C), and the number of days with patent ([ges ]10/μl) asexual parasitaemia and parasitaemia [ges ]10000/μl were estimated for each patient. The Kruskal–Wallis test was used to compare the distribution functions of these 4 variables between the infecting strains.
The model was fitted to the patient data using sets of 100 simulations. An optimal fit was achieved by systematically altering the 6 parameters in the model (c, SF, k, m0, α and ψ) until the distribution of simulations did not differ significantly to that of the patient data for any of the 4 variables considered. The Mann–Whitney test was used for this comparison with significance being defined by P<0·05. When a set of parameters met the criteria, several sets of 100 simulations were produced to ensure that the model output continually represented the distributions of the clinical variables. If several different sets of parameter values met the above criteria, the parameters producing output that best represented the median and range of the clinical variables were selected. Since the NSI response produced by the model is not directly equivalent to body temperature, a response in which k(Xt−T)/T[ges ]2 was assumed to correspond to a temperature [ges ]104 °F (40 °C).
A sensitivity analysis of each of the fitted parameters was conducted by determining the range of values the parameter of interest could take before any of the 4 output variables started to differ significantly from the clinical data. During this analysis, all other parameters were assigned their optimal value. To be declared significantly different from the clinical data, at least 1 of the 4 output variables had to differ at the 0·05 significance level, and this variable had to be significantly different (in the same direction) for all simulations conducted with more extreme values of the parameter.
Testing the model output against additional clinical statistics
Once an optimal fit was obtained, a simulation set of the same size as the patient data set was produced (that is, n=56 for McLendon strain, and n=34 for El Limon and Santee Cooper strains). The characteristics of these simulations were reported using 8 different statistics (summarized in Table 2). These values were used as a means of reporting model output not considered at all during the fitting process.
RESULTS
Clinical data profiles of the patients
Significant differences between the population distributions of the inoculating strains were detected for 3 of the 4 variables considered (maximum parasitaemia, the number of days with asexual parasitaemia [ges ]10/μl and number of days with asexual parasitaemia [ges ]10000/μl; P<0·05). Multiple comparisons indicated that patients infected with the McLendon strain had significantly lower maximum parasitaemia than patients infected with the Santee Cooper strain (median of 26550/μl vs. 33720/μl for McLendon and Santee Cooper respectively; P<0·01), and also fewer days of patent parasitaemia and parasitaemia >10000/μl than patients infected with either the Santee Cooper or El Limon strains (median of 89 days patent parasitaemia for the McLendon strain vs. 125.5 days for the Santee Cooper/El Limon strains, P<0·01; median of 3 days with parasitaemia >10000/μl for the McLendon strain compared to 5.5 days for the Santee Cooper/El Limon strains, P<0·05). Thus, in general, the McLendon strain appeared to differ from the El Limon and Santee Cooper strains for the variables considered. This observation resulted in the patient data being aggregated into 2 groups: those patients infected with the McLendon strain (n=56), and those infected with either the El Limon or Santee Cooper strains (n=34). The model was fitted to each of the 2 data sets independently.
Simulation outcomes fit clinical data from the patients
Table 1 lists the parameters that were estimated during the fitting process, along with the optimal values, and sensitivity for each of the data sets. Although the stochastic nature of the model means that each set of simulations produces different output, none of the simulated data sets differed significantly from the clinical data using these optimal values (P>0·05). An example of the simulated infections for each infecting strain is illustrated in Fig. 2. These examples are illustrative of the features of the simulated infections, and were selected at random. Table 2 contains several summary statistics calculated from simulations using the optimal parameter values presented in Table 1.

Fig. 2. Samples of simulated infections with (A) El Limon or Santee Cooper strain, and (B) McLendon strain using the optimal parameter values displayed in Table 1. The upper panel of each plot represents the simulated parasite density over time (solid line), along with the NSI response (dashed line). The middle panel illustrates the number of PfEMP1 variants expressed at levels >10 parasites/μl. The black bars indicate the fast switching PfEMP1 phenotypes, while the white bars represent the slower switching variants. The bottom panel illustrates the dynamics of the PfEMP1 variants that comprise at least 30% of the total parasitaemia at some point during the infection. Typically, when a high number of variants is expressed at a particular time (middle panel), the number of variants reaching the 30% criteria is reduced (lower panel).
Table 1. Model parameters that were fitted using clinical data, along with the ‘optimal values’ and their sensitivity, for the parasite strains considered (Sensitivity values represent the range that the parameter can have before the model output starts to differ significantly (P<0·05) from the clinical data, with all other parameters being maintained at their optimal values. Superscripts indicate the clinical variable first to become significantly different from the clinical data: anumber of days with parasitaemia >10/μl; bnumber of days with severe fever; cmaximum parasitaemia; dnumber of days with parasitaemia >10000/μl.)

Table 2. Statistics summarizing the output from simulations of the El Limon and Santee Cooper strains, and the McLendon strain (Range (and median) is reported for each statistic. A local maximum is defined if the parasitaemia is higher than the parasitaemia on the preceding 6 days and the following 6 days.)

During the sensitivity analysis, the clinical variable most affected by a change in the specified parameter differed for different parameters, and often also between an increase and decrease of the same parameter (Table 1). It should be noted that although one clinical variable is indicated as changing, this variable was the first to reach statistical significance but was not usually the only variable affected. In general, several of the clinical variables were altered by changes in a single parameter value.
Dynamics of fever and parasitaemia during infections
For the simulations of the El Limon and Santee Cooper strain, almost all of the severe fevers (98%) occurred during the first 50 days of infection, with the majority of occurrences (74%) being in the first 25 days. Instances of high parasitaemia (>10000/μl) followed a similar pattern with 53% and 40% of occurrences being in the first and second 25 days post-infection respectively. However, the prevalence of parasitaemia >1000/μl was more evenly distributed over the first 75 days of infection.
The simulations of the McLendon strain differed from those of the El Limon and Santee Cooper strains with severe fever and high parasitaemia being concentrated earlier in the infection. Ninety percent of severe fevers and 96% of days with high parasitaemia (>10000/μl) occurred in the first 25 days of infection. Instances in which the parasitaemia exceeded 1000/μl were also concentrated earlier in the infection with over half of occurrences (53%) in the first 25 days.
PfEMP1 types, their switching rates and recrudescences
During simulated infections with the El Limon and Santee Coopers strains, an average of 42·4 PfEMP1 phenotypes (range: 24–48; median: 44) were expressed causing, on average, 40·9 anti-PfEMP1 antibodies (range: 10–48; median: 44) to be produced. The switching rates of the individual PfEMP1 phenotypes varied from 0·6 to 4·6% for the 10 fast switching var genes, and from 8·8×10−11 to 5·6×10−8% for the slow switching group. As illustrated in Fig. 2, the PfEMP1 phenotypes corresponding to the fast switching var genes appeared during the acute stage of infection, followed by the slower switching phenotypes. Late in the infection, some of the faster switching genes started to reappear as the antibody levels waned. Eighty-two percent of simulations recrudesced with the number of recrudescences during an infection varying from 0 to 16 (mean=6·7; median=5).
In the simulations of the McLendon strain, an average of 32·1 PfEMP1 phenotypes (range: 20–38; median: 33) were expressed by the parasites, resulting in an average of 31·2 anti-PfEMP1 antibodies (range: 19–38; median: 32) being produced. The switching rates of individual PfEMP1 phenotypes ranged from 0·05 to 4·2% for the 19 fast switching var genes, and from 3·4×10−11 to 4·8×10−9% for the slow switching var genes. Generally all the PfEMP1 phenotypes representing the fast switching var genes appeared in the first wave of parasitaemia (Fig. 2). The number of recrudescences during an infection varied from 0 to 11, with 84% of simulations having at least 1 recrudescence (mean number of recrudescences=3·5; median=3).
Recrudescence patterns
Simulations for both strain groups shared common features with regard to parasite recrudescences. As the number of recrudescences increased, the peak parasitaemia associated with each recrudescence decreased, as did the number of fever occurrences and the number of days with high parasitaemia (Fig. 2). Recrudescences were generally of shorter duration than the primary infection, with the period of subpatent parasitaemia between recrudescences increasing with the number of recrudescences.
Dynamics of anti-PfEMP1 antibody during infections
In the model, the level of antibody specific for a PfEMP1 phenotype increases rapidly to an average peak of 141 (reached ~23 days after antibody starts being produced) and 199 units (reached ~25 days after antibody starts being produced) for the El Limon and Santee Cooper strains, and the McLendon strain respectively (Fig. 3). Although the mean peak antibody level is higher for the McLendon strain compared to the other 2 strains, the distributions provide for considerable overlap (Fig. 3). The half-life of the anti-PfEMP1 antibodies ranged from 18 to 40 days.

Fig. 3. The kinetics of individual anti-PfEMP1 antibody levels. The central 95% of the distribution describing the simulated antibody kinetics for the McLendon parasite strain (light grey and dark grey) and El Limon and Santee Cooper parasite strains (grey and dark grey). The region of overlap in the distributions is illustrated in dark grey. Both distributions were generated by using the optimal values for α and ψ presented in Table 1. The dashed lines represent the median of each the distribution.
DISCUSSION
The development of a biologically plausible mathematical model that can replicate the main characteristics of a P. falciparum infection is of paramount importance as the use of such models can help investigate aspects of the host–parasite interaction currently not possible using laboratory techniques. Here we describe an expanded version of a previously published simulation model and fit this model to clinical data originating from the malaria therapy of neurosyphilis patients. As a result of this fitting process, predictions of important host and parasite parameters have been made.
Fitting the model to clinical data for naïve, untreated hosts indicated that suitable matches with 4 clinical outcomes (maximum parasitaemia, number of days with fever >104 °F, number of days with parasitaemia >10/μl, and number of days with parasitaemia >10000/μl) could be obtained for each parasite strain group considered. The 8 additional statistics calculated from the simulated output for the El Limon/Santee Cooper strains are directly comparable to the clinical statistics reported by Molineaux et al. (2001), since 34 of the 35 clinical cases were infected with these parasite strains. Even though these statistics were not considered at all during the fitting process, the values of the first 5 statistics in Table 2 were in good agreement with the corresponding clinical values (Molineaux et al. 2001), with the median values differing by less than 10%. The remaining 3 statistics indicate that the simulated infections are longer, on average, than the clinical infections, and that the proportion of parasite positive days in the simulations is too low, then too high, in the first and second halves of the infection respectively. Although these differences may represent deficiencies in the model, they may also have resulted from the timing and sensitivity of the microscopical examination of blood films from clinical samples. This is particularly relevant to samples collected during the later stages of infection when the sampling frequency was reduced to 2 or 3 times a week (Collins & Jeffery, 1999a). This reduced sampling frequency, combined with the sequestration of P. falciparum parasites for half of the replication cycle, would make it difficult to detect short recrudescences of low parasitaemia, possibly leading to the under-representation of the proportion of days in the second half of the infection that are parasite positive, and/or the length of the infection. As a consequence, the midpoint of the infection may change, thus affecting the proportion of days with patent parasitaemia in the first half of the infection. Molineaux et al. (2001) calculated an additional statistic, the initial slope of the line between the log parasite densities from the first positive slide to the first local maxima. This statistic was not calculated for the simulated dataset since we believe that the sampling variability associated with the low parasite density typically seen in the first parasite-positive slide makes this statistic unreliable.
The sensitivity of the output to changes in the parameters varied depending on the parameter being considered, with 3 of the 6 parameters sharing no overlap between the 2 strain groups. These parameters influence the var gene switching process and the NSI response, suggesting possible differences in the biology of the parasite strains. The sensitivity analysis also indicated that the model parameters defining var gene switching, and the anti-PfEMP1 antibody response tend to influence the length of the infection, while parameters related to the non-specific and clonal immunity are more closely associated with acute disease indicators such as maximum parasitaemia, number of days with parasitaemia >10000/μl, and number of days with severe fever. An upper bound on the value of α (related to the magnitude of the anti-PfEMP1 response) could not be determined for the McLendon strain since increased antibody levels result in a slower antibody decay, delaying the reappearance of previously expressed variants; something that did not affect any of the 4 variables being considered.
In general, the clinical data indicated that the Santee Cooper and El Limon strains had a longer patent infection and higher peak parasitaemia, but fewer days with fever (>104 °F), than the McLendon P. falciparum strain. This is reflected in the model by a higher NSI threshold, but less severe response to the NSI in the Santee Cooper and El Limon strains, compared to the McLendon strain. These differences in the fitted model parameters for the NSI threshold agree with differences previously detected between the pyrogenic thresholds of the same strains (Gatton & Cheng, 2002).
The initial parasite growth rates predicted by the model fall within the range of 12–15 surviving merozoites/schizont reported for naïve volunteers (Cheng et al. 1997), but are above those rates predicted from the same overall data set (Simpson et al. 2002). We believe that the growth rates predicted by the model better describe parasite replication during the initial stages of an infection than the estimate of 5·5–12·3 fold (Simpson et al. 2002), since the majority of patients (>50%) developed a clinical fever (>104 °F) within the first 7 days of patency (Collins & Jeffery, 1999a); the same time-period used by Simpson et al. (2002) to estimate parasite growth in the absence of an immune response. Assuming that the NSI response causing the fever is detrimental to the parasites, the incorporation of data during or after a fever would be expected to under-estimate the parasite multiplication rate.
The model incorporates a novel var gene switching process to generate antigenic variation in PfEMP1, with a much faster overall switching rate than previous models. However, this fast switch rate only occurs early during the infection, after which slower switching PfEMP1 phenotypes dominate the infection. The success of the model in predicting clinical parameters indicates that such a switching mechanism is capable of replicating the features of clinical infections, and also maintaining chronic infections. This agrees with the results of Paget-McNicol et al. (2002) who concluded that an entire repertoire of fast switching var genes was not compatible with recrudescing chronic infections, but that such infections could be reproduced by a var gene repertoire in which a minority of genes switched at a fast rate, with the remainder switching at a much slower rate.
The number of fast switching var genes predicted by the model (19 for the McLendon strain and 10 for the El Limon/Santee Cooper group) agree with a recent report in which at least 15 var transcripts were detected early in infections with 3D7 (Peters et al. 2002). However, as yet there is no experimental evidence comparing the number of var genes expressed early in an infection, or the switching rates, between different parasite strains. It is possible that the number of fast-switching and slow-switching var genes differ between parasite strains due to differences in selection pressure imposed under various transmission conditions, or recombination during mating of different strains. This may in turn affect the overall switch rates of the parasites.
Although there are currently no experimental data describing the detailed kinetics of anti-PfEMP1 antibodies, the kinetics predicted by the model produce similar estimates of the antibody half-life to that described for Ghanaian infants (Biggar, Collins & Campbell, 1980). Additionally, the relatively short-lived antibodies reflect the characteristics of the IgG3 response initiated by parasite-induced erythrocyte surface antigens, including PfEMP1 (Kinyanjui et al. 2003). Furthermore, the rapid development of antibodies in the model agrees with field data in which an antibody response specific to the infecting parasite was developed before or during the first week of clinical symptoms (Ofori et al. 2002). These same data also support the model's assumption that the parasitaemia required to trigger anti-PfEMP1 antibody is lower than the trigger for the NSI.
The general features of the recrudescences in the simulated infections, such as decreasing peak parasitaemia and increasing time between recrudescences, are characteristic of clinical P. falciparum infections (Collins & Jeffery, 1999b; James, Nicol & Shute, 1932). The rapid loss of clinical symptoms as the infection progresses is also well documented. Differences in switching rates for individual var genes, the development of clonal immunity and anti-PfEMP1 antibody kinetics are important determinants in reproducing the characteristic recrudescence patterns. Indeed, the increased length of the Santee Cooper and El Limon simulated infections compared to the McLendon infections can be attributed to the slightly lower peak antibody level obtained, and the corresponding faster decrease in the anti-PfEMP1 antibodies. This decrease in antibody level allows some of the variants expressed early in the infection to recrudesce.
The aim of this work was to describe a revised stochastic simulation model of the in-host dynamics of P. falciparum infections in naïve hosts, and to explore the biological plausibility of the predictions from the model. Fitting the model to available data indicates that the model is capable of replicating the clinical features of P. falciparum infections, suggesting that the novel switching mechanism implemented in the model may be plausible. This fitting process has also enabled the prediction of biologically important factors that are otherwise difficult to obtain. These include the number of PfEMP1 variants expressed, the dynamics of the PfEMP1 variants, and the kinetics of anti-PfEMP1 antibodies. Some differences in parasite strain virulence have also become evident. The incorporation into the model of various biological factors thought to be important in P. falciparum infections provides the opportunity for its future use to explore complex host–parasite interactions, thereby contributing to a better understanding of the biology and pathology of P. falciparum malaria.
This work was supported by NIH grant #AI47500-03. Dr Gatton is funded by a University of Queensland Postdoctoral Research Fellowship. Thanks go to Laura Martin for her valuable comments on the manuscript, and Allan Saul for his helpful discussions.
References
REFERENCES
ANDREWS, K. T. &
LANZER, M.
(2002).
Maternal malaria: Plasmodium falciparum sequestration in the placenta.
Parasitology Research
88, 715–723.CrossRefGoogle Scholar
BIGGAR, R. J.,
COLLINS, W. E. &
CAMPBELL, C. C.
(1980).
The serological response to primary malaria infection in urban Ghanaian infants.
American Journal of Tropical Medicine and Hygiene
29, 720–724.CrossRefGoogle Scholar
BORST, P.,
BITTER, W.,
McCULLOCH, R.,
VAN LEEUWEN, F. &
RUDENKO, G.
(1995).
Antigenic variation in malaria.
Cell
82, 1–4.CrossRefGoogle Scholar
BULL, P. C.,
LOWE, B. S.,
KORTOK, M.,
MOLYNEUX, C. S.,
NEWBOLD, C. I. &
MARSH, K.
(1998).
Parasite antigens on the infected red cell surface are targets for naturally acquired immunity.
Nature, Medicine
4, 358–360.CrossRefGoogle Scholar
CHENG, Q.,
LAWRENCE, G.,
REED, C.,
STOWERS, A.,
RANFORD-CARTWRIGHT, L.,
CREASEY, A.,
CARTER, R. &
SAUL, A.
(1997).
Measurement of Plasmodium falciparum growth rates in vivo: a test of malaria vaccines.
American Journal of Tropical Medicine and Hygiene
57, 495–500.CrossRefGoogle Scholar
COLLINS, W. E. &
JEFFERY, G. M.
(1999 a).
A retrospective examination of sporozoite- and trophozoite-induced infections with Plasmodium falciparum: development of parasitologic and clinical immunity during primary infection.
American Journal of Tropical Medicine and Hygiene 61 (Suppl.), 4–19.Google Scholar
COLLINS, W. E. &
JEFFERY, G. M.
(1999 b).
A retrospective examination of the patterns of recrudescence in patients infected with Plasmodium falciparum.
American Journal of Tropical Medicine and Hygiene 61 (Suppl.), 44–48.Google Scholar
CRAIG, A. &
SCHERF, A.
(2001).
Molecules on the surface of the Plasmodium falciparum infected erythrocyte and their role in malaria pathogenesis and immune evasion.
Molecular and Biochemical Parasitology
115, 129–143.CrossRefGoogle Scholar
DUFFY, M. F.,
BROWN, G. V.,
BASUKI, W.,
KREJANY, E. O.,
NOVIYANTI, R.,
COWMAN, A. F. &
REEDER, J. C.
(2002).
Transcription of multiple var genes by individual, trophozoite-stage Plasmodium falciparum cells expressing a chondroitin sulphate A binding phenotype.
Molecular Microbiology
43, 1285–1293.CrossRefGoogle Scholar
GATTON, M. L. &
CHENG, Q.
(2002).
Evaluation of the pyrogenic threshold for P. falciparum in naïve individuals.
American Journal of Tropical Medicine and Hygiene
66, 467–473.CrossRefGoogle Scholar
GATTON, M. L.,
PETERS, J.,
FOWLER, E. &
CHENG, Q.
(2003).
Switching rates of Plasmodium falciparum var genes: faster than we thought?
Trends in Parasitology
19, 202–208.Google Scholar
JAMES, S. P.,
NICOL, W. D. &
SHUTE, P. G.
(1932).
A study of induced malignant tertian malaria.
Proceedings of the Royal Society of Medicine
25, 1153–1186.Google Scholar
JEFFERY, G. M.,
YOUNG, M. D.,
BURGESS, R. W. &
EYLES, D. E.
(1959).
Early activity in sporozoite-induced Plasmodium falciparum infections.
Annals of Tropical Medicine and Parasitology
53, 51–58.CrossRefGoogle Scholar
KINYANJUI, S.,
BULL, P. B.,
NEWBOLD, C. I. &
MARSH, K.
(2003).
Kinetics of antibody responses to Plasmodium falciparum-infected erythrocyte variant surface antigens.
Journal of Infectious Diseases
187, 667–674.CrossRefGoogle Scholar
MOLINEAUX, L. &
DIETZ, K.
(1999).
Review of intra-host models of malaria.
Parassitologia
41, 221–231.Google Scholar
MOLINEAUX, L.,
DIEBNER, H. H.,
EICHNER, M.,
COLLINS, W. E.,
JEFFERY, G. M. &
DIETZ, K.
(2001).
Plasmodium falciparum parasitaemia described by a new mathematical model.
Parasitology
122, 379–391.CrossRefGoogle Scholar
NOVIYANTI, R.,
BROWN, G. V.,
WICKHAM, M. E.,
DUFFY, M. F.,
COWMAN, A. F. &
REEDER, J. C.
(2001).
Multiple var gene transcripts are expressed in Plasmodium falciparum infected erythrocytes selected for adhesion.
Molecular and Biochemical Parasitology
114, 227–237.CrossRefGoogle Scholar
OFORI, M. F.,
DODOO, D.,
STAALSOE, T.,
KURTZHALS, J. A. L.,
KORAM, K.,
THEANDER, T. G.,
AKANMORI, B. D. &
HVIID, L.
(2002).
Malaria-induced acquisition of antibodies to Plasmodium falciparum variant surface antigens.
Infection and Immunity
70, 2982–2988.CrossRefGoogle Scholar
PAGET-McNICOL, S.,
GATTON, M.,
HASTINGS, I. &
SAUL, A.
(2002).
The Plasmodium falciparum var gene switching rate, switching mechanism and patterns of parasite recrudescence described by mathematical modelling.
Parasitology
124, 225–235.Google Scholar
PETERS, J.,
FOWLER, E.,
GATTON, M.,
CHEN, N.,
SAUL, A. &
CHENG, Q.
(2002).
High diversity and rapid changeover of expressed var genes during acute phase of Plasmodium falciparum infections in human volunteers.
Proceedings of the National Academy of Sciences, USA
99, 10689–10694.CrossRefGoogle Scholar
POMBO, D. J.,
LAWRENCE, G.,
HIRUNPETCHARAT, C.,
RZEPCZK, C.,
BRYDEN, M.,
CLOONAN, N.,
ANDERSON, K.,
MAHAKUNKIJCHAROEN, Y.,
MARTIN, L. B.,
WILSON, D.,
ELLIOTT, S.,
ELLIOTT, S.,
EISEN, D. P.,
WEINBERG, J. B.,
SAUL, A. &
GOOD, M. F.
(2002).
Immunity to malaria after administration of ultra-low doses of red cells infected with Plasmodium falciparum.
Lancet
360, 610–617.CrossRefGoogle Scholar
SIMPSON, J. A.,
AARONS, L.,
COLLINS, W. E.,
JEFFERY, G. M. &
WHITE, N. J.
(2002).
Population dynamics of untreated Plasmodium falciparum malaria within the adult human host during the expansion phase of the infection.
Parasitology
124, 247–263.CrossRefGoogle Scholar
SMITH, J. D.,
CRAIG, A. G.,
KRIEK, N.,
HUDSON-TAYLOR, D.,
KYES, S.,
FAGEN, T.,
PINCHES, R.,
BARUCH, D. I.,
NEWBOLD, C. I. &
MILLER, L. H.
(2000).
Identification of a Plasmodium falciparum intercellular adhesion molecule-1 binding domain: a parasite adhesion trait implicated in cerebral malaria.
Proceedings of the National Academy of Sciences, USA 97, 1766–1771.CrossRefGoogle Scholar
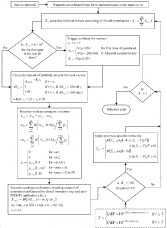
Fig. 1. Flowchart of simulation model. Parameters that were estimated during the fitting process are indicated in bold. Bi(a,b) represents the use of a binomial distribution with sample size a and probability b. Where a is large (>100 000), a normal distribution is used. N(a,b) represents the use of a normal distribution with mean a and standard deviation b.
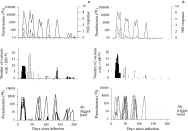
Fig. 2. Samples of simulated infections with (A) El Limon or Santee Cooper strain, and (B) McLendon strain using the optimal parameter values displayed in Table 1. The upper panel of each plot represents the simulated parasite density over time (solid line), along with the NSI response (dashed line). The middle panel illustrates the number of PfEMP1 variants expressed at levels >10 parasites/μl. The black bars indicate the fast switching PfEMP1 phenotypes, while the white bars represent the slower switching variants. The bottom panel illustrates the dynamics of the PfEMP1 variants that comprise at least 30% of the total parasitaemia at some point during the infection. Typically, when a high number of variants is expressed at a particular time (middle panel), the number of variants reaching the 30% criteria is reduced (lower panel).
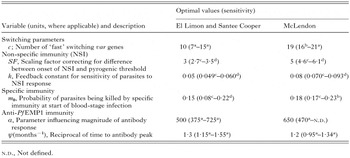
Table 1. Model parameters that were fitted using clinical data, along with the ‘optimal values’ and their sensitivity, for the parasite strains considered
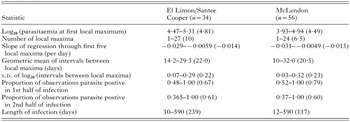
Table 2. Statistics summarizing the output from simulations of the El Limon and Santee Cooper strains, and the McLendon strain
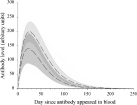
Fig. 3. The kinetics of individual anti-PfEMP1 antibody levels. The central 95% of the distribution describing the simulated antibody kinetics for the McLendon parasite strain (light grey and dark grey) and El Limon and Santee Cooper parasite strains (grey and dark grey). The region of overlap in the distributions is illustrated in dark grey. Both distributions were generated by using the optimal values for α and ψ presented in Table 1. The dashed lines represent the median of each the distribution.
 You have
Access
- 21
- Cited by