

Introduction
The informatics revolution offered solutions in many areas of agricultural production worldwide. The decision-making process is supported by huge amounts of data collected by a variety of sensors and electronic devices, providing a better approach to understanding processes within the production environment. As new opportunities arise a part of the research can essentially be done by machine learning. Machine learning is defined as the field of science that promotes machines’ ability to learn without exact programming through learning past behaviours and rules from old data (Cihan, 2017). Machine learning is already part of many scientific interests, such as medicine (Kang et al., Reference KANG, SCHWARTZ, FLICKINGER and BERIWAL2015; Zhang et al., Reference ZHANG, HE, OUYANG, GU, DONG, ZHANG, MO, HUANG, TIAN and ZHANG2017; Maksimović et al., Reference MAKSIMOVIĆ, JOVIĆ, JOVANOVIĆ and ANICIC2016), meteorology (Cramer et al., Reference CRAMER, KAMPOURIDIS, FREITAS and ALEXANDRIDIS2017; Rhee and Im, Reference RHEE and IM2017; Aybar et al., Reference AYBAR, JIMÉNEZ, CORNEJO, CASANOVA, SANZ, SALVADOR and SALCEDO2016), economics (Barboza et al., Reference BARBOZA, KIMURA and ALTMAN2017; Zhao et al., Reference ZHAO, LI and YU2017; Jović et al., Reference JOVIĆ, MAKSIMOVIĆ and JOVOVIĆ2016; Maksimović et al., Reference MAKSIMOVIĆ, JOVIĆ, JOVOVIĆ and JOVOVIĆ2017) and aquaculture (López et al., Reference LÓPEZ, NACHTIGALL, OLATE, ARAYA, OYANEDEL, DIAZ, JAKOB, RÍOS and SANTOS2017; Zhou et al., Reference ZHOU, LIN, XU, CHEN, GUO, SUN and YANG2018). This review aims to introduce machine learning methods used in poultry management systems, and to underline potential improvements in broiler productivity, health and welfare.
An overview on machine learning
Machine learning process can be explained as a computer code where a performance standard is optimised using past data or knowledge. Model needs to be defined with some variables and, through providing data, a computer program is trained to optimise the parameters of the model which could be designed to predict or to describe. Figure 1 contains the machine learning pipeline.
General pipeline of machine learning.

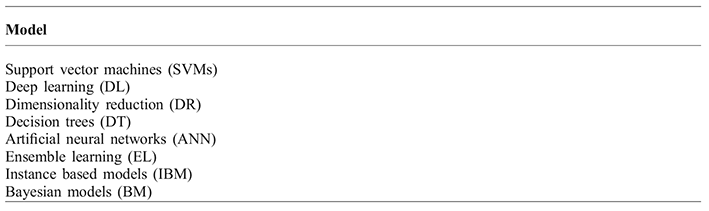
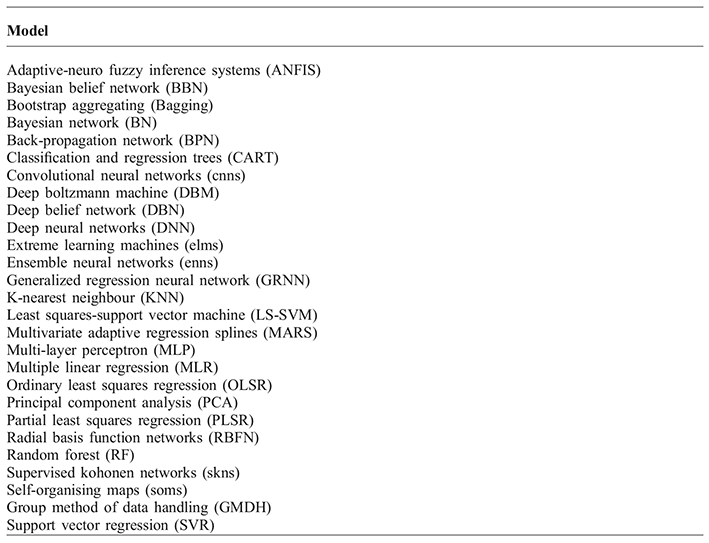
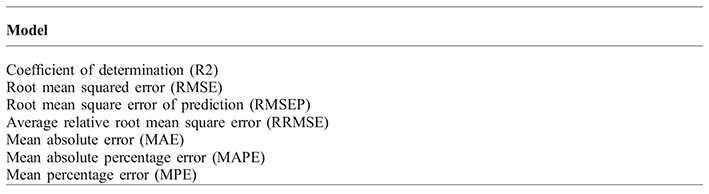
Machine learning, depending on the learning type, can be supervised and unsupervised, with many learning models (Table 1) and learning algorithms (Table 2), which are validated by different statistical measures (Table 3).
Vapnik (Reference VAPNIK1995) was first to describe support vector machines (SVMs) as a binary classifier that creates a linear separating hyper-plane to classify data instances. This model has been used for classification, regression, and clustering, which were the most frequently used algorithms that support vector regression (Smola, Reference SMOLA1996), and least squares that support the vector machine (Suykens et al., Reference SUYKENS, VAN GESTEL, DE BRABANTER, DE MOOR and VANDEWALLE2002). Artificial neural networks are supervised models that are used for regression and classification problems, where the radial basis function networks, back-propagation, perceptron algorithms, and resilient back-propagation, are mostly present in the literature. Deep learning (DL) or deep neural networks belong to artificial neural networks, but contains several hidden layers between the input and output layers. The convolutional neural network (CNN) is typical representative of deep learning (Goodfellow et al., Reference GOODFELLOW, BENGIO and COURVILLE2016), together with deep Boltzmann machines and deep belief networks (Salakhutdinov, 2009).
Machine learning models.

Machine learning algorithms.

Statistical measures for the validation of machine learning algorithms.

Regression aims to provide the prediction of an output variable according to known input variables. Present algorithms include linear regression and logistic regression, as well as stepwise regression. More complex regression algorithms have been developed, such as ordinary least squares regression, multivariate adaptive regression splines and multiple linear regression. (Friedman, Reference FRIEDMAN1991; Quinlan, Reference QUINLAN1992; Craven and Islam, Reference CRAVEN and ISLAM2011).
Decision trees are the primary learner in ensemble models, at first random forest (Breiman, Reference BREIMAN2001), with additional boosting and bagging implementations, such as boosting technique (Schapire, Reference SCHAPIRE1999) and bootstrap aggregating or bagging algorithms are used (Breiman, Reference BREIMAN1996). Bayesian inference is used for solving either classification or regression problems and is a base for probabilistic graphical models under the Bayesian model (Pearl, Reference PEARL1988).
Broiler growth and machine learning
Growth of any living being is a complex, nonlinear dynamic and is not easy to model. Commonly used system identification approaches use linear model structures, which are not able to deal with the nonlinearity present during the entire growth process of broilers. A promising alternative is the soft computing approach and machine learning models and algorithms with the ability to approximate nonlinear functions (Johansen et al., Reference JOHANSEN, BENDTSEN, JENSEN and JESPER2017). Poultry growth is usually modelled using the Gompertz model, using average body weight data over a period of time for a given breed under specific farm management conditions. Regularly implemented selection and genetic changes, nutritional factors and environmental concerns, however, make such models limited in their effectiveness because of the difficulty of fitting the growth curve across time, bird strains and other variables. Furthermore, generating data for every strain of birds under continually changing variables is difficult, time consuming, and expensive (Ahmad, Reference AHMAD2009).
Neural networks offer an alternative to regression analysis for biological growth modelling, which have been experimentally confirmed (Roush et al., Reference ROUSH, DOZIER and BRANTON2006). This research included twenty-five male chicks (Ross × Ross 308) raised in an environmental chamber. Body weights were determined daily and feed and water were provided ad libitum. Average body weights of 18 birds were used as the data points for the growth curve to be modelled. Comparison was made between the modelling by the Gompertz nonlinear regression equation and neural network modelling. Accuracy of the models was determined by mean square error (MSE), mean absolute deviation (MAD), mean absolute percentage error (MAPE), and bias, which showed that the Gompertz equation underestimated the values whereas the neural networks produced little or no overestimation of the observed body weight responses Dynamic control of the growth of broiler chickens has potential benefits for farmers in terms of improved production effectiveness, as well as for animal welfare, e.g. in terms of improved leg health.
Demmers et al. (Reference DEMMERS, CAO, GAUSS, LOWE, PARSONS and WATHES2010) introduced a differential recurrent neural network (DRNN) identified from experimental data to represent broiler chicken growth using a nonlinear system identification algorithm. The DRNN model was used as the internal model for nonlinear model predictive control (NMPC) to achieve a group of desired growth curves. The experimental results demonstrated that the DRNN explained dynamics of the broiler growth process convincingly well. The DRNN based NMPC was able to specify feed intakes in real time so that the broiler weights accurately followed the desired growth curves ranging from −12% to +12% of the standard curve. The overall mean relative error between the desired and achieved broiler weight was 1.8% for the period from day 12 to day 51. Similarly Demmers et al. (Reference DEMMERS, CAO, GAUSS, LOWE, PARSONS and WATHES2018) identified a differential recurrent neural network (DRNN) from experimental data to represent animal growth using a nonlinear system identification algorithm. The DRNN model was then used as the internal model for nonlinear model predictive control (NMPC) to achieve a group of desired growth curves. The experimental results demonstrated that the DRNN model captured the underlying dynamics of the broiler and pig growth process reasonably well. The DRNN based model was able to specify feed intakes in real time, so that the weights accurately followed the desired growth curves ranging from −12% to +12% and −20% to +20% of the standard curve for broiler chickens and pigs, respectively. The overall mean relative error between the desired and achieved broiler or pig weight was 1.8% for the period from day 12 to day 51 and 10.5% for the period from week five to week 21, respectively.
Another study by Johansen et al. (Reference JOHANSEN, BENDTSEN, JENSEN and JESPER2017) investigated neural network forecasting models trained on farm-scale broiler batch production data from 12 batches from the same house. The model forecasted future broiler weight and used environmental conditions such as heating, ventilation, and temperature along with behaviour, such as feed and water consumption. Results indicated that the dynamic interconnection between environmental conditions and broiler growth could be captured by the model. Additionally, neural network model with a back-propagation algorithm successfully found the relationship between the inputs and outputs of feed intake, weight gain and feed conversion ratio variables (Ghazanfari, Reference GHAZANFARI2014). High coefficient of determination (R2) and T values for the ANN model in comparison to linear regression showed that the artificial neural network (ANN) was an efficient method for growth performance prediction in the starter period for broiler chickens.
Three neural networks were used in the research conducted by Ahmad (Reference AHMAD2009), where actual growth data were used to predict broiler growth over the next 50 days. The Back-Propagation-3 neural network gave the best fitting line, with predictions fitting closely to the actual data points. The R2 was 0.998, which clearly supported machine learning models and algorithms for modelling broiler growth in the future and decision-making process at the farm level. This conclusion was supported by a study where 190 artificial intelligencebased models were developed and compared for predicting the body mass of chicks from 2 to 21 d of age subjected to different duration and intensities of thermal challenge (Ferraz et al., Reference FERRAZ, JUNIOR, JULIO, CASTRO, GATES, REIS and CAMPOS2014). The neural networks were most accurate in predicting the body mass of chicks from 2 to 21 d of age after they were subjected to the input variables, and showed an R2 of 0.9993 and a standard error of 4.62 g. The used machine learning model in this study enabled the simulation of different scenarios by changing the level of different inputs, which can be embedded into the heating control systems.
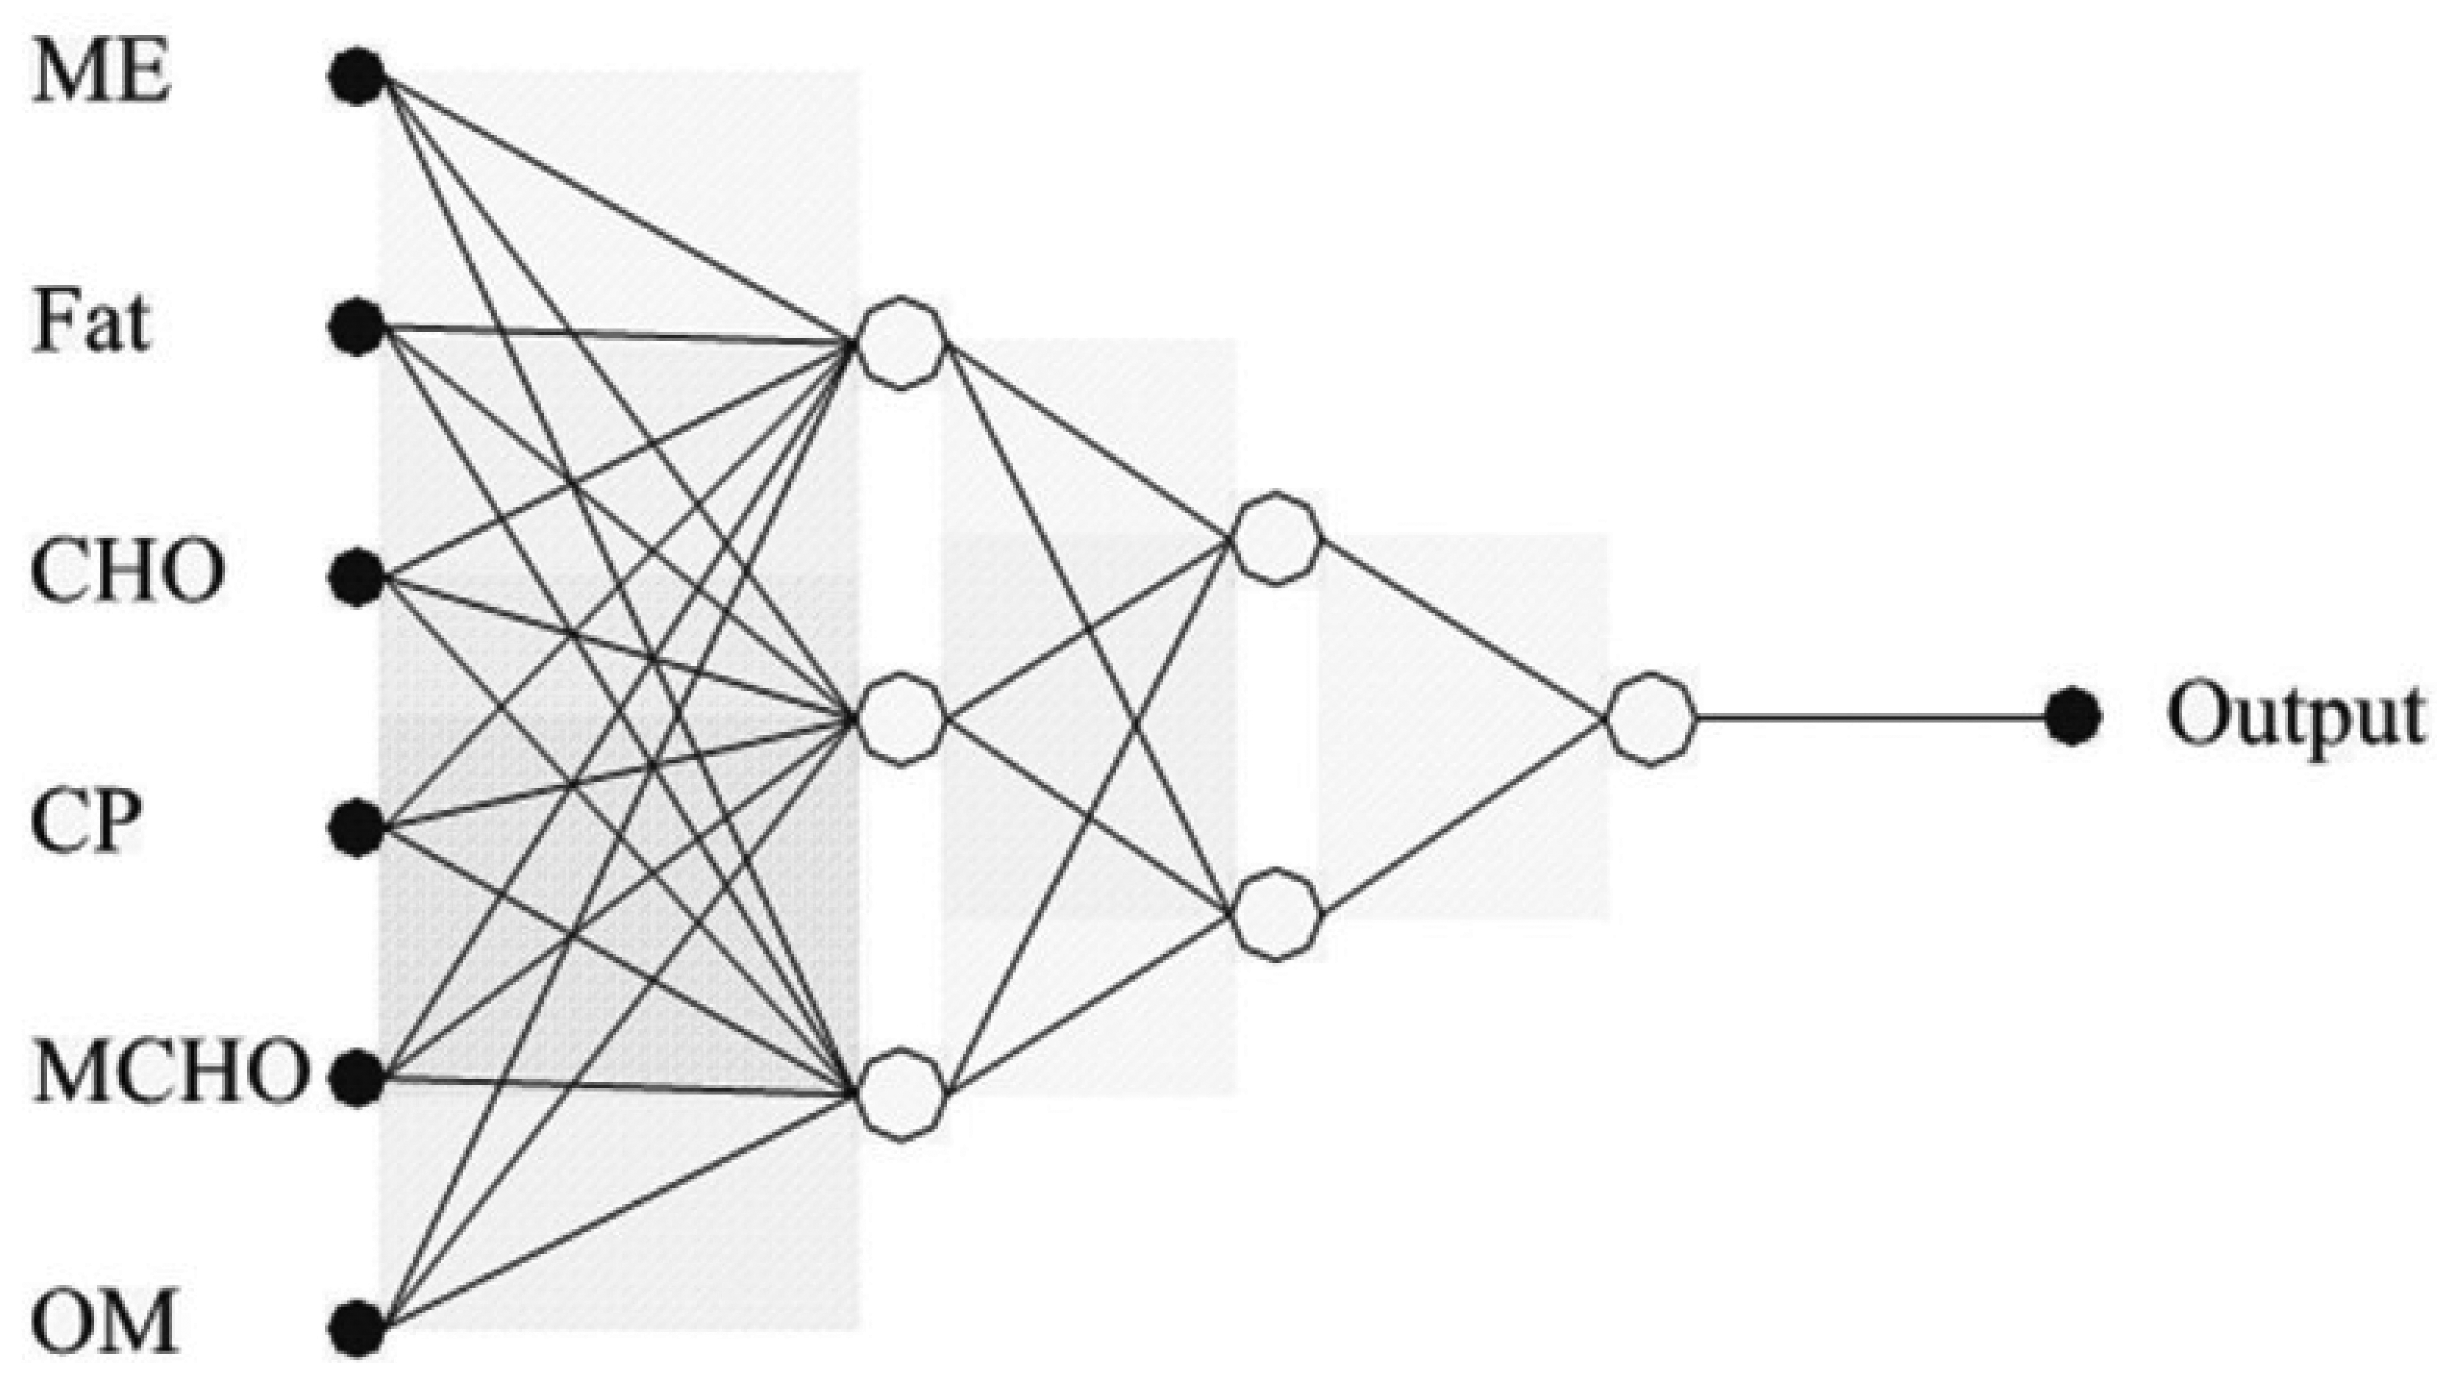
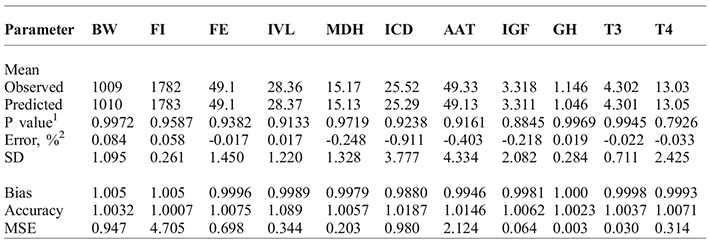
Similar conclusions were given in another study (Moharrery et al., 2007), where a three-layer feed forward artificial neural network was used to predict body weight, plasma hormones and liver enzymes in broiler chickens. Six diet parameters were selected (ME: metabolisable energy in the diet; CHO: carbohydrate, CP: crude protein; MCHO: metabolisable carbohydrate; OM: organic matter; gram intake during growing period) as inputs (predictor) and parameters for the output (Figure 2, Table 4). Birds were fed diets containing different concentration of energy and protein.
Structure of proposed artificial neural network (Moharrery et al., 2007)

The network provided the simulation of the final results with the contribution percentage of each dietary component to the production trait under study. This method allowed the simulation of enzyme patterns in the liver, providing the contribution of plasma hormones from each diet to the broiler physiology variables under study. The network performance obtained in this study was very high (99%), which was acceptable.
Comparison of results for observed and ANNs predicted values (Moharrery et al., 2007).

BW: body weight; FI: feed intake; FE: feed efficiency; IVL: in vitro lipogenesis; MDH: malate dehydrogenase; ICD: isocitrate dehydrogenase; AAT: aspartate aminotransferase; IGF: insulin-like growth factor-I; GH: growth hormone; T3: triiodothyronine; T4: thyroxine. 1 this value showed a statistically significant difference between observed and predicted values. 2 error percentage = (((predicted - observed)/observed)*100). SD: standard deviation of the mean (error). MSE: mean square of the error.
Advances in technology currently provide new interesting combinations of machine learning and electronic equipment in determination of broiler body weight as the main growth indices in production. This combination may replace manual weight measuring, which decreases animal's welfare and increases human involvement and labour costs. Specific combinations of the machine vision and artificial neural networks were used to estimate live body weight of broiler chickens reared for 42 days (Amraei et al., Reference AMRAEI, MEHDIZADEH and SALARI2016). Imaging was performed two times daily and strong correlations between the body weight and five physical extracted features were found. Different ANN techniques, including Bayesian regulation, Levenberg–Marquardt, scaled conjugate gradient and gradient descent were used. Bayesian regulation with an R² value of 0.98 was the best for prediction of broiler weight. Wang et al. (Reference WANG, SUN, LI, JI, ZHANG, WANG, LEI and YANG2017) introduced a three-dimensional camera, which can measure phenotypic features in order to determine broiler weight. Their procedure of image pre-processing consists of image cropping, median filtering, OTSU threshold segmentation and binarisation. During this process, nine features were extracted with a mathematical geometry method, including area, uniformity, width, length, radius, perimeter, volume, back width and age. These nine features were used to construct a back propagation neural network with body weight as an output. Based on these data, the body weight estimation model was established to realise the population weight estimations. The root mean square error (RMSE) was 0.048 kg, mean relative error (MRE) was 3.3%, optimal fitness was 0.994, minimum relative error was 0.5% and the maximum relative error was about 11%. These results showed that the proposed method was feasible and effective for constructing broiler weight estimation models, providing a theoretical basis for estimating broiler growth by using machine vision technology.
Broiler health and machine learning
Poultry diseases are a major source of economic losses to farmers and pose a serious threat for the human population health. Consequently, monitoring and early warning of disease outbreaks are essential in poultry breeding. As previously elaborated, machine learning possesses the ability to cope with nonlinear connection between different variables, which makes its use in broiler health prediction possible. Kirby et al. (Reference KIRBY, MCNEW, KIRBY and WIDEMAN1997), tried to identify broilers with ascites using multiple linear regression and logistic regression. They found that a linear regression model was complex and did not show normally distributed errors, which increased chances of false predictions. On the other hand, a logistic regression model was found to be simple, biologically meaningful and statistically powerful.
Ascites is one of the main sources of economic problems in the broiler industry (Wideman, Reference WIDEMAN1988; Wideman and Bottje, Reference WIDEMAN and BOTTJE1993). Defining physiological factors that categorise broilers with a predisposition to ascites could be helpful in order to eliminate these individuals from the flock. Artificial neural networks were found to effectively identify broilers with and without ascites (Roush et al., Reference ROUSH, KIRBY, CRAVENER and WIDEMAN1996). The model was a three-layer back-propagation neural network with an input layer of 15 physiological variables with an output layer of two factors (the presence or absence of ascites). A comparison was made between laboratory diagnostic results and the neural network predicted ascites incidence, and the neural network accurately (100%) identified the presence or absence of ascites in the training set. Furthermore, probabilistic neural networks based on non-invasive inputs showed acceptable results (Roush et al., Reference ROUSH, CRAVENER, KIRBY and WIDEMAN1997). Inputs were oxygen concentration in the blood, body weight, electrocardiogram, haematocrit, S wave, and heart rate of individual birds. As in the previous study, output was presence or absence of ascites. The conclusion was that the use of models developed with artificial neural networks may enhance the diagnosis of ascites in broilers, and may help developing broiler strains without a propensity for ascites.
If thermal conditions inside a poultry house are beyond the comfort limits, the bird physiologically adapts to maintain normal temperature and focuses only on survival (Medeiros et al., Reference MEDEIROS, BAÊTA, OLIVEIRA, TINÔCO, ALBINO and CECON2005), which leads to lower productivity. The best indicator of heat stress in broiler is their rectal temperature (Campos et al., Reference CAMPOS, CUNHA, PEREIRA, JUNQUEIRA, MARTUSTELLO, PIRES and LIZIEIRE2004; Spiers et al., Reference SPIERS, SPAIN, SAMPSON and RHOADS2004). Hence, research was done with the objective of developing and evaluating artificial neural networks for the prediction of broilers’ rectal temperature in function of thermal conditions air temperature, relative humidity, and air velocity. The selected multilayer perceptron (MLP), achieved excellent results, providing estimates with an average error of 0.78% for the training set and 1.02% for the validation set (Lopes et al., Reference LOPES, JUNIOR, LACERDA and RABELO2014).
Another technique that may have future applications is support vector machines (SVM), a type of machine learning algorithm, used by Hepworth et al. (Reference HEPWORTH, NEFEDOV, MUCHNICK and MORGAN2012), to identify risk factors for hock burn incidence, using recorded data relative to farm management conditions (stocking density, number and age of parent flocks, sex, and rearing system) together with daily water consumption, average weekly weight, mortality, and slaughterhouse outcomes (rejections, downgrades, and hock burns). Results were compared to manually build logistic regression models in order to test SVM. Conclusions were that this technique had great potential to improve poultry health and welfare as it proved robust for a broad range of complex data sets.
Machine vision and learning algorithm applications for broiler disease detection is an effective method to prevent large-scale outbreaks of disease (Zhuang et al., Reference ZHUANG, BI, GUO, WU and ZHANG2018). In this study broilers infected with bird flu virus were placed in isolator cages for obtaining images and extracting features of healthy and sick chickens. These features were analysed by machine learning algorithms and the effect of each feature on the recognition accuracy was obtained. The SVM model obtained an accuracy rate of 99.469% for the test samples, which was superior to those of the other machine learning algorithms. The experimental results showed that the machine learning algorithms could effectively differentiate broilers from the image background, extract the posture information of broilers, and precisely and quickly identify the health status of broilers, which can be used for the smart identification of broiler health status in the future.
Conclusions
This review analysed machine learning application in broiler industry, at particular its’ use in growth and health prediction. It was observed that recent developments in computer science have effectively addressed the problems in broiler industry. Some results are very promising and give an excellent basis for future research, especially in the field of growth modelling, disease detection, and finally, animal welfare improvement.