



1 Introduction
Owing to its significance in understanding the rheology of emulsions (Tucker III & Moldenaers Reference Tucker III and Moldenaers2002; Derkach Reference Derkach2009), the dynamics of individual droplets in viscous flows has received considerable attention in the discipline of fluid mechanics since the pioneering work by Taylor (Reference Taylor1934). A great number of theoretical, numerical and experimental studies have been dedicated to the deformation and breakup of an isolated droplet, which has also been the subject of several reviews (Rallison Reference Rallison1984; Stone Reference Stone1994; Fischer & Erni Reference Fischer and Erni2007; Guido Reference Guido2011). From the mechanical viewpoint, the viscous force from the surrounding flow tends to deform the droplet, while the interfacial force from drop surface plays the opposite role. Accordingly, the deformation degree of the droplet (i.e. the deviation from its initially spherical shape) increases with the capillary number that measures the relative importance of the viscous force to the interfacial force. When the capillary number exceeds a critical value, the droplet deforms continuously until it breaks up.
Many studies are focused on the simplest case, in which the drop surface remains clean and the interfacial force is characterized by a constant surface tension. However, the use of surfactants is often involved in engineering applications, such as production/demulsification of emulsions or drop manipulation in microfluidics (Fischer & Erni Reference Fischer and Erni2007; Derkach Reference Derkach2009; Anna Reference Anna2016). Experimental studies have demonstrated the great effects of surfactants on the deformation and breakup of droplets in shear flows (Phillips, Graves & Flumerfelt Reference Phillips, Graves and Flumerfelt1980; Feigl et al. Reference Feigl, Megias-Alguacil, Fischer and Windhab2007; Vananroye, Van Puyvelde & Moldenaers Reference Vananroye, Van Puyvelde and Moldenaers2011). Besides, many theoretical and numerical studies have been performed to unveil the mechanisms underlying the effects of surfactants (Stone & Leal Reference Stone and Leal1990; Li & Pozrikidis Reference Li and Pozrikidis1997; Vlahovska, Loewenberg & Blawzdziewicz Reference Vlahovska, Loewenberg and Blawzdziewicz2005; Vlahovska, Blawzdziewicz & Loewenberg Reference Vlahovska, Blawzdziewicz and Loewenberg2009; Frijters, Gunther & Harting Reference Frijters, Gunther and Harting2012; Mandal, Ghosh & Chakraborty Reference Mandal, Ghosh and Chakraborty2016). In general, the appearance of surfactants or following an increase of their surface coverage tends to reduce the surface tension and hence enlarge the drop deformation. Besides, the convection of surfactants with the drop surface flow results in their non-uniform distribution on the evolving interface, and hence the surface tension is usually not constant, contrary to the case of clean droplets. For droplets suspended in a simple shear flow, the surfactant accumulates at the drop tips and lowers the surface tension there, which increases the drop deformation. On the other hand, the surfactant is diluted owing to the drop-deformation-induced increase of the drop surface area. This dilution effect tends to increase the surface tension and hence restrain the drop deformation. More importantly, the surface tension gradient induced by the non-uniform surfactant distribution leads to Marangoni stresses along the surface tangent, which hinder the surfactant convection and also produce important effects on the drop dynamics.
Notably, in addition to Marangoni stresses, surfactants confer the drop surface many other rheological properties, among which the surface viscosity is one of the most important parameters (Sagis Reference Sagis2011; Langevin Reference Langevin2014). Recently, experiments have indicated the crucial role of surface viscosity in the breakup of a surfactant-laden droplet (Ponce-Torres et al. Reference Ponce-Torres, Montanero, Herrada, Vega and Vega2017). Several other analytical and numerical studies have examined the effects of surface viscosity on drop deformation in shear flows. Flumerfelt (Reference Flumerfelt1980) obtained an explicit expression for the steady-state deformation of droplets with surface viscosity using small deformation analysis, which was then used to measure the drop surface viscosity by comparing with experimental results (Phillips et al. Reference Phillips, Graves and Flumerfelt1980). Recently, Yu & Zhou (Reference Yu and Zhou2011) extended Flumerfelt’s small deformation analysis to droplets with large deformation using an ellipsoidal shape tensor. Pozrikidis (Reference Pozrikidis1994) studied numerically the effects of surface viscosity on the drop’s transient deformation, but the steady state could not be obtained due to numerical instability. Recently, Gounley et al. (Reference Gounley, Boedec, Jaeger and Leonetti2016) performed a systematic numerical investigation on the influence of surface viscosity on the steady-state characteristics of a droplet in shear flow, considering both small and large deformations of the droplet. To summarize, previous studies have demonstrated that the surface viscosity acts to suppress the drop surface motion, reduce the drop deformation degree and inhibit the drop breakup.
In the studies mentioned above, the surfactant transport along the deforming drop surface is not taken into account and hence both surface tension and surface viscosity remain constant. However, recent experimental studies have shown that the surface viscosity is primarily induced by surfactants, and in fact, the magnitude of the surface viscosity depends strongly on their surface concentration for most surfactants (Kim et al. Reference Kim, Choi, Zasadzinski and Squires2011, Reference Kim, Choi, Zell, Squires and Zasadzinski2013; Hermans & Vermant Reference Hermans and Vermant2014; Samaniuk & Vermant Reference Samaniuk and Vermant2014). More particularly, the surface viscosity may change by orders of magnitude with small changes in surface pressure determined by the local surfactant concentration. Manikantan & Squires (Reference Manikantan and Squires2017) highlighted the dramatic consequences of surface-pressure-dependent surface viscosity on interfacially dominant flows, for example, lubrication flows between two droplets. Similarly, the surface-pressure-dependent surface viscosity is likely to exhibit strong impacts on the dynamics of surfactant-laden droplets in shear flows. These influences are probably not fully revealed by the previous studies with the assumption of constant surface viscosity, because strong interactions are expected between surfactant transport and surface viscous stress. To test this hypothesis, we present systematic simulations on a surfactant-laden droplet in a simple shear flow by taking both surfactant transport and surfactant-concentration-dependent surface viscosity into account. Evidently, our results indicate the significant inhibition of surface viscous stress on surfactant transport. More importantly, we find that a surfactant-concentration-dependent surface viscosity induces non-trivial deviations in drop deformation compared with Gounley et al. (Reference Gounley, Boedec, Jaeger and Leonetti2016) for droplets with a constant surface viscosity but without considering surfactant transport.
2 Methodology
2.1 Problem description and mathematical formulation
As depicted in figure 1, we consider an insoluble surfactant-laden droplet suspended in a simple shear flow. The two fluids (inside and outside the droplet, respectively) are both Newtonian and incompressible with density
 $\unicode[STIX]{x1D70C}$
and viscosity
 $\unicode[STIX]{x1D707}$
. The droplet is initially spherical with radius
 $R$
and is placed at the centre of a cuboid box. It is suddenly subjected to a steady simple shear flow with shear rate
 $\unicode[STIX]{x1D6FE}$
generated by the upper and bottom plates moving in opposite directions but with the same speed. The velocity, vorticity and velocity gradient directions are set as
 $x$
-,
 $y$
- and
 $z$
-axes, respectively. The drop surface is laden with an insoluble surfactant with an initially uniform concentration
 $\unicode[STIX]{x1D6E4}_{0}$
. The surfactant transport (i.e. convection and diffusion) on the deforming drop surface is considered. Thus, the surfactant concentration
 $\unicode[STIX]{x1D6E4}$
usually becomes non-uniform and so does the surface tension
 $\unicode[STIX]{x1D70E}$
(figure 1
b). Marangoni stresses arising from the surface tension gradient are taken into account. In the present study, of special note is the introduction of surfactant-induced surface viscosity to the drop surface mechanics, and the surface viscosity depends strongly on local surfactant concentration on the deforming drop surface.
Problem statement. (a) An isolated droplet is suspended in a simple shear flow generated by the upper and bottom plates moving with the same speed but in opposite directions. (b) The drop surface is laden with an insoluble surfactant, and the surfactant concentration is usually non-uniform over the drop surface owing to convection, diffusion and surface dilution. (c) In particular, the surface viscosity is considered in this study, which depends strongly on the surface concentration of the insoluble surfactant.

The mathematical formulation described here is based on the front-tracking finite-difference method that was developed in our previous studies on the flow dynamics of liquid droplets enclosed by elastic membranes (Luo et al.
Reference Luo, Wang, He, Xu and Bai2013; Luo, He & Bai Reference Luo, He and Bai2015; Luo & Bai Reference Luo and Bai2016, Reference Luo and Bai2018). Via scaling the length by
 $R$
, velocity by
 $\unicode[STIX]{x1D6FE}R$
, time by
 $1/\unicode[STIX]{x1D6FE}$
, pressure by
 $\unicode[STIX]{x1D707}\unicode[STIX]{x1D6FE}$
and interfacial stresses by initial surface tension
 $\unicode[STIX]{x1D70E}_{0}$
, the non-dimensional form of flow governing equations can be given as:
 $$\begin{eqnarray}\displaystyle & \displaystyle \unicode[STIX]{x1D735}\boldsymbol{\cdot }\boldsymbol{u}=0, & \displaystyle\end{eqnarray}$$
 $$\begin{eqnarray}\displaystyle & \displaystyle \frac{\unicode[STIX]{x2202}\boldsymbol{u}}{\unicode[STIX]{x2202}t}+\unicode[STIX]{x1D735}\boldsymbol{\cdot }(\boldsymbol{u}\boldsymbol{u})=-\frac{1}{Re}[\unicode[STIX]{x1D735}p+\unicode[STIX]{x1D735}(\unicode[STIX]{x1D735}\boldsymbol{u}+\unicode[STIX]{x1D735}\boldsymbol{u}^{\text{T}})]+\boldsymbol{f}. & \displaystyle\end{eqnarray}$$
Here,
 $\boldsymbol{u}$
is the velocity vector,
 $t$
is time,
 $p$
is pressure and
 $Re$
is the Reynolds number defined as
 $\unicode[STIX]{x1D70C}\unicode[STIX]{x1D6FE}R^{2}/\unicode[STIX]{x1D707}$
. The body force term
 $\boldsymbol{f}$
results from the interfacial stress
 $\boldsymbol{f}_{s}$
acting only on the drop surface:
 $$\begin{eqnarray}\displaystyle \boldsymbol{f}=\int _{S}\frac{1}{Re}\frac{1}{Ca}\boldsymbol{f}_{s}\unicode[STIX]{x1D6FF}(\boldsymbol{x}-\boldsymbol{x}^{\prime })\,\text{d}S. & & \displaystyle\end{eqnarray}$$
Here,
 $Ca=\unicode[STIX]{x1D707}\unicode[STIX]{x1D6FE}R/\unicode[STIX]{x1D70E}_{0}$
is the capillary number, and
 $\unicode[STIX]{x1D6FF}(\boldsymbol{x}-\boldsymbol{x}^{\prime })$
is the three-dimensional delta function. The Boussinesq–Scriven constitutive law (Scriven Reference Scriven1960) is employed to compute
 $\boldsymbol{f}_{s}$
:
 $$\begin{eqnarray}\displaystyle & \displaystyle \boldsymbol{f}_{s}=\unicode[STIX]{x1D735}_{s}\unicode[STIX]{x1D70E}-2\unicode[STIX]{x1D70E}\unicode[STIX]{x1D705}\boldsymbol{n}+Ca\unicode[STIX]{x1D735}_{s}\boldsymbol{\cdot }\unicode[STIX]{x1D749}_{v}, & \displaystyle\end{eqnarray}$$
 $$\begin{eqnarray}\displaystyle & \displaystyle \unicode[STIX]{x1D749}_{v}=Bq[\unicode[STIX]{x1D64B}\boldsymbol{\cdot }(\unicode[STIX]{x1D735}\boldsymbol{u}_{s}+\unicode[STIX]{x1D735}\boldsymbol{u}_{s}^{\text{T}})\boldsymbol{\cdot }\unicode[STIX]{x1D64B}+(\unicode[STIX]{x1D706}_{ds}-1)\unicode[STIX]{x1D6E9}\unicode[STIX]{x1D64B}]. & \displaystyle\end{eqnarray}$$
Note that all variables here are dimensionless.
 $\unicode[STIX]{x1D705}$
,
 $\boldsymbol{n}$
,
 $\boldsymbol{u}_{s}$
and
 $\unicode[STIX]{x1D6E9}$
are mean curvature, outward unit normal vector, surface velocity vector and surface rate of dilation, respectively;
 $\unicode[STIX]{x1D64B}$
is the surface projection tensor defined as
 $\unicode[STIX]{x1D644}-\boldsymbol{n}\boldsymbol{n}^{\text{T}}$
, where
 $\unicode[STIX]{x1D644}$
is the identity matrix;
 $\unicode[STIX]{x1D706}_{ds}$
is the ratio of dilatational viscosity
 $\unicode[STIX]{x1D707}_{d}$
to shear viscosity
 $\unicode[STIX]{x1D707}_{s}$
of the surfactant-laden drop surface;
 $Bq=\unicode[STIX]{x1D707}_{s}/\unicode[STIX]{x1D707}R$
is the Boussinesq number measuring the relative importance of surface viscous stress to bulk viscous stress. In (2.4), the surface gradient of the surface tension
 $\unicode[STIX]{x1D735}_{s}\unicode[STIX]{x1D70E}$
represents the Marangoni stress, and
 $\unicode[STIX]{x1D749}_{v}$
represents the surface viscous stress.
The transport of the insoluble surfactant on the deforming drop surface is governed by the time-dependent convection–diffusion equation:
 $$\begin{eqnarray}\displaystyle \frac{\unicode[STIX]{x2202}\unicode[STIX]{x1D6E4}}{\unicode[STIX]{x2202}t}+\unicode[STIX]{x1D735}_{s}\boldsymbol{\cdot }(\unicode[STIX]{x1D6E4}u_{s})+\unicode[STIX]{x1D6E4}(\unicode[STIX]{x1D735}_{s}\boldsymbol{\cdot }n)(\boldsymbol{u}\boldsymbol{\cdot }\boldsymbol{n})=\frac{1}{Pe_{s}}\unicode[STIX]{x1D735}_{s}\boldsymbol{\cdot }(\unicode[STIX]{x1D735}_{s}\unicode[STIX]{x1D6E4}). & & \displaystyle\end{eqnarray}$$
Here,
 $\unicode[STIX]{x1D6E4}$
is local surfactant concentration non-dimensionalized by
 $\unicode[STIX]{x1D6E4}_{0}$
;
 $Pe_{s}=\unicode[STIX]{x1D6FE}R^{2}/D_{s}$
is the surface Péclet number measuring the relative importance of convection to diffusion, where
 $D_{s}$
is diffusivity coefficient; note that
 $\unicode[STIX]{x1D735}_{s}=(\unicode[STIX]{x1D644}-\boldsymbol{n}\boldsymbol{n}^{\text{T}})\boldsymbol{\cdot }\unicode[STIX]{x1D735}$
. The surface tension
 $\unicode[STIX]{x1D70E}$
related to local surfactant concentration
 $\unicode[STIX]{x1D6E4}$
in the dimensionless form is given by:
 $$\begin{eqnarray}\displaystyle \unicode[STIX]{x1D70E}=1-\unicode[STIX]{x1D6FD}\unicode[STIX]{x1D6E4}. & & \displaystyle\end{eqnarray}$$
Here,
 $\unicode[STIX]{x1D6FD}=R_{g}T_{g}\unicode[STIX]{x1D6E4}_{0}/\unicode[STIX]{x1D70E}_{c}$
is the elasticity number measuring the sensitivity of surface tension to surfactant concentration variation, where
 $\unicode[STIX]{x1D70E}_{c}$
is the clean surface tension and
 $R_{g}$
and
 $T_{g}$
are the ideal gas constant and absolute temperature, respectively. This linear equation of state is appropriate when the surfactant concentration is much lower than the maximum concentration corresponding to the saturated surface covered by a surfactant monolayer (Li & Pozrikidis Reference Li and Pozrikidis1997). Nevertheless, other nonlinear constitutive equations applicable to non-dilute surfactants can be easily implemented into the front-tracking framework (Muradoglu & Tryggvason Reference Muradoglu and Tryggvason2014). Notably, the linear equation of state (i.e. (2.7)) is used in all our simulations, unless other stated.
In this study, the surface viscosity
 $\unicode[STIX]{x1D707}_{s}$
is considered to be dependent upon surface pressure
 $\unicode[STIX]{x1D6F1}=\unicode[STIX]{x1D70E}_{c}-\unicode[STIX]{x1D70E}(\unicode[STIX]{x1D6E4})$
. In a recent study Ponce-Torres et al. (Reference Ponce-Torres, Montanero, Herrada, Vega and Vega2017) focused on the influence of surface viscosity on drop breakup and a linear relationship between surface viscosity and surfactant concentration is employed for the sake of simplicity. Good agreement between experimental and numerical results is observed, but they also suggested that knowledge of the presumably nonlinear constitutive relationships for surface viscosity is still required. On the other hand, several recent experimental studies have demonstrated that the surface viscosity for some typical surfactants depends on surface pressure exponentially (Kim et al.
Reference Kim, Choi, Zasadzinski and Squires2011, Reference Kim, Choi, Zell, Squires and Zasadzinski2013; Hermans & Vermant Reference Hermans and Vermant2014; Samaniuk & Vermant Reference Samaniuk and Vermant2014). Therefore, in the present study, the exponential dependence (Manikantan & Squires Reference Manikantan and Squires2017) is employed as follows:
 $$\begin{eqnarray}\displaystyle \unicode[STIX]{x1D707}_{s}^{+}(\unicode[STIX]{x1D6F1})=\unicode[STIX]{x1D707}_{s0}\text{e}^{(\unicode[STIX]{x1D6F1}-\unicode[STIX]{x1D6F1}_{0})/\unicode[STIX]{x1D6F1}_{c}}. & & \displaystyle\end{eqnarray}$$
Here, the superscript ‘
 $+$
’ represents a
 $\unicode[STIX]{x1D6F1}$
-thickening surfactant;
 $\unicode[STIX]{x1D707}_{s0}$
is a reference surface viscosity at reference surface pressure
 $\unicode[STIX]{x1D6F1}_{0}$
;
 $\unicode[STIX]{x1D6F1}_{c}$
is a surface-pressure scale over which significant changes in surface viscosity occur. Similarly, the surface viscosity of a
 $\unicode[STIX]{x1D6F1}$
-thinning surfactant is given by:
 $$\begin{eqnarray}\displaystyle \unicode[STIX]{x1D707}_{s}^{-}(\unicode[STIX]{x1D6F1})=\unicode[STIX]{x1D707}_{s0}\text{e}^{-(\unicode[STIX]{x1D6F1}-\unicode[STIX]{x1D6F1}_{0})/\unicode[STIX]{x1D6F1}_{c}}. & & \displaystyle\end{eqnarray}$$
In our present study, the surface viscosity and surface pressure at the initial state with surfactant concentration
 $\unicode[STIX]{x1D6E4}_{0}$
are used as the reference parameters, i.e.
 $\unicode[STIX]{x1D6F1}_{0}=\unicode[STIX]{x1D70E}_{c}-\unicode[STIX]{x1D70E}_{0}$
and
 $\unicode[STIX]{x1D707}_{s0}=\unicode[STIX]{x1D707}_{s}(\unicode[STIX]{x1D6E4}_{0})$
. Following Underhill, Hirsa & Lopez (Reference Underhill, Hirsa and Lopez2017), we use Newtonian form of the constitutive equation (i.e. (2.4) and (2.5)) for the surface mechanics of droplets with
 $\unicode[STIX]{x1D6F1}$
-dependent surfactants, while the surface viscosity is a function of local surfactant concentration. Thus the Boussinesq number
 $Bq$
in equation (2.5) is usually not constant over the deforming drop surface (figure 1
c), but is a function of dimensionless surfactant concentration
 $\unicode[STIX]{x1D6E4}$
:
 $$\begin{eqnarray}\displaystyle Bq=Bq_{0}\text{e}^{\pm \unicode[STIX]{x1D6FD}(\unicode[STIX]{x1D6E4}-1)/\unicode[STIX]{x1D6F1}_{c}^{\ast }}. & & \displaystyle\end{eqnarray}$$
Here,
 $Bq_{0}=\unicode[STIX]{x1D707}_{s0}/\unicode[STIX]{x1D707}R$
is the initial Boussinesq number based on the reference surface viscosity;
 $\unicode[STIX]{x1D6F1}_{c}^{\ast }$
is the ratio of surface-pressure scale
 $\unicode[STIX]{x1D6F1}_{c}$
to clean surface tension
 $\unicode[STIX]{x1D70E}_{c}$
.
2.2 Numerical implementation
The governing equations are solved via a fully three-dimensional front-tracking finite-difference code that is described in detail in our previous studies (Luo et al. Reference Luo, Wang, He, Xu and Bai2013, Reference Luo, He and Bai2015; Luo & Bai Reference Luo and Bai2016, Reference Luo and Bai2018; Luo, Shang & Bai Reference Luo, Shang and Bai2018). Regarding the flow solver (i.e. (2.1) and (2.2)), the velocity and pressure are solved on a collocated uniform Cartesian grid, thus standard central difference schemes are used to discretize spatial derivatives. For temporal discretization, the three-stage RKCN (Runge–Kutta/Crank–Nicholson) four-step projection method proposed by Ni, Komori & Morley (Reference Ni, Komori and Morley2003) is used, in which a three-stage Runge–Kutta technique and Crank–Nicolson semi-implicit technique are used for the convective and diffusion terms, respectively. More details of the flow solver can be found in our recent study of membrane-enclosed viscoelastic droplets in shear flows (Luo & Bai Reference Luo and Bai2018).
For the solution of the surfactant transport equation (i.e. (2.6)), we follow the procedure proposed by Muradoglu & Tryggvason (Reference Muradoglu and Tryggvason2014) and Jesus et al. (Reference Jesus, Roma, Pivello, Villar and da Silveira-Neto2015) in general. In the front-tracking method, the drop surface is discretized into a set of triangular elements (i.e. the Lagrangian grid), thus the surfactant transport equation can be solved using the standard finite-volume scheme. Using the explicit Euler scheme for temporal discretization, the surfactant transport equation is discretized at each triangular element as:
 $$\begin{eqnarray}\displaystyle \frac{(\unicode[STIX]{x1D6E4}_{k}\unicode[STIX]{x0394}A_{k})^{m+1}-(\unicode[STIX]{x1D6E4}_{k}\unicode[STIX]{x0394}A_{k})^{m}}{\unicode[STIX]{x0394}t}=\frac{1}{Pe_{s}}\left(\mathop{\sum }_{i=1}^{3}(\unicode[STIX]{x1D735}_{s}\unicode[STIX]{x1D6E4})_{i}\cdot (t_{i}\times n)\cdot \unicode[STIX]{x0394}l_{i}\right)^{m}. & & \displaystyle\end{eqnarray}$$
Here,
 $m$
is the time step number;
 $\unicode[STIX]{x1D6E4}_{k}$
is surfactant concentration at the
 $k$
th element;
 $\unicode[STIX]{x0394}A_{k}$
and
 $\boldsymbol{n}$
are area and normal vector of the
 $k$
th element;
 $\unicode[STIX]{x0394}l_{i}$
and
 $\boldsymbol{t}_{i}$
are the length and tangential vector of the three edges of the
 $k$
th element, respectively. The surface gradient of surfactant concentration
 $(\unicode[STIX]{x1D735}_{s}\unicode[STIX]{x1D6E4})_{n}$
at the
 $n$
th triangular element is approximated as:
 $$\begin{eqnarray}\displaystyle (\unicode[STIX]{x1D735}_{s}\unicode[STIX]{x1D6E4})_{n}=\frac{1}{4\unicode[STIX]{x0394}A_{n}^{2}}\left\{\begin{array}{@{}l@{}}\unicode[STIX]{x1D6E4}^{i}\left[\begin{array}{@{}l@{}}(x^{i}-x^{j})\cdot (x^{j}-x^{k})(x^{k}-x^{i})+\\ (x^{i}-x^{k})\cdot (x^{k}-x^{j})(x^{j}-x^{i})\end{array}\right]+\\ \unicode[STIX]{x1D6E4}^{j}\left[\begin{array}{@{}l@{}}(x^{j}-x^{k})\cdot (x^{k}-x^{i})(x^{i}-x^{j})+\\ (x^{j}-x^{i})\cdot (x^{i}-x^{k})(x^{k}-x^{j})\end{array}\right]+\\ \unicode[STIX]{x1D6E4}^{k}\left[\begin{array}{@{}l@{}}(x^{k}-x^{i})\cdot (x^{i}-x^{j})(x^{j}-x^{k})+\\ (x^{k}-x^{j})\cdot (x^{j}-x^{i})(x^{i}-x^{k})\end{array}\right]\end{array}\right\}. & & \displaystyle\end{eqnarray}$$
Here,
 $i$
,
 $j$
and
 $k$
represent the three nodes of the
 $n$
th triangular element,
 $\boldsymbol{x}$
is the position vector. Notably, in the front-tracking method, serious stretching and shrinking of the Lagrangian grid may occur due to significant drop deformation and this may lead to the degradation of Lagrangian mesh quality. To solve this issue, we split elements larger than an upper threshold by inserting a point and delete those smaller than a lower threshold by removing a point following the procedure proposed by Tryggvason et al. (Reference Tryggvason, Bunner, Esmaeeli, Juric, Al-Rawahi, Tauber, Han, Nas and Jan2001). Notably, special treatment of surfactant-concentration data is also needed to maintain surfactant mass conservation during insertion and deletion of elements. In our simulations, the change in the total surfactant mass is limited to less than 1 %. Another important point is that numerical errors in drop surface advection and the insertion and deletion procedures may induce drop volume loss. To address this issue, the droplet volume is enforced to be equal to its initial value by moving Lagrangian points outward, which was used in our previous study (Luo et al.
Reference Luo, He and Bai2015) and is also recommended by Tryggvason et al. (Reference Tryggvason, Bunner, Esmaeeli, Juric, Al-Rawahi, Tauber, Han, Nas and Jan2001).
Due to the presence of the Marangoni stress and surface viscous stress, special attention is needed for the discretization of drop surface stress. In our method, surface tension and surface viscous stress are calculated separately. To avoid computing surface curvatures in the calculation of surface tension, the procedure proposed by Tryggvason, Scardovelli & Zaleski (Reference Tryggvason, Scardovelli and Zaleski2011) is employed, in which the discrete surface tension
 $\unicode[STIX]{x0394}\boldsymbol{f}_{\unicode[STIX]{x1D70E}}$
at the
 $k$
th Lagrangian point is given by:
 $$\begin{eqnarray}\displaystyle \unicode[STIX]{x0394}\boldsymbol{f}_{\unicode[STIX]{x1D70E}}=\int _{\unicode[STIX]{x0394}A_{k}}(\unicode[STIX]{x1D735}_{s}\unicode[STIX]{x1D70E}-2\unicode[STIX]{x1D70E}\unicode[STIX]{x1D705}\boldsymbol{n})\,\text{d}A=\int _{C_{k}}\unicode[STIX]{x1D70E}\boldsymbol{\cdot }\boldsymbol{t}\times \boldsymbol{n}\,\text{d}l. & & \displaystyle\end{eqnarray}$$
Here,
 $C_{k}$
represents the boundary of surface segment
 $\unicode[STIX]{x0394}A_{k}$
which consists of one third of all triangular elements linked with the
 $k$
th point, and
 $\boldsymbol{t}$
is the local tangential vector of the boundary
 $C_{k}$
. Note that
 $\unicode[STIX]{x1D70E}$
is dependent on local surfactant concentration
 $\unicode[STIX]{x1D6E4}$
. Details of the derivation of (2.13) can be found in the appendix of Jesus et al. (Reference Jesus, Roma, Pivello, Villar and da Silveira-Neto2015). On the other hand, via Gauss theorem, the calculation of the discrete surface viscous stress
 $\unicode[STIX]{x0394}\boldsymbol{f}_{v}$
at the
 $k$
th triangular element is transformed as follows:
 $$\begin{eqnarray}\displaystyle \unicode[STIX]{x0394}\boldsymbol{f}_{v}=\int _{\unicode[STIX]{x0394}A_{k}}\unicode[STIX]{x1D735}_{s}\boldsymbol{\cdot }\unicode[STIX]{x1D749}_{v}\,\text{d}A=\int _{C_{k}}\unicode[STIX]{x1D749}_{v}\boldsymbol{\cdot }\boldsymbol{t}\times \boldsymbol{n}\,\text{d}l. & & \displaystyle\end{eqnarray}$$
Here, surface viscous stress
 $\unicode[STIX]{x1D749}_{v}$
is computed via (2.5), and note that
 $Bq$
is dependent on local surfactant concentration
 $\unicode[STIX]{x1D6E4}$
just like
 $\unicode[STIX]{x1D70E}$
. Following Li & Sarkar (Reference Li and Sarkar2008), the force acting on each element edge is calculated first and then the total force acting on each Lagrangian point is computed by adding the forces acting on all element edges connecting that Lagrangian point.
In this study, we are interested in the zero-Reynolds-number limit, while our numerical method cannot simulate a Stokes flow (Luo & Bai Reference Luo and Bai2018). From this viewpoint, the boundary integral method (Pozrikidis Reference Pozrikidis1994; Li & Pozrikidis Reference Li and Pozrikidis1997; Cristini et al.
Reference Cristini, Guido, Alfani, Blawzdziewicz and Loewenberg2003) is superior to our front-tracking finite-difference method, because the drop surface is smeared and so fewer errors are generated. Nevertheless, the front-tracking method is still widely used via setting quite low Reynolds numbers to approximate the Stokes limit. Besides, it is much easier to further extend the front-tracking method to flows with moderate-to-high Reynolds numbers (Aggarwal & Sarkar Reference Aggarwal and Sarkar2007; Olgac & Muradoglu Reference Olgac and Muradoglu2013; Yazdani & Bagchi Reference Yazdani and Bagchi2013; Carroll & Gupta Reference Carroll and Gupta2014; Luo et al.
Reference Luo, He and Bai2015). In our present study, the Reynolds number is set to 0.1 to eliminate the inertial effect according to our previous verification in the study of membrane-enclosed droplets (Bai et al.
Reference Bai, Luo, Wang, He, Lu and Xu2013; Luo et al.
Reference Luo, Wang, He, Xu and Bai2013). Here, we also examine the inertial effect on the deformation of droplets with surface viscosity by decreasing the Reynolds number from 0.1 to 0.01, and find that the drop deformation decreases by less than 1.5 %. Therefore,
 $Re=0.1$
is used in the following simulations to approximate the zero-Reynolds-number limit.
In this study,
 $\unicode[STIX]{x1D706}_{ds}$
is set to 1 for simplicity, unless otherwise stated, in particular when the effect of dilatational surface viscosity is examined. We focus on the influence of surfactant-concentration-dependent surface viscosity on drop dynamics via varying the initial Boussinesq number
 $Bq_{0}$
and the dimensionless surface-pressure scale
 $\unicode[STIX]{x1D6F1}_{c}^{\ast }$
under different
 $Ca$
,
 $Pe_{s}$
and
 $\unicode[STIX]{x1D6FD}$
. In particular,
 $Pe_{s}$
,
 $\unicode[STIX]{x1D6FD}$
,
 $Bq$
and
 $\unicode[STIX]{x1D6F1}_{c}^{\ast }$
that are important parameters governing surfactant transport and surface viscous stress are set in the range of 0.1–1000, 0–0.8, 0–10 and 0.05–0.5, respectively. The surface Péclet number
 $Pe_{s}$
is usually much larger than
 $O(1)$
for typical flows with surfactants. Nevertheless, our simulations indicate that
 $Pe_{s}$
no longer has a significant effect when it is higher than 10, since convection already plays the dominant role over diffusion. Therefore,
 $Pe_{s}$
is set to 0.1–10 for most simulations in this study. In fact, experiments have measured the surface viscosity for a variety of surfactants and the reported value lies in a wide range of
 $10^{-3}{-}10~\unicode[STIX]{x03BC}\text{N}~\text{s}~\text{m}^{-1}$
(Kim et al.
Reference Kim, Choi, Zell, Squires and Zasadzinski2013; Langevin Reference Langevin2014; Zell et al.
Reference Zell, Nowbahar, Mansard, Leal, Deshmukh, Mecca, Tucker and Squires2014; Ponce-Torres et al.
Reference Ponce-Torres, Montanero, Herrada, Vega and Vega2017). Accordingly, the Boussinesq number
 $Bq$
also lies in a wide range from 0 to much higher than 10; especially, note that the drop diameter usually lies in a wide range as well. Nevertheless, our simulations show that the surfactant transport exhibits little effect at relatively high
 $Bq$
since the surface viscous stress becomes the predominant factor over the Marangoni stress. Thus, both the small deformation analysis by Flumerfelt (Reference Flumerfelt1980) and the numerical simulation by Gounley et al. (Reference Gounley, Boedec, Jaeger and Leonetti2016) can predict the drop deformation quite well. Considering that higher
 $Bq$
increases the computational expense substantially, we set
 $Bq$
to below 10 in this study. Regarding the dimensionless surface-pressure scale
 $\unicode[STIX]{x1D6F1}_{c}^{\ast }$
, previous experiments have shown that
 $\unicode[STIX]{x1D6F1}_{c}^{\ast }$
for typical surfactants is generally large but it may also become lower than 0.2 (Kim et al.
Reference Kim, Choi, Zasadzinski and Squires2011, Reference Kim, Choi, Zell, Squires and Zasadzinski2013; Manikantan & Squires Reference Manikantan and Squires2017).
According to the verification presented in our previous work (Luo et al.
Reference Luo, Wang, He, Xu and Bai2013, Reference Luo, He and Bai2015; Luo & Bai Reference Luo and Bai2016), a computational domain size of
 $8R\times 5R\times 8R$
and Eulerian resolution of
 $96\times 64\times 96$
are sufficient to eliminate their effects. In the following sections, five different configurations are simulated and compared to each other, including (i) clean droplet, (ii) droplet with constant surface viscosity but with no surfactant transport, (iii) droplet with surfactant transport but with no surface viscosity, (iv) droplet with surfactant transport and a constant surface viscosity and (v) droplet with surfactant transport and a surfactant-concentration-dependent surface viscosity.
3 Results and discussion
3.1 Validation: droplet with constant surface viscosity or surfactant transport only
Validations are performed via modelling of the first three cases as listed in § 2.2, since they have been investigated extensively in previous studies and hence data can be easily found for comparison purposes, i.e. (i) clean droplet (Kwak & Pozrikidis Reference Kwak and Pozrikidis1998; Li, Renardy & Renardy Reference Li, Renardy and Renardy2000; Vananroye et al.
Reference Vananroye, Janssen, Anderson, Van Puyvelde and Moldenaers2008; Komrakova et al.
Reference Komrakova, Shardt, Eskin and Derksen2014), (ii) droplet with constant surface viscosity but with no surfactant transport (Yu & Zhou Reference Yu and Zhou2011; Gounley et al.
Reference Gounley, Boedec, Jaeger and Leonetti2016) and (iii) droplet with surfactant transport but with no surface viscosity (Li & Pozrikidis Reference Li and Pozrikidis1997; Feigl et al.
Reference Feigl, Megias-Alguacil, Fischer and Windhab2007; Jesus et al.
Reference Jesus, Roma, Pivello, Villar and da Silveira-Neto2015). These studies have indicated that an initially spherical droplet is usually elongated into a steady ellipsoid shape, but the droplet breaks up when the capillary number is higher than a threshold. It is helpful to fully understand drop deformation first since it precedes drop breakup (Derkach Reference Derkach2009). In this study, the main objective is to reveal the fundamental influence of a surfactant-concentration-dependent surface viscosity on the drop dynamics and to unveil the underlying mechanism. Therefore, we usually present only the steady-state drop deformation characterized by the Taylor parameter
 $D=(L-B)/(L+B)$
, where
 $L$
and
 $B$
are the drop’s major and minor axes in the shear plane, respectively.
Firstly, we present the deformation of a droplet with a clean interface in a simple shear flow. The steady-state drop deformation
 $D$
is plotted as a function of the capillary number
 $Ca$
in figure 2(b), in which our results are found to agree well with those of Komrakova et al. (Reference Komrakova, Shardt, Eskin and Derksen2014) using the lattice Boltzmann method. The largest relative error is limited to below 2 %. Besides, the critical capillary number leading to drop breakup lies in the range of 0.37–0.38 in our simulations, which is also consistent with the range of 0.37–0.43 found in previous studies (Kennedy, Pozrikidis & Skalak Reference Kennedy, Pozrikidis and Skalak1994; Li et al.
Reference Li, Renardy and Renardy2000; Cristini et al.
Reference Cristini, Guido, Alfani, Blawzdziewicz and Loewenberg2003; Gounley et al.
Reference Gounley, Boedec, Jaeger and Leonetti2016). Notably, the prediction from small deformation theory by Flumerfelt (Reference Flumerfelt1980) for clean droplets agrees well with the numerical results of both our method and Komrakova et al.’s only when the capillary number is sufficiently small.
Validation of our numerical methodology on modelling the deformation of droplets with surface viscosity but with no surfactant transport (i.e. both surface viscosity and surface tension are constant). (a) Transient deformation of the droplet at different Boussinesq number
 $Bq$
with
 $Ca=0.1$
. Previous numerical result by Pozrikidis (Reference Pozrikidis1994) is presented for validation purposes. (b) The steady-state deformation is plotted as a function of the capillary number
 $Ca$
for different
 $Bq$
. Previous analytical result by Flumerfelt (Reference Flumerfelt1980) and numerical result by Gounley et al. (Reference Gounley, Boedec, Jaeger and Leonetti2016) are presented for validation purposes.
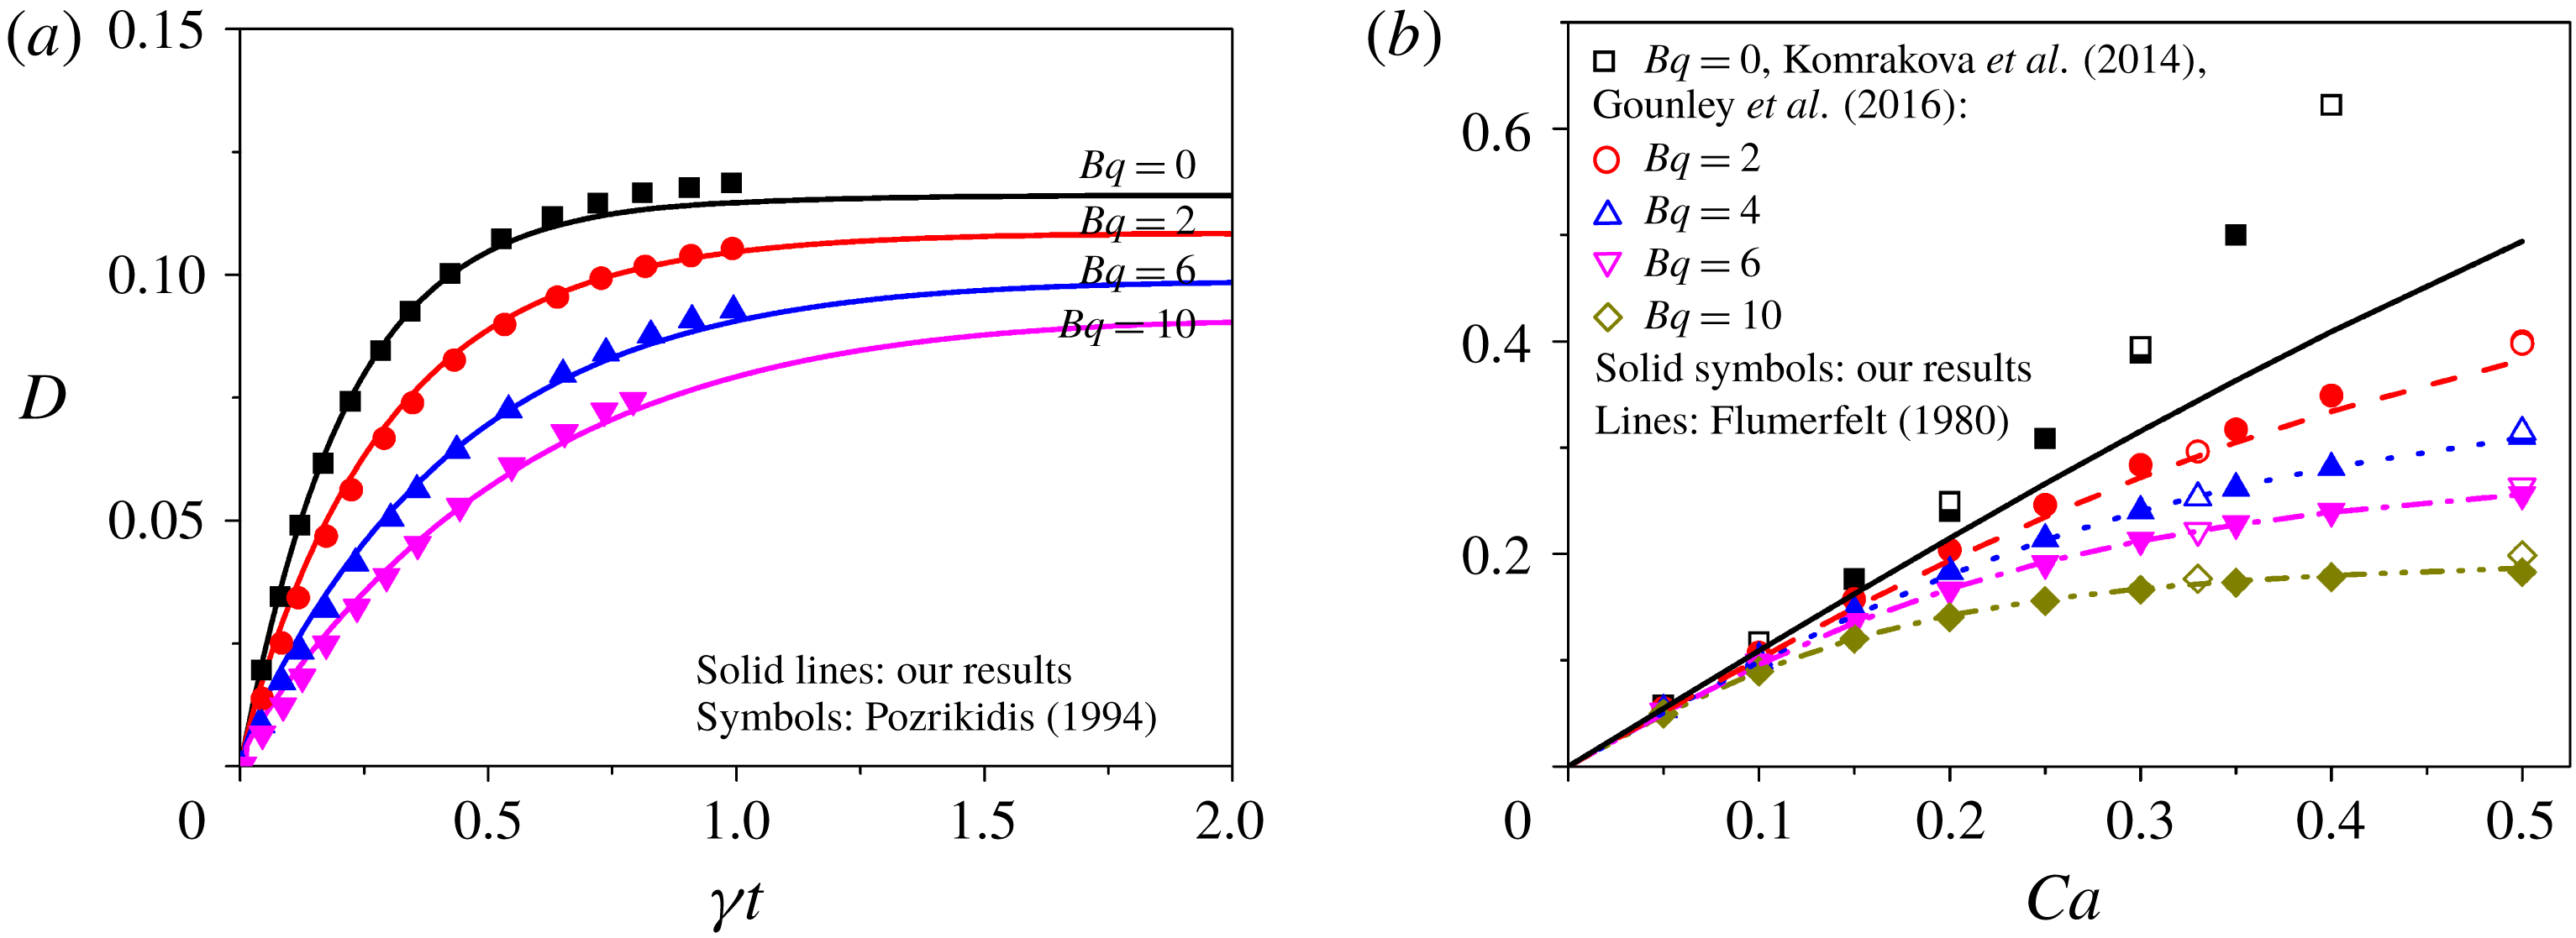
As the second case for validation, we simulate the deformation of a droplet with a constant surface viscosity but with no surfactant transport to validate our method for computing surface viscous stresses. In figure 2(a), the drop’s transient deformation is presented for different Boussinesq numbers
 $Bq$
, in which previous numerical results by Pozrikidis (Reference Pozrikidis1994) using the boundary integral method are also included. Good agreement between our results and Pozrikidis’ is observed, except that Pozrikidis could not obtain the steady state due to numerical instability and high computational expense. Further, we compare our prediction on the drop’s steady-state deformation
 $D$
with that by Gounley et al. (Reference Gounley, Boedec, Jaeger and Leonetti2016) using boundary element simulation and that by Flumerfelt (Reference Flumerfelt1980) using small deformation analysis. In figure 2(b),
 $D$
is plotted as a function of the capillary number
 $Ca$
for different
 $Bq$
. Excellent agreement is obtained in quantitative terms with both Gounley et al.’s simulation and Flumerfelt’s analysis. In general, the surface viscosity tends to reduce drop deformation, and it is enhanced at larger
 $Ca$
. Besides, the surface viscosity tends to inhibit drop breakup, i.e. higher critical capillary number (larger than 0.5 for
 $Bq>2$
) than the clean droplet. This inhibition effect on drop breakup is also observed by Gounley et al. (Reference Gounley, Boedec, Jaeger and Leonetti2016). Notably, the small deformation analysis by Flumerfelt (Reference Flumerfelt1980) shows larger deviation from both our numerical simulation and Gounley et al.’s at higher
 $Ca$
and lower
 $Bq$
, when the droplet exhibits large deformation.
Validation of our numerical methodology on modelling the deformation of surfactant-laden droplets considering surfactant transport (i.e.
 $\unicode[STIX]{x1D70E}$
depends on surfactant concentration) but neglecting surface viscosity. (a) The steady-state deformation is plotted as a function of the capillary number for
 $\unicode[STIX]{x1D6FD}=0.8$
,
 $Pe_{s}=Ca$
and
 $\unicode[STIX]{x1D706}_{\unicode[STIX]{x1D707}}=0.335$
. Here, previous analytical results by Mandal, Das & Chakraborty (Reference Mandal, Das and Chakraborty2017), and numerical and experimental data by Feigl et al. (Reference Feigl, Megias-Alguacil, Fischer and Windhab2007) are presented for validation purposes. (b) The drop deformation is analysed for different
 $\unicode[STIX]{x1D6FD}$
and
 $Pe_{s}$
while
 $\unicode[STIX]{x1D706}_{\unicode[STIX]{x1D707}}$
is set to 1.

Finally, we simulate the deformation of a droplet with surfactant transport but no surface viscosity to validate our numerical methodology for the solution of the surfactant transport equation. In figure 3(a), the drop’s steady-state deformation
 $D$
is plotted as a function of
 $Ca$
. Previous analytical results by Mandal et al. (Reference Mandal, Das and Chakraborty2017), and numerical and experimental data by Feigl et al. (Reference Feigl, Megias-Alguacil, Fischer and Windhab2007) are included. Our results show excellent agreement with these reported data, especially with the numerical results by Feigl et al. (Reference Feigl, Megias-Alguacil, Fischer and Windhab2007). Notably, Mandal et al.’s small deformation analysis predicts well at low
 $Ca$
but it shows large deviations at high
 $Ca$
compared to both our results and Feigl et al. (Reference Feigl, Megias-Alguacil, Fischer and Windhab2007)’s. In figure 3(b), the effects of surfactant transport on drop deformation is also analysed by varying
 $Pe_{s}$
and
 $\unicode[STIX]{x1D6FD}$
. In principle, local surfactant concentration
 $\unicode[STIX]{x1D6E4}$
on the deforming drop surface is governed by the competition of convection, diffusion and dilution. Particularly, convection leads to high
 $\unicode[STIX]{x1D6E4}$
at the drop tips and low
 $\unicode[STIX]{x1D6E4}$
at the drop equator (figure 1
b). When diffusion dominates over convection at low
 $Pe_{s}$
(i.e.
 $Pe_{s}=0.1$
),
 $\unicode[STIX]{x1D6E4}$
is nearly uniform over the entire drop surface. However, its magnitude is reduced owing to dilution that is especially obvious at high
 $Ca$
, thus
 $\unicode[STIX]{x1D6E4}$
is usually lower than its initial value
 $\unicode[STIX]{x1D6E4}_{0}$
. As a result, surfactant-laden droplets with low
 $Pe_{s}$
present smaller deformations than clean droplets at the same
 $Ca$
(note that
 $Ca$
is defined on
 $\unicode[STIX]{x1D6E4}_{0}$
for surfactant-laden droplets). When convection dominates over diffusion at high
 $Pe_{s}$
(i.e.
 $Pe_{s}=10$
), the surfactant accumulates around the drop tips, reduces the surface tension there and promotes the drop elongation. Consequently, surfactant-laden droplets with high
 $Pe_{s}$
present a little larger deformation than clean droplets. However, at high
 $Ca$
, they still present smaller deformations than clean droplets since the dilution effect is quite strong and inhibits the drop deformation significantly. The effect of
 $\unicode[STIX]{x1D6FD}$
on drop deformation is also examined. When
 $\unicode[STIX]{x1D6FD}$
is small (i.e.
 $\unicode[STIX]{x1D6FD}=0.2$
), surface tension is insensitive to the surfactant-concentration variation, and hence it remains close to that of clean surfaces. As a consequence, surfactant-laden droplets with low
 $\unicode[STIX]{x1D6FD}$
exhibit almost the same deformation as clean droplets. While, at high
 $\unicode[STIX]{x1D6FD}$
(i.e.
 $\unicode[STIX]{x1D6FD}=0.8$
) when surface tension is very sensitive to the surfactant concentration variation, the drop deformation is inhibited obviously due to the dilution effect. Moreover, the drop breakup is also inhibited, which is reflected in the increased critical capillary number (larger than 0.5 at
 $\unicode[STIX]{x1D6FD}=0.8$
). Notably, these observations for the effects of surfactant transport on drop deformation are also consistent in qualitative terms with previous studies (Li & Pozrikidis Reference Li and Pozrikidis1997; Feigl et al.
Reference Feigl, Megias-Alguacil, Fischer and Windhab2007).
3.2 Droplet with surfactant transport and constant surface viscosity
In this section, we present our simulation results on the deformation of a droplet considering both surfactant transport and surface viscosity, in particular to examine the combined effects of the Marangoni stress and surface viscous stress on the drop dynamics. Here, for the sake of simplicity, the surface viscosity is maintained constant and independent of the local surfactant concentration, which can also serve as an approximation to the infinite-surface-pressure-scale limit. We fist show a few representative examples of the drop’s transient deformation to show the dynamical effects. Then, we investigate the combined influence of Marangoni stress and surface viscous stress on the drop’s steady-state deformation via comparing with the previous study by Gounley et al. (Reference Gounley, Boedec, Jaeger and Leonetti2016) on droplets with constant surface viscosity but with no surfactant transport. To reveal the underlying mechanism, we analyse the effects of surface viscosity on surfactant transport via the distributions of surface velocity and surfactant concentration. Next, the combined effect of a purely dilatational surface viscosity and surfactant transport on drop deformation and the mechanism underlying this combined effect are examined in particular. Finally, how the drop breakup is affected by the coupling of Marangoni stress and surface viscous stress is investigated via analysing the critical capillary number.
In figure 4, we present several typical examples for the time evolution of the drop deformation
 $D$
and inclination
 $\unicode[STIX]{x1D703}$
, for Boussinesq numbers
 $Bq$
of 0, 1, 2, 4, 6 and 10. At low
 $Bq$
,
 $D$
and
 $\unicode[STIX]{x1D703}$
exhibit a monotonic increasing and a decreasing trend, respectively, until they reach the plateau when the droplet reaches the steady state. These transient behaviours have been well known for both clean and surfactant-laden droplets in shear flow (Fischer & Erni Reference Fischer and Erni2007). However, when
 $Bq$
becomes sufficiently large (e.g.
 $Bq=10$
), an overshoot and undershoot is observed in the transient deformation and inclination, respectively. Nevertheless, the droplet can still reach the steady state eventually, including the drop’s deformation and inclination and the surfactant transport on the drop surface, although the time period for the transient deformation behaviour becomes longer with increasing
 $Bq$
. Note that the overshoot phenomenon is not observed for the droplet with only the Marangoni stress but no surface viscous stress (i.e.
 $Bq=0$
). In fact, Kennedy et al. (Reference Kennedy, Pozrikidis and Skalak1994) presented this overshoot phenomenon and even damped oscillations (i.e. at least an overshoot followed by an undershoot) for clean droplets once the internal-to-external viscosity ratio
 $\unicode[STIX]{x1D706}_{\unicode[STIX]{x1D707}}$
exceeds a critical value that is much larger than 1. Gounley et al. (Reference Gounley, Boedec, Jaeger and Leonetti2016) found that a similar transient oscillating relaxation can occur at
 $\unicode[STIX]{x1D706}_{\unicode[STIX]{x1D707}}=1$
for a droplet with surface viscosity as long as
 $Ca\cdot Bq>3.5$
. In our simulations, the transient oscillating relaxation is also observed for high
 $Ca$
(e.g.
 $Ca=0.5$
) at
 $Bq=10$
(data not shown). However, systematic analysis of this oscillating relaxation is not conducted due to the high computational expense resulting from the oscillations significantly increasing the computational time to obtain the steady state. Therefore, most of our simulations are limited to low values of
 $Ca\cdot Bq$
.
Several typical examples of transient deformation of droplets with both surface viscosity and surfactant transport taken into account, while the surface viscosity is independent of surfactant concentration.
 $Ca$
,
 $Pe_{s}$
and
 $\unicode[STIX]{x1D6FD}$
are set to 0.2, 1 and 0.8, respectively. Time evolution of (a) deformation index and (b) inclination angle plotted for different
 $Bq$
. Three-dimensional drop shape profiles with contours of (c) surface velocity and (d) surfactant concentration are presented at different time frames for
 $Bq=10$
.

We then study the combined effects of surfactant transport and surface viscosity on the drop’s steady-state deformation. In figure 5, the steady-state deformation
 $D$
and inclination
 $\unicode[STIX]{x1D703}$
are plotted as functions of the Boussinesq number
 $Bq$
under different capillary numbers
 $Ca$
. When
 $Bq$
is quite small (e.g.
 $Bq\leqslant 0.1$
), the influence of surface viscosity is negligible. In contrast, at higher
 $Bq$
(e.g.
 $Bq=1{-}10$
), the surface viscosity shows a strong impact which is similar to the case with constant surface viscosity but without considering surfactant transport (figure 2
b). There is an important assumption proposed by Gounley et al. (Reference Gounley, Boedec, Jaeger and Leonetti2016) that needs to be tested; that is, whether the surfactant transport can be neglected once the surface viscosity is taken into account. To this end, we compare the deformation of droplets with both surfactant transport and surface viscosity (figure 5
a) to that with constant surface viscosity but with no surfactant transport (figure 2
b). The effects of surfactant transport cannot be neglected, especially at relatively low
 $Bq$
. Specifically, combining surfactant transport leads to a difference in
 $D$
that may become higher than 20 % at low
 $Bq$
. However, the difference is reduced by increasing
 $Bq$
and it can be limited to below 5 % at
 $Bq>4$
. In other words, the effects of surfactant transport on drop deformation can be neglected only at sufficiently high surface viscosity when the surface viscous stress plays the predominant role in drop deformation.
(a) Deformation and (b) inclination of droplets with both surface viscosity and surfactant transport taken into account. Analytical result by Flumerfelt (Reference Flumerfelt1980) is presented for comparison purposes. Here, the surface viscosity is independent of surfactant concentration, and hence it is constant over the entire drop surface.
 $Pe_{s}$
and
 $\unicode[STIX]{x1D6FD}$
are set to 1 and 0.8, respectively.

We compare our numerical results with the analytical results from small deformation theory by Flumerfelt (Reference Flumerfelt1980). Flumerfelt (Reference Flumerfelt1980) obtained an expression to predict the drop’s steady-state deformation and inclination in the presence of surface viscosity as follows:
 $$\begin{eqnarray}\displaystyle & \displaystyle D=\frac{1}{16}\frac{(19a+16)+a(b-9c)}{(a+1)[(1/Ca)^{2}+(19ad/20)^{2}]^{1/2}}, & \displaystyle\end{eqnarray}$$
 $$\begin{eqnarray}\displaystyle & \displaystyle \unicode[STIX]{x1D703}=\frac{\unicode[STIX]{x03C0}}{4}+\frac{1}{2}\tan ^{-1}\left(\frac{19adCa}{20}\right). & \displaystyle\end{eqnarray}$$
Here,
 $a$
,
 $b$
,
 $c$
and
 $d$
are related to the viscosity ratio
 $\unicode[STIX]{x1D706}_{\unicode[STIX]{x1D707}}$
and the Boussinesq numbers based on the shear (
 $Bq_{s}$
) and dilatational (
 $Bq_{d}$
) surface viscosities as follows:
 $$\begin{eqnarray}\displaystyle & \displaystyle a=\unicode[STIX]{x1D706}_{\unicode[STIX]{x1D707}}+{\textstyle \frac{2}{5}}(3Bq_{d}+2Bq_{s}), & \displaystyle\end{eqnarray}$$
 $$\begin{eqnarray}\displaystyle & \displaystyle b=\frac{6}{5}\frac{Bq_{d}}{a}, & \displaystyle\end{eqnarray}$$
 $$\begin{eqnarray}\displaystyle & \displaystyle c=\frac{4}{5}\frac{Bq_{s}}{a}, & \displaystyle\end{eqnarray}$$
 $$\begin{eqnarray}\displaystyle & \displaystyle d=1-{\textstyle \frac{1}{114}}[113Bq_{d}+33Bq_{s}+(Bq_{d}-9Bq_{s})^{2}]. & \displaystyle\end{eqnarray}$$
As presented in the validation § 3.1, both our results (i.e. figure 2 b) and those of Gounley et al. (Reference Gounley, Boedec, Jaeger and Leonetti2016) indicate that the expression (3.1) predicts the drop deformation quite well, especially at high Boussinesq numbers or low capillary numbers. In fact, Flumerfelt (Reference Flumerfelt1980) also considered the combined effect of the Marangoni stress and surface viscosity by integrating the Marangoni effect into an apparent dilatational surface viscosity as:
 $$\begin{eqnarray}\displaystyle Bq_{d}^{\prime }=Bq_{d}+\frac{N_{M}\unicode[STIX]{x1D6FD}}{Ca}. & & \displaystyle\end{eqnarray}$$
Here,
 $N_{M}$
is related to the adsorption kinetics of soluble surfactants, while it is incalculable for insoluble surfactants. The second term
 $N_{M}\unicode[STIX]{x1D6FD}/Ca$
measures the effect of the Marangoni stress resulting from the surfactant-concentration gradient on the drop’s surface. In Flumerfelt’s theory, the surfactant-concentration gradient is induced by adsorption, but the effects of surface diffusion and convection are neglected. In contrast, in our simulation, the surfactant concentration gradient is induced by surface diffusion and convection but not adsorption. Considering that the small deformation analysis by Flumerfelt (Reference Flumerfelt1980) is currently the only one taking into account the combined effect of the Marangoni stress and surface viscosity, it is of interest to compare our numerical results with Flumerfelt’s theory, although the surfactant transport mechanism is quite different. Note that, in the small deformation analysis by Flumerfelt (Reference Flumerfelt1980),
 $N_{M}$
is required to be sufficiently small, and we find the results predicted by (3.7) show no significant change when
 $N_{M}<0.1$
. Therefore, we use
 $N_{M}=0.1$
to compare the analytical results with our numerical results, as shown in figure 5. In general, Flumerfelt’s expression predicts the drop deformation quite well for all capillary numbers, even if the droplet shows a large deformation. Flumerfelt’s results become gradually lower than our results when
 $Bq$
approaches zero, which is similar to the case of droplets with a constant surface viscosity but with no surfactant transport (Gounley et al.
Reference Gounley, Boedec, Jaeger and Leonetti2016). However, it is surprisingly observed that the integration of the Marangoni stress lowers the deviation of Flumerfelt’s analysis from the numerical simulations at low
 $Bq$
. On the other hand, the deviation in the inclination angle between Flumerfelt’s analysis and our simulation is more obvious, which is similar to the observation of Gounley et al. (Reference Gounley, Boedec, Jaeger and Leonetti2016). Again, Flumerfelt’s analysis predicts well at high
 $Bq$
but it shows a larger discrepancy at low
 $Bq$
. These results indicate that the small deformation analysis by Flumerfelt (Reference Flumerfelt1980) produces an obvious disparity at
 $Bq\rightarrow 0$
not just for clean droplets but also for surfactant-laden droplets with no surface viscosity, under which condition the surface viscous stress has little or no effect. Flumerfelt’s analysis predicts quite well however at high
 $Bq$
when the surface viscous stress plays the predominant role.
Here, we show that the surface viscous stress has a great impact on surfactant transport on the deforming drop surface since it alters significantly the interfacial flow pattern. In figure 6, we present three-dimensional contours of surface velocity
 $u_{s}$
and surfactant concentration
 $\unicode[STIX]{x1D6E4}$
under different Boussinesq numbers. Generally,
 $u_{s}$
reaches its maximum and minimum nearly at the drop equator and tips, respectively. As a result, the surfactant accumulates at the tips but depletes at the equator owing to the convection effect. As pointed out by Pozrikidis (Reference Pozrikidis1994) and Gounley et al. (Reference Gounley, Boedec, Jaeger and Leonetti2016), the surface viscous stress tends to eliminate the surface velocity gradient. This is also indicated by our results as shown in figure 6(a,c). More specifically, the surface viscous stress tends to eliminate the variation of surface velocity along the flow rotation direction, while it induces an insignificant change along the vorticity direction (figure 6
a). As a result, the surface velocity increases at the drop tips but decreases at the equator in the shear plane (figure 6
c). At high Boussinesq numbers (e.g.
 $Bq=10$
), the surface velocity becomes nearly uniform. Owing to these changes in the flow pattern, the surfactant no longer accumulates at the drop tips and its concentration becomes more uniform with
 $Bq$
increasing. In this respect, increasing
 $Bq$
(representing larger surface viscous stress) has a similar effect on surfactant transport as decreasing
 $Pe_{s}$
(representing more significant diffusion) or increasing
 $\unicode[STIX]{x1D6FD}$
(representing a larger Marangoni stress) does, which is to eliminate the surfactant concentration variation via inhibiting convection.
Distribution of (a) surface velocity and (b) surfactant concentration on the three-dimensional surface of surfactant-laden droplets with constant surface viscosity and surfactant transport. (c) Surface velocity magnitude
 $u_{s}$
and (d) surfactant concentration
 $\unicode[STIX]{x1D6E4}$
are plotted as functions of the phase angle
 $\unicode[STIX]{x1D6FC}$
in the shear plane (i.e.
 $y=L_{y}/2$
).
 $\unicode[STIX]{x1D6FC}$
is defined as shown in the inset of (c).
 $Ca$
is 0.35 and other parameters are same as shown in figure 5.

Coupled effect of purely dilatational surface viscosity and surfactant transport on drop deformation. Steady-state deformation (a) and inclination (b) are plotted as functions of dilatational surface viscosity
 $Bq_{d}$
.
 $Bq_{s}$
and
 $Pe_{s}$
are set to 0 and 1, respectively. (c) Surface velocity magnitude
 $u_{s}$
and (d) surfactant concentration
 $\unicode[STIX]{x1D6E4}$
are plotted as functions of the phase angle
 $\unicode[STIX]{x1D6FC}$
. (e) Three-dimensional drop shape profile with contour of surface rate of dilation. In (c), (d) and (e)
 $Bq_{s}$
,
 $Pe_{s}$
,
 $Ca$
and
 $\unicode[STIX]{x1D6FD}$
are set to 0, 1, 0.2 and 0.8, respectively.

We next examine the combined effect of purely dilatational surface viscosity with surfactant transport on drop deformation, since Flumerfelt (Reference Flumerfelt1980) integrated the effect of small variations in surface tension into an apparent dilatational surface viscosity. In figure 7(a,b), the steady-state deformation and inclination are plotted as functions of the Boussinesq number based on dilatational surface viscosity (
 $Bq_{d}$
), while the Boussinesq number based on shear surface viscosity (
 $Bq_{s}$
) is set to 0. Flumerfelt’s analytical results calculated from equations (3.1) and (3.2) are also presented for comparison purposes. Generally, the increase of drop deformation with
 $Bq_{d}$
is observed and it is more obvious at higher capillary number, which is also presented by Flumerfelt (Reference Flumerfelt1980) and Gounley et al. (Reference Gounley, Boedec, Jaeger and Leonetti2016) for droplets with surface viscosity but with no surfactant transport. While we find this increasing effect is significantly weakened by increasing elasticity number. At
 $Bq_{d}\rightarrow 0$
, both Flumerfelt’s and our results indicate a slight increase of the drop deformation with elasticity number. This slight increase results from the variation in surface tension, which has already been discussed in figure 3(b) as well as previous studies of surfactant-laden droplets with no surface viscosity (Li & Pozrikidis Reference Li and Pozrikidis1997; Feigl et al.
Reference Feigl, Megias-Alguacil, Fischer and Windhab2007). On the other hand, at high
 $Bq_{d}$
, the elasticity number shows little effect at low
 $Ca$
, which is also indicated by both Flumerfelt’s and our own results. On the contrary, at high
 $Ca$
, our results show an obvious decrease of drop deformation with increasing elasticity number, but Flumerfelt’s analysis does not predict this qualitative feature. As discussed in § 3.1, the convection effect tends to increase the drop deformation slightly and it plays a predominant role only in the small deformation regime. On the contrary, in the large deformation regime, the dilution effect becomes the dominant factor and it tends to decrease the drop deformation. However, the dilution effect is omitted at the starting point in Flumerfelt’s small deformation analysis. We also observe larger deviations between Flumerfelt’s and our results for the steady-state inclination angle. Besides, our results show that the inclination angle decreases slightly with increasing
 $Bq_{d}$
or decreasing
 $\unicode[STIX]{x1D6FD}$
since the drop deformation is enlarged. However, this variation in the inclination angle is not captured by Flumerfelt’s small deformation analysis since the drop’s large deformation is omitted.
We also discuss the effect of purely dilatational surface viscosity on surfactant transport as shown in figure 7(c–e). Different from shear surface viscosity, the dilatational surface viscosity does not produce a significant effect on both the surface velocity distribution and the velocity magnitude in general, except that it enlarges the surface velocity in the small region around the drop tips and lowers the surfactant concentration there. As such, the convection is not significantly altered by the dilatational surface viscosity. We take the case of
 $\unicode[STIX]{x1D6FD}=0.8$
as an example in figure 7(c–e). The whole drop deformation shows no obvious change with
 $Bq_{d}$
and hence the drop’s steady shape is nearly the same and so is the drop’s total surface area. This result reflects the fact that the dilatational surface viscosity also induces little change in the dilution effect at the whole drop level. However, the dilatational surface viscosity can indeed induce significant change in surfactant transport. Particularly, increasing
 $Bq_{d}$
increases the surfactant concentration near the drop equator while it lowers that near the drop tips, and hence it reduces the surfactant concentration gradient as a whole. Notably, this effect of dilatational surface viscosity does not result from the changes in surface velocity and the following suppression of convection, which is the mechanism underlying the effect of shear surface viscosity (figure 6). On the contrary, the effect of dilatational surface viscosity originates from its suppression of the local dilution effect. As shown in figure 7(d), the surface rate of dilation is generally positive around the drop equator but it is negative around the drop tips. Thus, the surfactant is diluted around the drop equator and is condensed around the drop tips. On the other hand, increasing
 $Bq_{d}$
tends to decrease the absolute value of the surface rate of dilation on the whole drop surface, and hence the dilution around the drop equator and the condensation around the drop tips are both suppressed. In summary, the dilatational surface viscosity has the same apparent effect on surfactant transport (i.e. eliminating the non-uniformity of surfactant concentration) as shear surface viscosity does, while their underlying mechanisms are entirely different, i.e. the dilatational surface viscosity inhibits the local dilution while the shear surface viscosity inhibits the local convection.
Finally, we study the combined effect of surface viscosity and surfactant transport on the stability of droplets in shear flow. It is well known that the droplet maintains a steady shape with a tank-treading rotation at low capillary numbers, but it deforms continuously until it breaks up once the capillary number exceeds
 $Ca_{c}$
(Li & Pozrikidis Reference Li and Pozrikidis1997; Li et al.
Reference Li, Renardy and Renardy2000; Cristini et al.
Reference Cristini, Guido, Alfani, Blawzdziewicz and Loewenberg2003; Fischer & Erni Reference Fischer and Erni2007; Komrakova et al.
Reference Komrakova, Shardt, Eskin and Derksen2014; Gounley et al.
Reference Gounley, Boedec, Jaeger and Leonetti2016). For clean droplets,
 $Ca_{c}$
lies in the range of 0.37–0.43 at
 $\unicode[STIX]{x1D706}_{\unicode[STIX]{x1D707}}=1$
but it significantly increases with
 $\unicode[STIX]{x1D706}_{\unicode[STIX]{x1D707}}$
in a nonlinear manner. Gounley et al. (Reference Gounley, Boedec, Jaeger and Leonetti2016) found that the presence of surface viscosity also inhibits drop breakup and
 $Ca_{c}$
shows a nonlinear relationship with
 $Bq$
as well. In figure 8, we present
 $Ca_{c}$
as a function of
 $Bq$
for droplets with both surface viscosity and surfactant transport, in which the
 $Ca_{c}$
–
 $Bq$
relationship of Gounley et al. (Reference Gounley, Boedec, Jaeger and Leonetti2016) is also included for comparison purposes. Generally, compared to Gounley et al.’s results, the consideration of surfactant transport further inhibits drop breakup (i.e. increases
 $Ca_{c}$
), since the drop deformation is inhibited due to the increased dilution effect (figure 3
b). On the other hand, the inclusion of surfactant transport makes the
 $Ca_{c}-Bq$
relationship more linear. In other words, the surfactant transport induces a more obvious increase in
 $Ca_{c}$
at low
 $Bq$
, while the increase becomes weakened with
 $Bq$
increasing. It is because the inhibition effect of surfactant transport on drop breakup mainly originates from the dilution effect, while it is significantly inhibited by increasing surface viscous stress with
 $Bq$
increasing (figures 6 and 7). Therefore, at extremely high
 $Bq$
, the inhibition effect of surfactant transport on
 $Ca_{c}$
can be neglected, as the surface viscous stress becomes predominant over the Marangoni stress. Accordingly, it can be predicted that our
 $Ca_{c}$
–
 $Bq$
curve tends to coincide with that obtained by Gounley et al. (Reference Gounley, Boedec, Jaeger and Leonetti2016) at extremely high
 $Bq$
.
Diagram indicating the occurrence of stable (i.e. the droplet deforms but eventually maintains a steady shape while its surface presents a tank-treading rotation) and unstable (i.e. the droplet performs a continuous deformation and eventually tends to break up) regimes for droplets with both surface viscosity and surfactant transport taken into account.
 $\unicode[STIX]{x1D706}_{ds}$
,
 $Pe_{s}$
and
 $\unicode[STIX]{x1D6FD}$
are set to 1, 1 and 0.8, respectively. The solid line is just a guide for the eye indicating the critical capillary number for the stable-to-unstable transition. The dash-dot line is the critical capillary number for droplets with surface viscosity but with no surfactant transport, which was computed in a previous numerical study by Gounley et al. (Reference Gounley, Boedec, Jaeger and Leonetti2016).

3.3 Droplet with surfactant-concentration-dependent surface viscosity
In this section, we first compare the deformation of droplets with both surface viscosity and surfactant transport among three different configurations, i.e.
 $\unicode[STIX]{x1D6F1}$
-thickening,
 $\unicode[STIX]{x1D6F1}$
-independent and
 $\unicode[STIX]{x1D6F1}$
-thinning surfactants, to demonstrate the effects of surface viscosity variations on drop deformation. Then, we study the effects of the dimensionless pressure scale
 $\unicode[STIX]{x1D6F1}_{c}^{\ast }$
on drop deformation, since it is the most important parameter determining surface viscosity variations from surfactant concentration. Note that the surface viscosity variation depends on the surfactant concentration distribution that is mainly governed by the surface Péclet number
 $Pe_{s}$
and elasticity number
 $\unicode[STIX]{x1D6FD}$
. Therefore, we also study the effects of
 $Pe_{s}$
and
 $\unicode[STIX]{x1D6FD}$
on the deformation of surfactant-laden droplets considering also a surfactant-concentration-dependent surface viscosity. Finally, we re-examine the influence of surface viscosity variations on drop deformation when a nonlinear equation of state is used for the relationship between surface tension and surfactant concentration.
Deformation of surfactant-laden droplets with surfactant-concentration-dependent surface viscosity. Here, the surface viscosity is not constant over the drop surface. Particularly,
 $Bq$
increases (i.e.
 $\unicode[STIX]{x1D6F1}$
-thickening) or decreases (i.e.
 $\unicode[STIX]{x1D6F1}$
-thinning) exponentially with the surface pressure
 $\unicode[STIX]{x1D6F1}$
determined by surfactant concentration.
 $Pe_{s}$
and
 $\unicode[STIX]{x1D6FD}$
are set to 1 and 0.8, respectively. (a) Deformation index
 $D$
and (b) inclination angle
 $\unicode[STIX]{x1D703}$
versus
 $Ca$
for different reference viscosity
 $Bq_{0}$
with
 $\unicode[STIX]{x1D6F1}_{c}^{\ast }=0.2$
. Differences between the
 $\unicode[STIX]{x1D6F1}$
-thickening and
 $\unicode[STIX]{x1D6F1}$
-thinning cases in terms of surface viscosity distribution are presented in (c). (d) Surface velocity
 $u_{s}$
, surface viscosity
 $Bq$
and surfactant concentration
 $\unicode[STIX]{x1D6E4}$
are plotted as functions of the phase angle
 $\unicode[STIX]{x1D6FC}$
.
 $Ca$
,
 $Bq_{0}$
and
 $\unicode[STIX]{x1D6F1}_{c}^{\ast }$
are set to 0.5, 1 and 0.1, respectively.

Effects of the dimensionless surface-pressure scale
 $\unicode[STIX]{x1D6F1}_{c}^{\ast }$
on the deformation of droplets with surfactant-concentration-dependent surface viscosity. (a)
 $D$
is plotted as a function of
 $Ca$
under different
 $\unicode[STIX]{x1D6F1}_{c}^{\ast }$
. For simplicity, negative and positive values of
 $\unicode[STIX]{x1D6F1}_{c}^{\ast }$
represent the
 $\unicode[STIX]{x1D6F1}$
-thinning and
 $\unicode[STIX]{x1D6F1}$
-thickening cases, respectively.
 $Bq_{0}$
,
 $Pe_{s}$
and
 $\unicode[STIX]{x1D6FD}$
are set to 1, 1 and 0.8, respectively. (b) Surface viscosity
 $Bq$
and surfactant concentration
 $\unicode[STIX]{x1D6E4}$
are plotted as functions of the phase angle
 $\unicode[STIX]{x1D6FC}$
for
 $\unicode[STIX]{x1D6F1}$
-thickening cases with different
 $\unicode[STIX]{x1D6F1}_{c}^{\ast }$
.

To reveal the effects of surfactant-concentration-induced variations in surface viscosity on drop deformation, in figure 9(a,b), the drop’s steady-state deformation
 $D$
and inclination
 $\unicode[STIX]{x1D703}$
are plotted as functions of the capillary number
 $Ca$
for three different configurations, i.e.
 $\unicode[STIX]{x1D6F1}$
-thickening,
 $\unicode[STIX]{x1D6F1}$
-independent and
 $\unicode[STIX]{x1D6F1}$
-thinning surfactants. At all given values of
 $Ca$
, the
 $\unicode[STIX]{x1D6F1}$
-thickening case presents the largest deformation, while the
 $\unicode[STIX]{x1D6F1}$
-thinning case presents the smallest. In general, the difference in
 $D$
between the
 $\unicode[STIX]{x1D6F1}$
-thickening and
 $\unicode[STIX]{x1D6F1}$
-thinning cases under different
 $Bq_{0}$
and
 $\unicode[STIX]{x1D6F1}_{c}^{\ast }$
is always positive and not small, although the difference in
 $\unicode[STIX]{x1D703}$
is much smaller. On the other hand, the difference in
 $D$
between the
 $\unicode[STIX]{x1D6F1}$
-thickening and
 $\unicode[STIX]{x1D6F1}$
-thinning cases depends strongly on
 $Bq_{0}$
and
 $\unicode[STIX]{x1D6F1}_{c}^{\ast }$
, since they are two key parameters determining the magnitude of the surface viscosity (see (2.8) and (2.9)). To understand the underlying mechanism, we plot three-dimensional contours of surface viscosity for both the
 $\unicode[STIX]{x1D6F1}$
-thickening and
 $\unicode[STIX]{x1D6F1}$
-thinning cases in figure 9(c,d). The locations of high or low surface viscosity are swapped for these two cases, and more importantly, the surface viscosity over the entire drop surface is higher for the
 $\unicode[STIX]{x1D6F1}$
-thinning case. This is because the surfactant concentration on the deformed drop surface is lower than its initial value, and due to this change, the surface viscosity increases for the
 $\unicode[STIX]{x1D6F1}$
-thinning case but it decreases for the
 $\unicode[STIX]{x1D6F1}$
-thickening case. These surfactant-concentration-induced changes in the surface viscosity distribution explain why the droplet with a
 $\unicode[STIX]{x1D6F1}$
-thickening surface viscosity presents a larger deformation than the
 $\unicode[STIX]{x1D6F1}$
-independent case, and the
 $\unicode[STIX]{x1D6F1}$
-thinning case exhibits the smallest deformation (figure 9
a).
The surface-pressure scale is the most important parameter determining surface viscosity from surfactant concentration. Thus, we next study how the dimensionless surface-pressure scale
 $\unicode[STIX]{x1D6F1}_{c}^{\ast }$
affects drop deformation. In figure 10(a), the drop’s steady-state deformation
 $D$
is plotted versus
 $Ca$
for different
 $\unicode[STIX]{x1D6F1}_{c}^{\ast }$
. At all given values of
 $Ca$
, as
 $\unicode[STIX]{x1D6F1}_{c}^{\ast }$
increases, both the
 $\unicode[STIX]{x1D6F1}$
-thickening and
 $\unicode[STIX]{x1D6F1}$
-thinning cases tend to approach the
 $\unicode[STIX]{x1D6F1}$
-independent case with
 $Bq=Bq_{0}$
. This is because increasing
 $\unicode[STIX]{x1D6F1}_{c}^{\ast }$
is characterized by a decreasing sensitivity of surface viscosity to the variation in
 $\unicode[STIX]{x1D6E4}$
. At high
 $\unicode[STIX]{x1D6F1}_{c}^{\ast }$
(e.g.
 $\unicode[STIX]{x1D6F1}_{c}^{\ast }=0.5$
),
 $Bq$
over the entire drop surface is close to its initial value
 $Bq_{0}$
(figure 10
b). In contrast, the surface viscosity becomes rather sensitive to the variation in
 $\unicode[STIX]{x1D6E4}$
at low
 $\unicode[STIX]{x1D6F1}_{c}^{\ast }$
(e.g.
 $\unicode[STIX]{x1D6F1}_{c}^{\ast }=0.05$
). Accordingly,
 $Bq$
becomes close to 0 for the
 $\unicode[STIX]{x1D6F1}$
-thickening case but it becomes much larger than
 $Bq_{0}$
for the
 $\unicode[STIX]{x1D6F1}$
-thinning case. To understand the effect of
 $\unicode[STIX]{x1D6F1}_{c}^{\ast }$
on the drop’s surface viscosity in quantitative terms, the effective Boussinesq number
 $Bq_{av}$
averaged over the entire drop surface is calculated for
 $Ca=0.5$
,
 $Bq_{0}=1$
,
 $Pe_{s}=1$
and
 $\unicode[STIX]{x1D6FD}=0.8$
. As
 $\unicode[STIX]{x1D6F1}_{c}^{\ast }$
increases from 0.1 to 0.5,
 $Bq_{av}$
increases from 0.37 to 0.85 for the
 $\unicode[STIX]{x1D6F1}$
-thickening case, while it decreases from 2.51 to 1.19 for the
 $\unicode[STIX]{x1D6F1}$
-thinning case. In order to explain the effect of
 $\unicode[STIX]{x1D6F1}_{c}^{\ast }$
on drop deformation more explicitly, the deformation of the surfactant-concentration-dependent cases is compared with that of the constant surface viscosity cases with
 $Bq$
equivalent to
 $Bq_{av}$
of the surfactant-concentration-dependent cases. As shown in figure 11(a), the non-uniform distribution of surface viscosity indeed induces a small deviation in drop deformation compared to the constant surface viscosity cases. Nevertheless, most of the effect of
 $\unicode[STIX]{x1D6F1}_{c}^{\ast }$
on drop deformation is due to its effect on the averaged surface viscosity. Accordingly, it is expected that, with
 $\unicode[STIX]{x1D6F1}_{c}^{\ast }$
increasing to
 $\pm \infty$
, the effect of a non-uniform distribution of surface viscosity would vanish and one may recover the drop deformation at
 $Bq_{0}$
. This is because the averaged surface viscosity would continuously approach the extreme (i.e.
 $Bq_{0}$
) with
 $\unicode[STIX]{x1D6F1}_{c}^{\ast }\rightarrow \pm \infty$
. Whereas, the effect of
 $\unicode[STIX]{x1D6F1}_{c}^{\ast }$
on drop deformation would become more complex with
 $\unicode[STIX]{x1D6F1}_{c}^{\ast }\rightarrow$
0. For the
 $\unicode[STIX]{x1D6F1}$
-thickening case,
 $\unicode[STIX]{x1D6F1}_{c}^{\ast }\rightarrow 0$
has a similar effect as
 $Bq_{0}\rightarrow 0$
; that is,
 $D$
increases continuously or even diverges if the drop is unstable in the limit of
 $Bq=0$
for this set of parameters (including
 $Ca$
,
 $Pe_{s}$
and
 $\unicode[STIX]{x1D6FD}$
). In contrast, for the
 $\unicode[STIX]{x1D6F1}$
-thinning case,
 $\unicode[STIX]{x1D6F1}_{c}^{\ast }\rightarrow 0$
has the similar effect as
 $Bq_{0}\rightarrow \infty$
; that is, the drop deformation would continuously approach the extreme of 0.
Effects of surfactant-concentration-dependent surface viscosity on drop deformation under different
 $Pe_{s}$
and
 $\unicode[STIX]{x1D6FD}$
.
 $D$
is plotted as a function of
 $\unicode[STIX]{x1D6F1}_{c}^{\ast }$
for different
 $Pe_{s}$
in (a) and for different
 $\unicode[STIX]{x1D6FD}$
in (b).
 $Ca$
and
 $Bq_{0}$
are set to 0.5 and 1. The dashed line represents the drop deformation for the
 $\unicode[STIX]{x1D6F1}$
-independent case with
 $Bq=1$
at
 $Pe_{s}=1$
and
 $\unicode[STIX]{x1D6FD}=0.8$
. The dot-dashed line represents the deformation of droplets with constant Boussinesq numbers but equivalent to the surface-averaged Boussinesq numbers of the surfactant-concentration-dependent cases of
 $Pe_{s}=1$
. (c) Surfactant concentration
 $\unicode[STIX]{x1D6E4}$
and (d) surface viscosity
 $Bq$
versus the phase angle
 $\unicode[STIX]{x1D6FC}$
are compared between the
 $\unicode[STIX]{x1D6F1}$
-thickening and
 $\unicode[STIX]{x1D6F1}$
-thinning cases under different
 $Pe_{s}$
, where
 $\unicode[STIX]{x1D6F1}_{c}^{\ast }=0.1$
and
 $\unicode[STIX]{x1D6FD}=0.8$
.
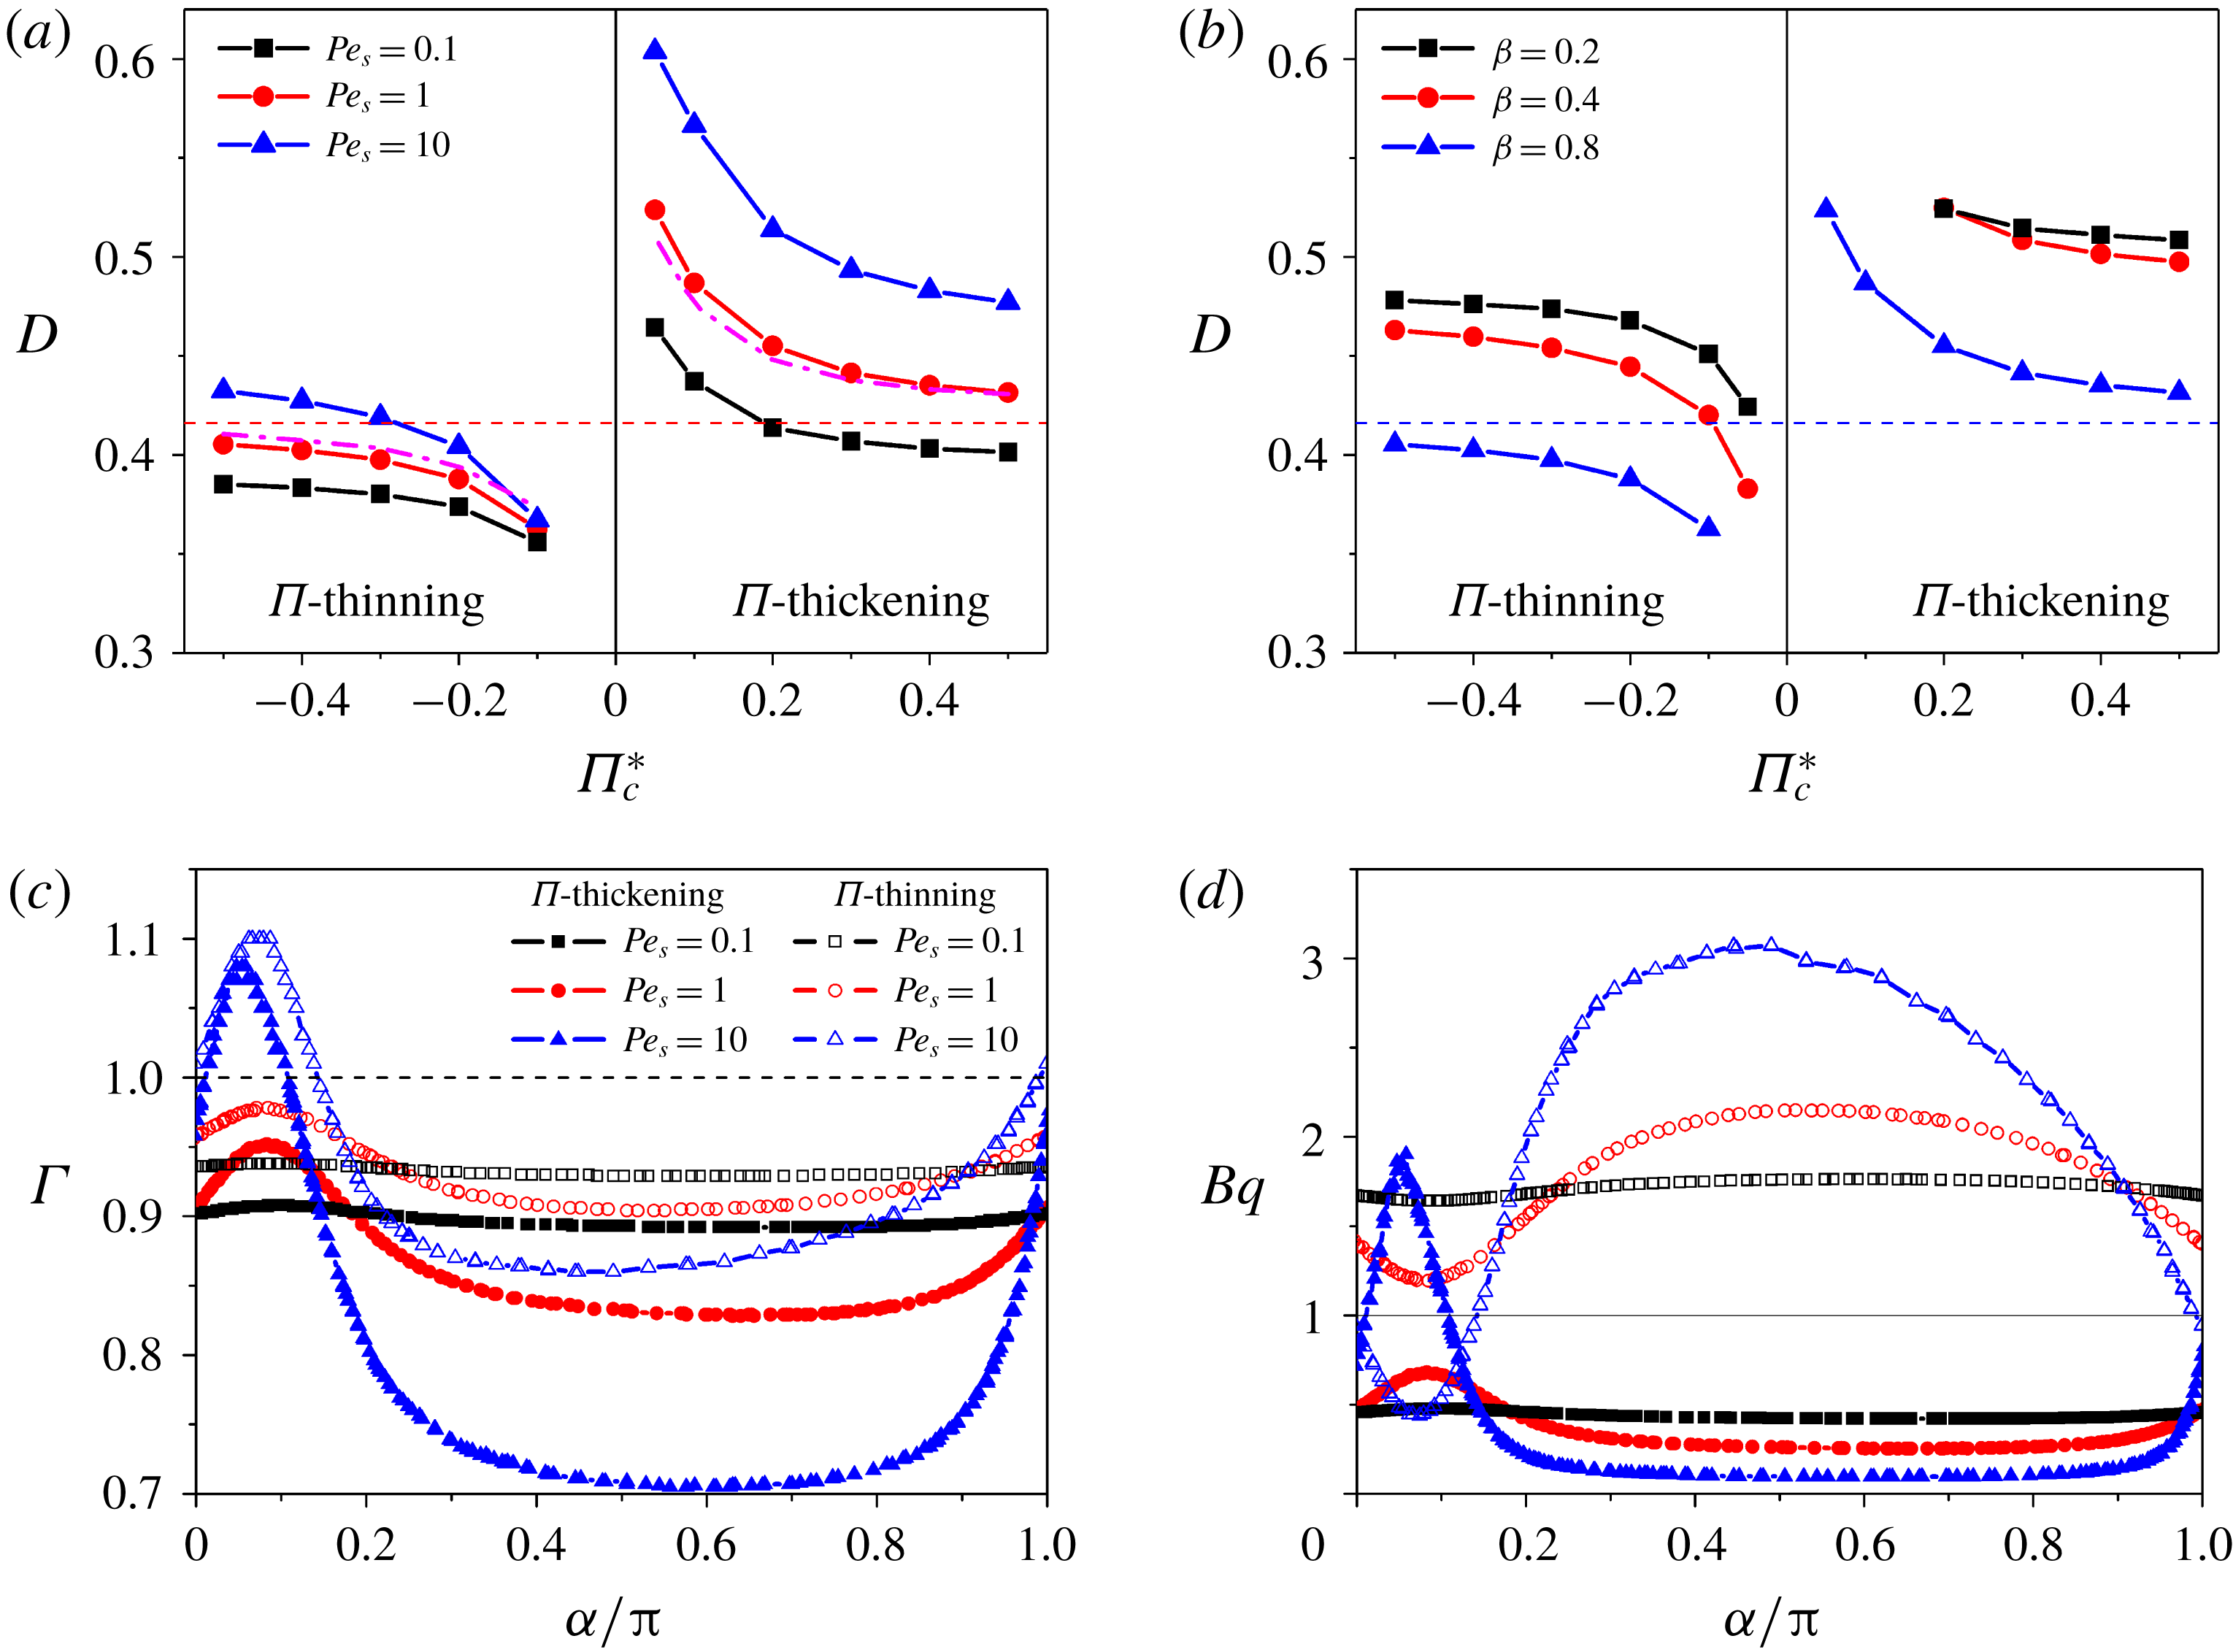
Notably, the surface viscosity strongly depends on local surfactant concentration
 $\unicode[STIX]{x1D6E4}$
, while
 $\unicode[STIX]{x1D6E4}$
is mainly governed by the surface Péclet number
 $Pe_{s}$
and elasticity number
 $\unicode[STIX]{x1D6FD}$
. Therefore, we also study the effects of surfactant-concentration-dependent surface viscosity on drop deformation under different
 $Pe_{s}$
and
 $\unicode[STIX]{x1D6FD}$
. In figure 11(a,b),
 $D$
is plotted versus
 $\unicode[STIX]{x1D6F1}_{c}^{\ast }$
with varying
 $Pe_{s}$
in the range 0.1–10 or varying
 $\unicode[STIX]{x1D6FD}$
in the range 0.2–0.8. At all given values of
 $\unicode[STIX]{x1D6F1}_{c}^{\ast }$
, the drop deformation for both the
 $\unicode[STIX]{x1D6F1}$
-thickening and
 $\unicode[STIX]{x1D6F1}$
-thinning cases increases with increasing
 $Pe_{s}$
or decreasing
 $\unicode[STIX]{x1D6FD}$
. These observed effects of
 $Pe_{s}$
and
 $\unicode[STIX]{x1D6FD}$
are similar to and even more significant than those of surfactant-laden droplets with no surface viscosity (figure 3
b). Notably, as
 $Pe_{s}$
increases from 0.1 to 10, the variation in surfactant concentration over the drop surface is significantly increased since convection gradually becomes dominant over diffusion (figure 11
c). As a result, the difference in surface viscosity between the
 $\unicode[STIX]{x1D6F1}$
-thickening and
 $\unicode[STIX]{x1D6F1}$
-thinning cases is also remarkably enlarged over a large area around the drop equator (figure 11
d). This explains the increasing difference in drop deformation between the
 $\unicode[STIX]{x1D6F1}$
-thickening and
 $\unicode[STIX]{x1D6F1}$
-thinning cases with increasing
 $Pe_{s}$
(figure 11
a). Note that increasing
 $\unicode[STIX]{x1D6FD}$
has a similar effect as decreasing
 $Pe_{s}$
on surface viscosity since increasing the Marangoni stress also tends to eliminate the surfactant-concentration variation. To summarize, surfactant-concentration-induced variations in surface viscosity lead to non-trivial deviations in drop deformation compared to droplets with constant surface viscosity but with no surfactant transport. These deviations are especially obvious at low
 $\unicode[STIX]{x1D6F1}_{c}^{\ast }$
when the surface viscosity is quite sensitive to surfactant concentration variation or at high
 $Pe_{s}$
when the surfactant concentration shows large variations owing to a strong convection effect.
It is necessary to emphasize that the Marangoni stress and surface viscous stress have mutual effects on each other. For the
 $\unicode[STIX]{x1D6F1}$
-independent case (i.e. constant surface viscosity), the presence of surface viscosity tends to eliminate the surface tension gradient, i.e. the shear surface viscosity via suppression of the local convection effect (figure 6) and the dilatational surface viscosity via suppression of the local dilution effect (figure 7). As a consequence, the Marangoni stress is reduced by the surface viscous stress. On the other hand, it is well known that the Marangoni stress also tends to immobilize the drop’s surface and hence the surface velocity gradient is reduced. Accordingly, the surface viscous stress is also decreased by the Marangoni stress, although the surface viscosity is constant. More importantly, when the surface viscosity is dependent on local surfactant concentration, the mutual effect between Marangoni stress and surface viscous stress becomes much more complex. For both the
 $\unicode[STIX]{x1D6F1}$
-thickening and
 $\unicode[STIX]{x1D6F1}$
-thinning cases, the surface viscous stress always tends to suppress the surface tension gradient and hence reduces the Marangoni stress, no matter how large the dimensionless pressure scale is (figure 10
b). However, this is not the case for the influence of the Marangoni stress on the surface viscous stress. For example, the surfactant concentration around the drop equator decreases with increasing
 $Pe_{s}$
while the surfactant concentration gradient increases due to stronger convection (figure 11
c). For the
 $\unicode[STIX]{x1D6F1}$
-thickening case, the surface viscous stress should decrease with increasing
 $Pe_{s}$
, because the local surface viscosity decreases with surfactant concentration (figure 11
d) and the enlarged Marangoni stress tends to lower the surface velocity gradient. However, for the
 $\unicode[STIX]{x1D6F1}$
-thinning case, the surface viscous stress may increase with
 $Pe_{s}$
. This is because the local surface viscosity significantly increases with surfactant concentration (figure 11
d), though the enlarged Marangoni stress still lowers the surface velocity gradient.
Effects of surfactant-concentration-dependent surface viscosity on drop deformation with a nonlinear equation of state used for the
 $\unicode[STIX]{x1D6E4}$
–
 $\unicode[STIX]{x1D70E}$
relation.
 $D$
is plotted as a function of
 $\unicode[STIX]{x1D6F1}_{c}^{\ast }$
under different but large
 $Pe_{s}$
for the
 $\unicode[STIX]{x1D6F1}$
-thickening (a) and
 $\unicode[STIX]{x1D6F1}$
-thinning (b) cases.
 $Ca$
,
 $\unicode[STIX]{x1D6FD}$
and
 $Bq_{0}$
are set to 0.3, 0.8 and 2, respectively. The dashed line in (a) represents the drop deformation of the
 $\unicode[STIX]{x1D6F1}$
-independent case at
 $Pe_{s}=1$
and
 $\unicode[STIX]{x1D6FD}=0.8$
. Surfactant concentration
 $\unicode[STIX]{x1D6E4}$
, surface tension
 $\unicode[STIX]{x1D70E}$
and surface viscosity
 $Bq$
are plotted as functions of the phase angle
 $\unicode[STIX]{x1D6FC}$
for the
 $\unicode[STIX]{x1D6F1}$
-thickening (c) and
 $\unicode[STIX]{x1D6F1}$
-thinning (d) cases.

The dependence of surface tension
 $\unicode[STIX]{x1D70E}$
on local surfactant concentration
 $\unicode[STIX]{x1D6E4}$
is important to determine the Marangoni stress, and it often follows a nonlinear equation of state, especially at high surface coverage of surfactant (Johnson & Borhan Reference Johnson and Borhan1999). Therefore, we next examine the combined effects of surfactant transport and surface viscosity on drop deformation employing a nonlinear equation of state for the
 $\unicode[STIX]{x1D70E}$
–
 $\unicode[STIX]{x1D6E4}$
relation Muradoglu & Tryggvason (Reference Muradoglu and Tryggvason2014):
 $$\begin{eqnarray}\displaystyle \unicode[STIX]{x1D70E}=1+\unicode[STIX]{x1D6FD}\ln (1-x_{co}\unicode[STIX]{x1D6E4}). & & \displaystyle\end{eqnarray}$$
Here,
 $x_{co}=\unicode[STIX]{x1D6E4}_{0}/\unicode[STIX]{x1D6E4}_{\infty }$
is the dimensionless surfactant coverage, which is set to 0.1. Note that, the larger
 $Pe_{s}$
results in a higher local surfactant coverage (figure 11
c). Accordingly, at extremely large
 $Pe_{s}$
, local surfactant coverage may become quite large, though the initial uniform surfactant coverage is low (i.e.
 $x_{co}=0.1$
). Therefore, in figure 12, the drop deformation
 $D$
is plotted versus
 $\unicode[STIX]{x1D6F1}_{c}^{\ast }$
under different large Péclet numbers (i.e.
 $Pe_{s}=1{-}1000$
), while our results for linear and nonlinear equations of state are both presented for comparison purposes. In qualitative terms, the combined effect of surfactant transport and surface viscosity shows the same features for the linear and nonlinear equations of state. For instance, the drop deformation
 $D$
of both
 $\unicode[STIX]{x1D6F1}$
-thickening and
 $\unicode[STIX]{x1D6F1}$
-thinning cases approaches its value for the
 $\unicode[STIX]{x1D6F1}$
-independent case once
 $\unicode[STIX]{x1D6F1}_{c}^{\ast }$
increases to large values, and vice versa. Besides,
 $D$
increases with
 $Pe_{s}$
for both
 $\unicode[STIX]{x1D6F1}$
-thickening and
 $\unicode[STIX]{x1D6F1}$
-thinning cases. Nevertheless, a relatively large difference in
 $D$
is also observed in quantitative terms as the
 $\unicode[STIX]{x1D6E4}$
–
 $\unicode[STIX]{x1D70E}$
relation is changed from linear to nonlinear. More particularly, for all values of
 $\unicode[STIX]{x1D6F1}_{c}^{\ast }$
,
 $D$
is much larger for the nonlinear equation of state. We find that this quantitative difference mainly results from the change in surface tension. As shown in figure 12(c,d), for both
 $\unicode[STIX]{x1D6F1}$
-thickening and
 $\unicode[STIX]{x1D6F1}$
-thinning cases, both surfactant concentration and surface viscosity show small changes between the linear and nonlinear equations of state, while the surface tension is much larger for the linear equation of state. On the other hand, it is noted that although the drop deformation is still increasing with
 $Pe_{s}$
increasing from 10 to 1000, the change is much smaller than that with
 $Pe_{s}$
increasing from 1 to 10. This result indicates that convection becomes dominant over diffusion at
 $Pe_{s}>10$
. Therefore, the results in figure 11 with
 $Pe_{s}$
increasing from 0.1 to 10 show the main features of the effects of
 $Pe_{s}$
on the deformation of droplets with both surface tension and surface viscosity dependent on local surfactant concentration.
3.4 Full three-dimensional shape of surfactant-laden droplets
In this section, we study the combined effect of surfactant transport and surface viscosity on the drop deformation in the third axis (i.e. the drop width in the vorticity direction) and then the full three-dimensional shape of the droplet is also analysed. Note that although the Taylor parameter
 $D$
is widely adopted to characterize drop deformation in the simple shear flow (Li & Pozrikidis Reference Li and Pozrikidis1997; Fischer & Erni Reference Fischer and Erni2007; Gounley et al.
Reference Gounley, Boedec, Jaeger and Leonetti2016), it cannot provide the full three-dimensional picture of the drop shape since it uses only the information of the drop shape in the shear plane (i.e. the major and minor axes
 $L$
and
 $B$
). However, the drop deformation along the vorticity direction is also crucial to grasping the whole picture of the drop shape. Experimental studies (Guido & Villone Reference Guido and Villone1998; Feigl et al.
Reference Feigl, Megias-Alguacil, Fischer and Windhab2007; Vananroye et al.
Reference Vananroye, Janssen, Anderson, Van Puyvelde and Moldenaers2008, Reference Vananroye, Van Puyvelde and Moldenaers2011) have indicated that significant changes in the drop width
 $W$
may occur. Therefore, we then show the effects of the surfactant on the drop width and the full three-dimensional shape in detail.
In figure 13(a), the dimensionless drop width
 $W/R$
is plotted versus the capillary number
 $Ca$
for both clean and surfactant-laden droplets. The presence of a surfactant, especially the inclusion of surfactant-induced surface viscosity, has a significant influence on the drop width. More specifically, at all given values of
 $Ca$
, the consideration of surfactant transport results in larger drop width compared to that of clean droplets, and the inclusion of surface viscosity enlarges the drop width further. In general, as long as the droplet exhibits larger deformation in the shear plane (characterized by the Taylor parameter
 $D$
), it does the same in the third dimension, i.e. in the vorticity direction (characterized by the drop width
 $W/R$
). As such, we plot
 $W/R$
versus
 $D$
in figure 13(b). We surprisingly observe that both surfactant transport and surface viscosity have little effect on the relationship between
 $W/R$
and
 $D$
compared to clean droplets. Notably, in figure 13(b), all data points from our simulations collapse onto a single curve, that is
 $W/R=1-D^{2}$
. More particularly, data for five different configurations fall onto this same curve, including a (i) clean droplet, (ii) droplet with constant surface viscosity but with no surfactant transport, (iii) droplet with surfactant transport but with no surface viscosity, (iv) droplet with surfactant transport and a constant surface viscosity and (iv) droplet with surfactant transport and a surfactant-concentration-dependent surface viscosity. Further, we compare the curve
 $W/R=1-D^{2}$
with experimental data from previous studies (Guido & Villone Reference Guido and Villone1998; Vananroye et al.
Reference Vananroye, Janssen, Anderson, Van Puyvelde and Moldenaers2008, Reference Vananroye, Van Puyvelde and Moldenaers2011), as shown in figure 13(c). Excellent agreement is observed for both clean droplets and surfactant-laden droplets. Besides, the results from small deformation analysis by Mandal et al. (Reference Mandal, Das and Chakraborty2017) for surfactant-laden droplets are also presented for comparison. It is observed that our curve also shows good agreement with the analytical results, especially when the drop deformation is small (i.e.
 $D<0.15$
). While, the small deformation analysis predicts a lower
 $W$
than our curve and the difference becomes larger at high
 $D$
, which can be also found in figure 3(a). Nevertheless, the relative error between our results and Mandal’s analytical results is limited to less than 9 % for all cases. These results indicate that the drop deformations in the shear plane and along the vorticity direction are actually linked to each other in a specific relationship. Besides, surfactants have little effect on this relationship, although they tend to alter the drop deformation significantly.
Full three-dimensional drop shape is analysed for droplets with a clean surface, surfactant-laden surface with or without surface viscosity. (a) The drop width
 $W/R$
in the vorticity direction is plotted as a function of
 $Ca$
. (b)
 $W/R$
is plotted as a function of the Taylor deformation parameter
 $D$
. Note that all data points (i.e. 315 points in total) from our numerical simulations are included. A fitting curve (i.e.
 $W/R=1-D^{2}$
) exhibits an excellent agreement with these numerical data. (c) The fitting curve of
 $W/R=1-D^{2}$
also agrees quite well with experimental data from previous studies (Guido & Villone Reference Guido and Villone1998; Vananroye et al.
Reference Vananroye, Janssen, Anderson, Van Puyvelde and Moldenaers2008, Reference Vananroye, Van Puyvelde and Moldenaers2011) for both clean and surfactant-laden droplets. The result from the small deformation analysis of Mandal et al. (Reference Mandal, Das and Chakraborty2017) is also included. (d) The full three-dimensional shape of two examples of highly deformed droplets from our numerical simulations (e.g. the surface with contours) agrees well with the ellipsoidal shape described by (3.3) indicated by the three red solid lines. Here,
 $Ca$
,
 $Pe_{s}$
,
 $\unicode[STIX]{x1D6FD}$
,
 $Bq_{0}$
and
 $\unicode[STIX]{x1D6F1}_{c}^{\ast }$
are 0.5, 1, 0.8, 1 and 0.1, respectively. The colour contours on the drop surface represent the prediction error, which is the relative error between the ellipsoidal shape (i.e. equation (3.3)) and the shape obtained from numerical simulation. The three principal axes of the ellipsoidal shape described by (3.3) are
 $L/R=1/(1-D)$
,
 $W/R=1-D^{2}$
and
 $B/R=1/(1+D)$
, respectively. Note that, the prediction error averaged over the entire drop surface is only 0.6 % and 0.4 % for the
 $\unicode[STIX]{x1D6F1}$
-thickening and
 $\unicode[STIX]{x1D6F1}$
-thinning examples in (d), respectively.

Finally, we analyse the three-dimensional shape of surfactant-laden droplets in a simple shear flow. Since there is no mass transfer across the drop surface, the drop volume remains constant:
 $$\begin{eqnarray}\displaystyle \frac{L}{R}\frac{W}{R}\frac{B}{R}=1. & & \displaystyle\end{eqnarray}$$
Besides, we have the definition of
 $D$
as
 $(L-B)/(L+B)$
and the relation
 $W/R=1-D^{2}$
(figure 13
b). Accordingly, we can obtain the lengths of the three principal axes as functions of
 $D$
:
 $$\begin{eqnarray}\displaystyle \frac{L}{R}=\frac{1}{1-D},\quad \frac{W}{R}=1-D^{2},\quad \frac{B}{R}=\frac{1}{1+D}. & & \displaystyle\end{eqnarray}$$
Further, the three-dimensional shape of the deformed droplet as an ellipsoid can be given by:
 $$\begin{eqnarray}\displaystyle \frac{x^{2}}{[1/(1-D)]^{2}}+\frac{y^{2}}{(1-D^{2})^{2}}+\frac{z^{2}}{[1/(1+D)]^{2}}=1. & & \displaystyle\end{eqnarray}$$
By comparing with our simulations, we can quantitatively characterize the deviation of the drop’s three-dimensional shape from the ellipsoid described by equation (3.11). In figure 13(d), we show the contour of the prediction error over the entire drop surface for two typical examples with modest or large deformation. It is observed that the maximum error over the entire drop surface is lower than 2.5 % for both cases. In fact, for all of our 315 data points of clean and surfactant-laden droplets, the prediction error averaged over the drop surface is lower than 2 % (data not shown). These results indicate that the ellipsoidal shape described by (3.11) with only one unknown variable can predict the steady-state three-dimensional shape of the deformed droplet in a simple shear flow very well, no matter whether the droplet is covered with surfactants or not, and no matter whether the drop surface has a surface viscosity or not.
4 Conclusion
We present a numerical study on the dynamics of an insoluble surfactant-laden droplet in a simple shear flow. Of particular interest are the effects of surface viscosity depending strongly upon local surfactant concentration on the deformation of the whole droplet. This work is realized via a front-tracking finite-difference method that we previously developed for membrane-enclosed droplets (Luo et al. Reference Luo, He and Bai2015; Luo & Bai Reference Luo and Bai2016, Reference Luo and Bai2018). Here, the convection–diffusion equation is solved to consider surfactant transport on the deforming drop surface, and the Boussinesq–Scriven constitutive law is integrated to model the complex rheology of the drop’s surface, i.e. surfactant-concentration-dependent surface viscosity and surface tension. In addition to our previous verification on the dynamics of membrane-enclosed droplets, our numerical method is further validated by comparison with reported data on the deformation of clean droplets and surfactant-laden droplets when considering either surface viscosity or surfactant transport only (Li & Pozrikidis Reference Li and Pozrikidis1997; Komrakova et al. Reference Komrakova, Shardt, Eskin and Derksen2014; Gounley et al. Reference Gounley, Boedec, Jaeger and Leonetti2016).
Our results show that the surfactant-concentration-dependent surface viscosity has a non-trivial effect on drop deformation in general, although this effect may become negligible when the Boussinesq number (
 $Bq=\unicode[STIX]{x1D707}_{s}/\unicode[STIX]{x1D707}R$
) is quite small, e.g.
 $Bq<0.1$
. Note that, in real applications, the Boussinesq number could turn out to be much larger than 0.1, since the changes of both surface viscosity and drop size may cover several orders of magnitude. Zell et al. (Reference Zell, Nowbahar, Mansard, Leal, Deshmukh, Mecca, Tucker and Squires2014) presented experimentally results showing that the shear surface viscosity (i.e.
 $\unicode[STIX]{x1D707}_{s}$
) of a variety of soluble surfactants is lower than
 $10^{-2}~\unicode[STIX]{x03BC}\text{N}~\text{s}~\text{m}^{-1}$
. For a typical bulk fluid viscosity (i.e.
 $\unicode[STIX]{x1D707}$
) of
 $10^{-3}~\text{Pa}~\text{s}$
, the effects of surface viscosity on drop deformation can be neglected for droplets larger than
 $10~\unicode[STIX]{x03BC}\text{m}$
. In contrast, more studies have reported a surface shear viscosity several orders of magnitude higher than
 $10^{-2}~\unicode[STIX]{x03BC}\text{N}~\text{s}~\text{m}$
(Zell et al.
Reference Zell, Nowbahar, Mansard, Leal, Deshmukh, Mecca, Tucker and Squires2014). Besides, the surface viscosity for insoluble surfactants is usually higher than that for soluble surfactants (Kim et al.
Reference Kim, Choi, Zell, Squires and Zasadzinski2013; Langevin Reference Langevin2014; Ponce-Torres et al.
Reference Ponce-Torres, Montanero, Herrada, Vega and Vega2017). Therefore, in general, the effects of surface viscosity need to be considered for droplets with a micro-to-millimetre size.
Considering the importance of interfacial stresses (i.e. surface tension, Marangoni stress and surface viscous stress) on droplet dynamics, we summarize the relevant dimensionless parameters, including the capillary number
 $Ca$
, the elasticity number
 $\unicode[STIX]{x1D6FD}$
, the surface Péclet number
 $Pe_{s}$
, the Boussinesq numbers based on the shear (
 $Bq_{s}$
) and dilatational (
 $Bq_{d}$
) surface viscosities. Besides, there are many other complexities, e.g. concentration dependence of surface viscosities and nonlinear
 $\unicode[STIX]{x1D70E}$
–
 $\unicode[STIX]{x1D6E4}$
relationship. It is necessary to give a simple summary on the separate, qualitative effect of each parameter on drop dynamics in shear flow as follows: (i) low
 $Ca$
stabilizes the drop, i.e. decreases drop deformation and inhibits drop breakup; (ii) low
 $\unicode[STIX]{x1D6FD}$
destabilizes the drop, i.e. increases drop deformation and promotes drop breakup, but only at high
 $Ca$
; (iii) low
 $Pe_{s}$
stabilizes the drop; (iv) increasing
 $Bq_{s}$
stabilizes the drop, especially when the drop exhibits large deformation, e.g. at high
 $Ca$
; and (v) increasing
 $Bq_{d}$
destabilizes the drop. The qualitative effects of these dimensionless parameters were also demonstrated in previous studies where they were studied in isolation. In this study, particular interest is focused on how the coupling of surface tension, Marangoni stress and surface viscous stress affects the drop dynamics in shear flow. According to our numerical results, this coupling does not change the separate effect of those dimensionless parameters in qualitative terms, while it indeed induces significant changes in quantitative terms.
Next, we discuss whether and under what conditions the specific rheological properties (e.g. Marangoni stresses and surface viscous stresses) of surfactant-laden surfaces should be accounted for in the study of drop dynamics in shear flow. By taking surfactant transport and surface viscosity into account together, we find that the interaction between Marangoni stress and surface viscous stress induces non-negligible deviations in drop deformation compared to studies where only surface viscosity or surfactant transport is considered. For example, the deviation in the prediction of drop deformation may become as high as 10–20 % (figure 5), which may lead to an error of more than 50 % in surface viscosity measurement based on the drop-deformation information (Flumerfelt Reference Flumerfelt1980; Phillips et al.
Reference Phillips, Graves and Flumerfelt1980). Besides, the neglecting of surfactant transport may generate a deviation of more than 100 % in the prediction of the critical capillary number for drop breakup (figure 8). Nevertheless, when the Boussinesq number is quite large, e.g.
 $Bq>10$
(for example, droplets with quite small sizes), the effects of surfactant transport on drop deformation can be neglected while the surface viscous stress plays the dominant role. In this case, the model by Gounley et al. (Reference Gounley, Boedec, Jaeger and Leonetti2016) considering surface viscosity but neglecting surfactant transport can predict the drop deformation well. Moreover, recent experiments have demonstrated that the surface viscosity for most insoluble surfactants depends strongly on surfactant concentration (Kim et al.
Reference Kim, Choi, Zasadzinski and Squires2011, Reference Kim, Choi, Zell, Squires and Zasadzinski2013; Hermans & Vermant Reference Hermans and Vermant2014; Samaniuk & Vermant Reference Samaniuk and Vermant2014). Our results show that surfactant-concentration-induced variations in surface viscosity lead to significant changes in drop deformation, especially at a low dimensionless pressure scale (e.g.
 $\unicode[STIX]{x1D6F1}_{c}^{\ast }<0.2$
) when the surface viscosity is quite sensitive to surfactant-concentration variations. For example, for high Péclet numbers when the surfactant concentration shows large variations, the neglecting of the surfactant-concentration-induced variation in surface viscosity may generate a deviation larger than 30 % in the prediction of drop deformation (figure 11), although both surface viscosity and surfactant transport are taken into account. Notably, as a typical example of a surfactant system, previous experiments have shown that the surface-pressure scale
 $\unicode[STIX]{x1D6F1}_{c}$
for the ubiquitous phospholipid dipalmitoylphosphatidylcholine (DPPC) can be as low as
 $6~\text{mN}~\text{m}^{-1}$
(Kim et al.
Reference Kim, Choi, Zasadzinski and Squires2011, Reference Kim, Choi, Zell, Squires and Zasadzinski2013; Manikantan & Squires Reference Manikantan and Squires2017) and hence the dimensionless pressure scale
 $\unicode[STIX]{x1D6F1}_{c}^{\ast }$
may become lower than 0.2. Accordingly, it is of great importance to account for the effects of surfactant-concentration-dependent surface viscosity in the study of the dynamics of surfactant-laden droplets in shear flows. More importantly, we find both shear and dilatational surface viscosities tend to eliminate the surfactant-concentration gradient, though the underlying mechanisms are entirely different, i.e. inhibiting convection and dilution respectively. This knowledge could be particularly important in the analysis of surfactant distribution and transport during different drop dynamics and motion, for example, the accumulation of surfactants on a satellite droplet during the breakup of a pendant drop (Ponce-Torres et al.
Reference Ponce-Torres, Montanero, Herrada, Vega and Vega2017).
It should be noted that no exchange of the surfactant is considered between the drop surface and the bulk fluid in the present study. The surfactant transport becomes much more complex for the soluble case, which is generally governed by convection/diffusion in the bulk fluid, the adsorption/desorption between the drop surface and the bulk fluid and convection/diffusion on the drop surface (Johnson & Borhan Reference Johnson and Borhan2003). If the adsorption/desorption is quite slow, the effect of surface viscosity and surfactant transport on drop deformation approaches the analysis in this study for an insoluble surfactant. In contrast, if the adsorption/desorption is rather fast and at the same time the diffusion in the bulk fluid plays a dominant role, the surfactant concentration tends to be constant over the entire drop surface. Under this condition, the analysis by Gounley et al. (Reference Gounley, Boedec, Jaeger and Leonetti2016) with constant surface viscosity is sufficient to capture the effects of surface viscosity on drop deformation. However, in most practical cases, convection/diffusion in the bulk fluid and on the drop surface, and the surfactant exchange between the bulk fluid and the drop surface, are all important to determining the local surfactant concentration and surface viscosity, and these need comprehensive study in the future.
We also study the full three-dimensional shape of surfactant-laden droplets in a simple shear flow, and find that the drop shape can be described as an ellipsoid determined by (3.11) with only one unknown variable. Although it is a phenomenological equation obtained via fitting our numerical data, we believe that it is an important supplement to the understanding of the whole picture of drop deformation in shear flows. Previously, by comparing the drop projections along two perpendicular views with two ellipses, Guido & Villone (Reference Guido and Villone1998) have demonstrated experimentally that clean droplets deform into an ellipsoidal shape. In this study, by comparing the drop shape contour with an ellipsoidal shape over its three-dimensional surface, we confirm that the deformed shape of surfactant-laden droplets is also an ellipsoid. Accordingly, we can use only the three principal axes to characterize the whole picture of the drop shape. In experiments (Guido & Villone Reference Guido and Villone1998; Feigl et al. Reference Feigl, Megias-Alguacil, Fischer and Windhab2007; Vananroye et al. Reference Vananroye, Janssen, Anderson, Van Puyvelde and Moldenaers2008, Reference Vananroye, Van Puyvelde and Moldenaers2011), to capture the three principal axes, two cameras are needed to take images along two perpendicular directions (i.e. velocity gradient and vorticity axis). However, our results show a surprising finding that the three principal axes are actually linked to each other as (3.10), with which one camera may be sufficient to analyse the fully three-dimensional shape of the deformed droplet. Besides, it is known that the adsorption of surfactants and their concentrations on a drop’s surface significantly alter drop deformation owing to the effects of surface tension alteration and surface viscosity. However, we surprisingly observe that the relationships among the three principal axes show little change and can always be described as (3.10), no matter whether surfactant transport or surface viscosity is considered or not. These findings could be helpful for the development of simplified phenomenological models predicting drop deformation in shear flows and for the understanding of the interplay between shear flow, drop morphology and emulsion rheology (Maffettone & Minale Reference Maffettone and Minale1998; Minale Reference Minale2010).
Acknowledgements
This work was supported by the National Science Fund for Distinguished Young Scholars of China (Grant No. 51425603) and the Young Scientists Fund of the National Natural Science Foundation of China (Grant No. 51606146).



