Introduction
While the search for extraterrestrial primitive life is continuing constantly based on the biological foundations of astrobiology, studies of extraterrestrial intelligence (ETI) goes on mainly considering astrophysics and astro-engineering principles. Possible civilizations which might have previously reached a high level of development by Kardashev scale could be using various celestial objects in the universe as their own energy sources. For instance, such energy sources could be stars, white dwarfs, neutron stars and black holes. The property to be considered for advanced civilizations likely to use these celestial bodies which offer energy to be consumed in different ways would be what kinds of megastructures to be designed and used and how they could be detected.
Civilizations that could install such megastructures on nearby stars or compact objects, including the central star of their own planetary systems, have to be at least Type-II with an energy consumption of 4 × 1033 erg s−1 based on the Kardashev scale (Kardashev, Reference Kardashev1964). The first theory of megastructures that relevant civilizations of Type-II and higher levels could be established was proposed by Dyson (Reference Dyson1960). The basic prediction about this giant theoretical shell called the Dyson sphere with an artificial habitat on it is whether it would appear in the infrared region and whether it would not appear in the visible spectrum. The first form of the theory was that a sphere had a planetary orbit-size diameter, which would be extremely difficult and inefficient. Any substance cannot be currently imagined which could withstand stress on this type of rigid structure. Even if it was a brand new substance, it would have to be obtained in very large quantities. Even for a solid Dyson sphere with an inner radius as far as the average distance of Mercury to the sun and a shell thickness of only 10 m, approximately 4.2 × 10²³ m3 material would be required. Such an amount is more than what is in all objects in our solar system. Of course, the sphere could be reduced with more special items called completely fictious but different problems would then arise. An artificial habitat could never be imagined or even so, the structure would be completely unstable (DeBiase and Enterprises, Reference DeBiase and Enterprises2008; Shaw et al., Reference Shaw, Tudor and Winkworth2012; Osmanov and Berezhiani, Reference Osmanov and Berezhiani2019). From the results of Wright (Reference Wright2020), it is clear that those kinds of spherical monolithic structures cannot maintain their presence against catastrophic buckling due to the insufficiency of their elastic modulus, which is needed in the order of 1013 GPa, exceeding the elastic modulus of the strongest known material, carbyne on Earth by nine orders of magnitude.
A multiparticle system with swarming behaviour instead of a Dyson sphere could be said to be more efficient than any rigid structure is. Even mankind could build the system called Dyson swarm in a not too distant future. To build this type of structure, it seems necessary to place the material whose amount could form one or more planets or asteroids around the central object so that it could store or directly reflect radiative energy (Carrigan, Reference Carrigan2009; Zackrisson et al., Reference Zackrisson, Korn, Wehrhahn and Reiter2018). Autonomy in manufacturing, mining and transportation is not supposed to be a problem for a more developed civilization than ours. However, with the design of a system by which parts to form the swarm could be built and reproduced by themselves, a more effective way in which a large number of stars could be reached to build megastructures could be considered.
Von Neumann probes are self-replicating spacecrafts (Von Neumann, Reference Von Neumann1966). These unmanned spacecrafts are theoretically the machines that could duplicate themselves while travelling between star systems thereby increasing their population during the journey. If an analogy has been made to the current technology of ours, a technology could be considered in which three-dimensional printers which could construct their own parts and counterparts might use any sort of baryonic matter. A civilization might have the ability to project such a probe, which must have been very advanced in material science, nanofabrication and automation techniques based on artificial intelligence. Large-scale space operations such as spreading through a galaxy, terraforming planets and asteroid minings could be best handled using those kinds of probes. Considering some plausible physical characteristics of the von Neumann probes (Osmanov, Reference Osmanov2019), spherical ones could be considered primarily in a symmetrical manner. The mass of a probe has been therefore as follows:

where r is the radius, ρ is the density and ξ is the fraction of the material from which the probe could grow and self-replicate itself. If the effective area of a spherical probe where it could collect material as it moves through the interstellar space has been thought as a circle for the mass gaining rate of the probe,

could be written with m 0 being an average molecular mass in the medium, hence hydrogen atoms, n is the average density of particles cm−3 and βc product corresponds to a certain fraction (0 ≤ β ≤ 1) of the speed of light. The time needed for the probes to self-replicate after reaching a certain size, if they have been modelled as if mitotically dividing bacterial population (Vandermeer, Reference Vandermeer2010), to accumulate mass up to M, $\tau = \displaystyle{M \over {\hbox{d}M/\hbox{d}t}}$ could be written as

The total number of probes would double over a period of one generation. Specific initial parameters and critical values for the probes sent from the starting point could be determined according to the way that the probes are used. Populations after a certain time t have been calculated below

where N 0 is the initial population of probes.
The purpose of the study is to develop some basic ideas on how Von Neumann probes could be used to generate energy by creating Dyson swarms. In section ‘Probes around stars’, the behaviour of the probes around the main sequence stars has been studied. In the section ‘Network model of diffusing probes in a local neighbourhood’, it has been investigated in the weighted star graph topology how we could spread from our solar system to our local environment if we reached the required technology. Finally, the paper ends in discussion and conclusion.
Probes around stars
Unlike a Dyson sphere, a Dyson swarm could consist of a living habitat, satellites and energy collectors. This study has emphasized the structure in which wireless energy could be transmitted between individual components and reflected to the main collector by focusing only on the part to obtain energy. It is considered that the swarm elements around a celestial object are likely to emit high energy which could be collected by von Neumann probes to work on the principle that it is transmitted to a main collector near the swarm system. It has also been accepted that any civilization has taken energy from those main collectors by means of any transportation methods and added it to their comsumption rates.
The fact that the probes could turn into large swarms while travelling in interstellar space suggests the idea of whether they could first enfold the main sequence stars. The number of probes required for this and the geometry of the system could be determined according to some initial conditions considering equation (3) for spherical probes as follows; since the probes would be very small when they are made of relatively light materials and set off ρ = 0.4 g cm−3 (normalized by the density of graphene), r = 0.1 mm, since some fraction of the material to form it would be a self-replicator one ξ = 0.1, since the density of the dense interstellar medium relative to the hydrogen element n = 104 cm−3 (Herbst, Reference Herbst2001), m 0 = m H and since the average speed of the probes has been accepted as 1% of the speed of light, β = 0.01 could be taken into account. Based on the value of the speed of light in millimeters per second, the following equation for timescale of replication could therefore be achieved (Osmanov, Reference Osmanov2020).

If we consider that N 0 = 100 probes would move in a dense medium with 1% of the speed of light from a host planet, the probe population would become 2.3 × 1039 due to equation (4) in a distance between our solar system and Proxima Centauri (4.22 ly). Another quantity as important as the population of the probes sent in order to gain from an energetic star-like celestial object is their size. The probes with radii of 0.1 mm might have grown to very large numbers by replication. Accordingly, their population growth must be stopped and they need to be enlarged in size, because even if they had a population of 1039, the surface area of each would be insufficient to obtain and process the emitted energy of a star. Hence, for the numerical value of the radius to be reached for each probe, the total solar cell area of ISS is supposed to be 2500 m2 (Diaz, Reference Diaz2000) and the target radius has been considered r = 20 m since the effective area of the spherical probe is a hemisphere.
For a stellar region, if the particle density is supposed to be up to a million atoms cm−3, it would take about 6750 years for the radius of a probe to reach 0.1 mm to 20 m as given in equation (3). Much longer times might be naturally required for a civilization at lower particle densities or a Type-II civilization could shorten the time problem of probe size growth using different methods not mentioned in this study. Probes that could reach a population with the order of 1039, even in a four light year distance must first have an organized swarming behaviour in order to enfold a star as a very large cluster (Li, Reference Li2015; Witkowski and Ikegami, Reference Witkowski and Ikegami2016). A neural network which grows with the population would possibly have more importance when the swarm enfolds the star. For instance, probes could enfold the star in two different ways and adjust themselves to the cases where they would spend the least energy. The first is the motion in circular orbits with different rotation axes at the same distance and second the motion in circular orbits of different rotation axes at different distances. In both enfolding scenarios, instead of flocking or scattering, the milling motion complies with orbital dynamics (Kolon and Schwartz, Reference Kolon and Schwartz2018). In fact, the probe clusters would enfold the central body, creating different circles of rotational axes, especially if there is a closeness between the swarm and star with tidal interactions which make the orbit circular. If a single orbit of a perfect mill is considered, N probes having position xi and velocity vi with a schooling force (fi) (i = 1, 2, …, N) between each other move around a circle of radius R with constant angular velocity w and equally spaced at distance d (Fig. 1). The sector angle (θ) between each position is 2π/N.
Schematic diagram of an orbital milling motion. Here f t and f c are components of the schooling force.

The general form of equation of milling motion (Lukeman et al., Reference Lukeman, Li and Edelstein-Keshet2009) could be as

where ai is the autonomous self-propulsion force, γv i the damping force with drag coefficient γ and m the mass of probes identical with each other. ai force occurs because the probes would accelerate while collecting matter. While the star has been enfolded, the probes are to be reduced to a constant speed necessary to remain in the orbit by exerting little energy, in which case there would not be any self-propulsion force and linear acceleration, since the movements of probes are to be examined when they come into orbit of the object. Once ${\dot{\bi v}}_i = {\bi a}_i = 0$ , equation (6) turns out,

Equation 7 assures the absolute distance and tangential velocity of probes constant. It is also clear that the contribution to schooling force results from the ft component. Considering fc with centripetal acceleration and centripetal acceleration due to gravity, we could deduce the following:

where $g_{\scale 60% \bigoplus}$ and $R_{\scale 60% \bigoplus}$
 are surface gravity and radius of the central body, respectively. With T is the period of rotation, v = 2πR/T thus

In addition to d = 2Rsin(θ/2) and arc length between probes s = Rθ, one could derive the time difference, s/v between probe positions as follows:

The ratio of period to time difference would also give the number of probes in the milling orbit.
Given the first form of enfolding including n, the total number of orbits of the swarm, the number of probes in an orbit is π/sin −1(nd/2R). Now that the circular orbits are equidistant from the central body, the distance between the probes (d) expands as the number n increases so that collisions be prevented between autonomously rotating probes at the intersection regions of their orbits. The total number of probes in the swarm for a given d value is given by

which is independent of the number of orbits. For the second enfolding structure, the number of probes in an orbit changes with R in a way that the d value remains constant since the orbits would not have intersection regions. Where the radius difference of the orbits is k times the distance between the probes, the total number of probes in swarm could be written as

where k ∈ Z + and ξ is an integer for counting n. To examine the results numerically, swarms enfolded around an average-sized red dwarf have been considered.
A red dwarf star with $R_{\scale 60% \bigoplus} = 0.27R_{\scale 60% \bigoplus}$ is thus considered and $R = 3R_{\scale 60% \bigoplus}$
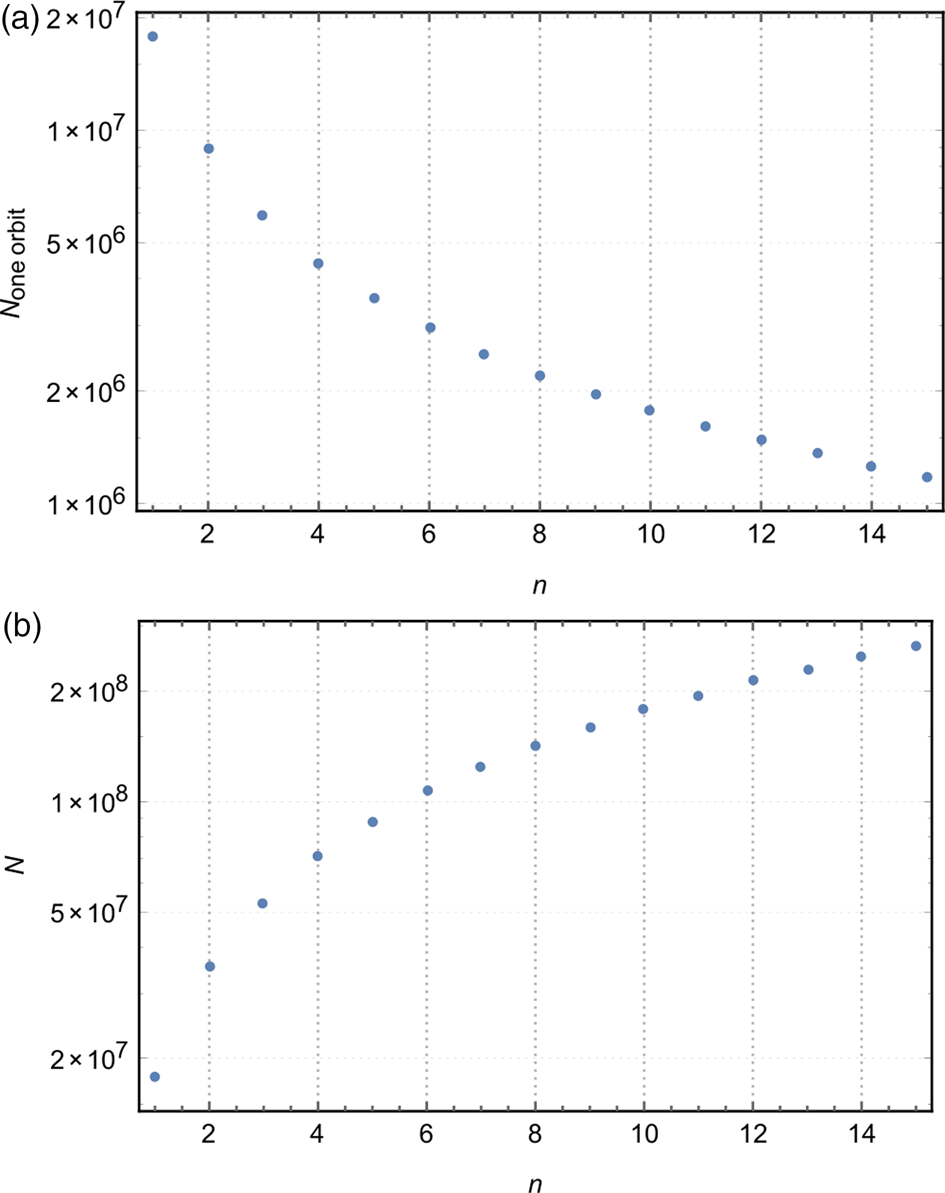
 for the first milling orbit. Graphs of the number of probes per orbit for the first enfolding type and the total number of probes in the swarm for the second enfolding type have been presented based on r = 2 × 103 cm, d = 10r and maximum n = 15.
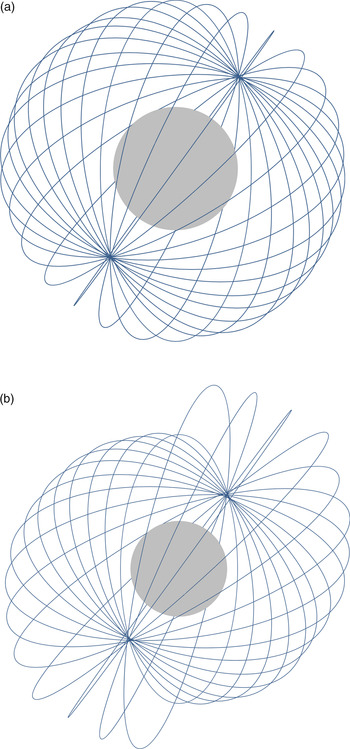
From Fig. 2, it is clear that a swarm is possible thanks to the second enfolding which could make more energy emission since more probes could be included in the system. Demonstrations of the two types of enfoldings have also been illustrated in Fig. 3 and a possible Dyson swarm could be the second type in basic logic but nevertheless the perturbation on the probes should also be examined (Burns, Reference Burns1976). There would be no eccentricity variations primarily due to circular orbits. For the probes considered very small spheres relative to the central object, precession and obliquity variations could also be neglected. The attraction that each probe is likely to cause inclination variation to be affected due to the pile of others cannot be neglected but would only be balanced with a neural network between them. In a mathematical sense, such an attraction could be a contribution to the fc component of the schooling force for Fig. 3a

where uc is a radially directed unit vector. The probes moving at the same distance to the star at the centre would be at the same speed and stationary relative to each other. However, for swarms in Fig. 3b, the schooling force is more complicated as follows:

where the first term is ft and the second term fc. The attraction between the probes in the third term would depend entirely on time as the speeds are different and the distances between them change constantly. Balancing this type of perturbative additives with the neural network between the probes, i.e. mathematically neglecting it, could be suggested to make simple approaches to the model but it does not seem to be possible for the system to move completely autonomously since energy would be required, even if negligible, to maintain the order. In conclusion, security of swarm system has to be based on avoidance of the Kessler cascade (Kessler et al., Reference Kessler, Johnson, Liou and Matney2010).
For the 15 orbits with an angle of 24° between the rotational axes of orbits (a) number of probes for each orbit of orbits of the same size, (b) total number of probes of the swarm whose orbital radii grow as the angle changes.

Schematic representation of (a) equally sized, (b) angle-dependent growing orbit trails around the star, for n = 15. Note that, once again $R = R_{min} = 3R_\scale 60% \bigoplus$ .

Observational evidences of swarms
While the probes move in the interstellar medium due to the population growth mechanism, they accelerate as they multiply with the collected protons. Consequently, the total luminosity of the resultant and progressing cluster system was given by Osmanov (Reference Osmanov2019).

where κ is a dimensionless lengthscale of acceleration and e the charge of an electron. For moving and self-replicating probes, almost all observational fingerprints are caused by the concept in equation (15). Since Dyson swarms have always been searched, based on the suggestions and explanations on their existence (Bodman and Quillen, Reference Bodman and Quillen2016; Schuetz et al., Reference Schuetz, Vakoch, Shostak and Richards2016) except for the moving probes, it could be considered how the classic stellar dimming could be on the observability of the swarms created by the probes moving in the orbit at constant speeds. The related basic assumptions could be determined as follows; the probes would be in circular orbit, the stellar intensity is uniform across the stellar disc, that is, the stellar limb darkening could be neglected and the probes would be dark relative to the central star. A very important parameter for stellar dimming is the transit depth. $L_{\scale 60% \bigoplus} = \pi R_{\scale 60% \bigoplus} ^2 F_{\scale 60% \bigoplus}$ could be written for the luminosity of a star with radius $R_{\scale 60% \bigoplus}$
 and stellar flux $F_{\scale 60% \bigoplus}$
 , which could be thus written for the transit depth as follows:

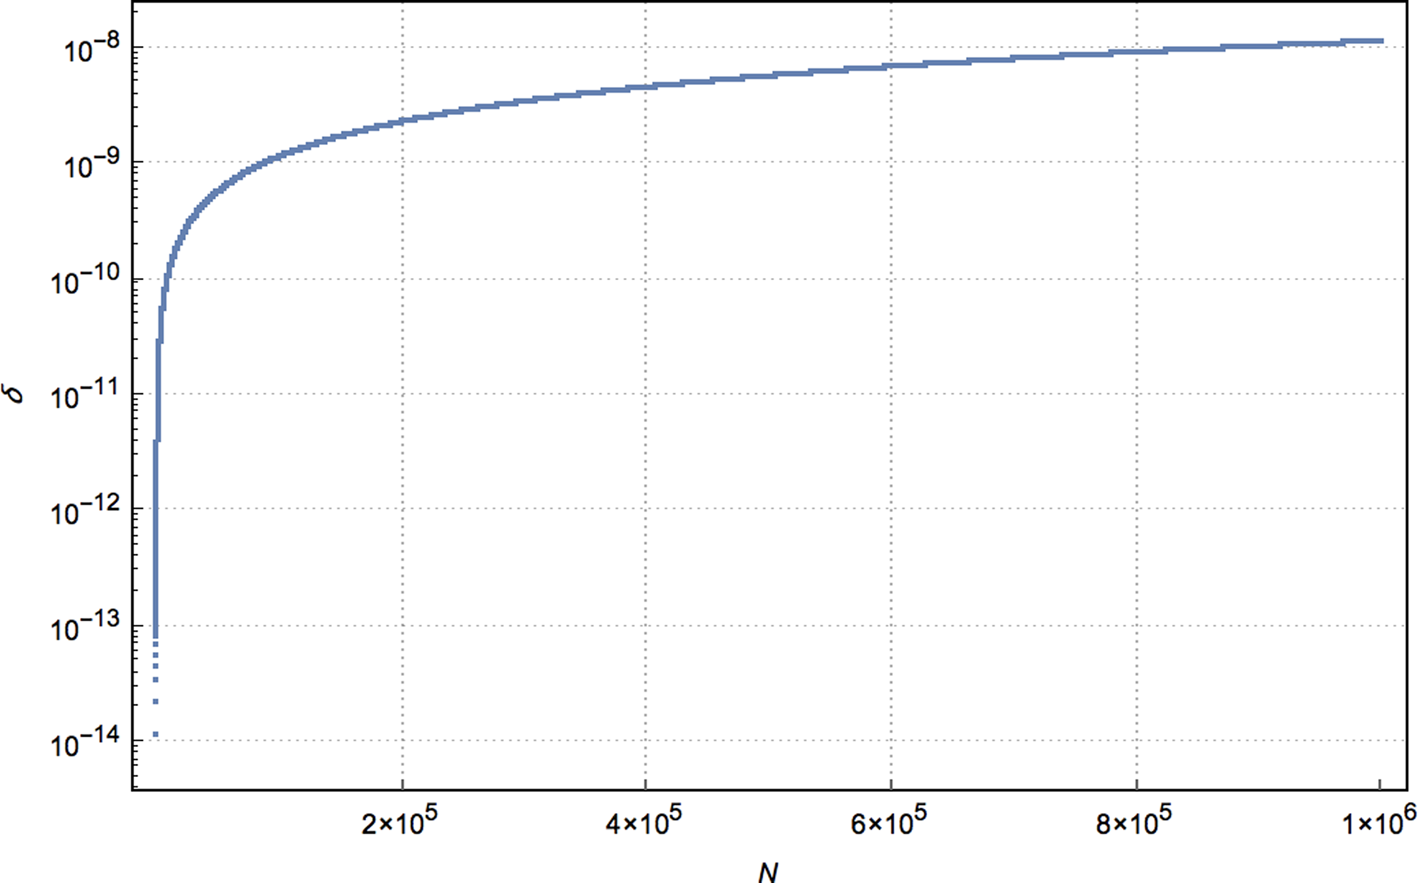
where $L_{{\scale 60% \bigoplus} \comma p} = N\pi r^2F_{\scale 60% \bigoplus}$ is the luminosity within the transition of probes. Nπr 2 means the total blocked area of the star created by the probes. There is also transition continuity in Dyson swarm systems in that one probe starts leaving and the other starts occultation. That is, there is always duration of the transit and the continuous graph of transit depth turns into the star's luminosity−time graph itself. Figure 4 shows how the second type of swarm around an average red dwarf with $R_{\scale 60% \bigoplus} = 0.27R_{\scale 60% \bigoplus}$
 would decrease the brightness of the star as compared to the number of probes blocking the star with the increase in transit depth.
Change of the transit depth by number of probes. According to the observational position, it is drawn up to the 106 probe that blocks only the star and r = 2 × 103 cm. However, in an enfolding as in Fig. 3b, the maximum number of probes could reach much higher values by decreasing the d value and increasing the number of orbits.

If a second type of swarm with incremental orbital radius leads to a large amount of dimming to the star, in other words, if it blocks that, they could leave other observational fingerprints such as infrared wavelength radiation and its derivatives (Harrop and Schulze-Makuch, Reference Harrop and Schulze-Makuch2010; Osmanov and Berezhiani, Reference Osmanov and Berezhiani2018). However, there may be observable events when the probes transfer the radiative energy, which should be accomplished presumably by electromagnetic radiation (Inoue and Yokoo, Reference Inoue and Yokoo2011), which they store in a given place. For example, when selecting a transmission frequency for a civilization that does not have to live close to the swarm, spectral energy distribution of radiation of the star, energy conversion efficiency of probes acting as individual powerplants, transmission energy through the interstellar medium could also be taken into consideration. Maser type or coherent emissions originated from an unnaturally dimmed star could be the energy transmission signature of Dyson swarm of an advanced civilization.
Network model of diffusing probes in a local neighbourhood
Diffusion of probes could be compared to the SI (susceptible-infected) epidemic model. Susceptible nodes (S) in such a system indicate natural stars and infected nodes (I) indicate the stars where the probes begin to enfold. In this case, the total number of stars in a particular celestial region would be N star = S + I. In a celestial region where a star system outside our own is located, the probability of infected stars would be I/N, which is a number close to zero or even according to the current findings. The local diffusion of a civilization aware of the structure of other stars around their own star systems and desirous to send these self-replicator probes to all fits to the star graph topology. It is known that the star graph topology has large eigenvalues and thus spectral radii in the epidemic SI model, which also includes the recovering of infected nodes (Schumm et al., Reference Schumm, Scoglio, Gruenbacher and Easton2007). Star graph is a network topology with a central node (hub) in the centre and all other nodes (leaves) attached to it. Such a graph is very simple but it captures an easy case in diffusion on networks. If the central node is affected, it is very easy for the leaves to become affected (Alkemade and Castaldi, Reference Alkemade and Castaldi2005; Gago et al., Reference Gago, Hurajová and Madaras2012).
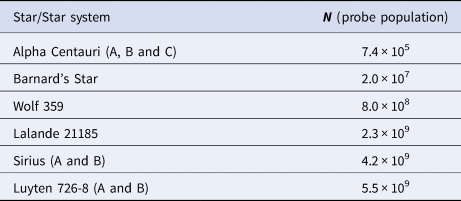
Considering a diffusion in the present topology, a civilization is possible to select the stars for sending the probes according to their distance. In other words, any civilization would determine the probe routes starting from the star closest to its planet and continuing with the second one. Although the proximity of the star is important for the initial stages of diffusion, conversion of the star graph to a population-based weighted one is inevitable as the probes would grow in number as they progress. Since the diffusion would be directional, it would also be directed. The edge weights corresponding to the growing population as the distances get longer could be calculated by equation (4). Although ours is still far cry from the related technology by assuming that our planet is a central node, a map of weighted-directed star graph of nearest stars has been made on the close neighbours of our solar system and shown in Fig. 5. At the start of each interstellar route, there are N 0 = 100 probes. Because interstellar medium density cannot always be 104 or 105 cm−3, which are gas densities of dense clouds, it has been chosen as a lower range value of n = 103 cm−3 (Herbst, Reference Herbst2001). As a result, the probe populations corresponding to the stars are presented in Table 1.
Weighted star graph as the probes' network of diffusion starting from our solar system within 10 ly. Weights of the edges, which could be seen as the arrow thicknesses, are exponentially distributed.

Probe populations after arrivals in the stars are complete

Sun is not included as it is the star close and relatively easily accessible to Earth and because the probe population could be controlled in different ways.
From Table 1 prepared with the data from the graph and its adjacency matrix, it is clear that probes may not reach the number likely to completely enfold the stars at relatively close distances with n = 103 cm−3 but they could be more effective for long distances. Those who could reach a high-level population may partially come together, partially enlarge themselves, reach the required size and enfold the star adequately. Besides all these, probes could even continue to self-replicate in a denser medium to enlarge their population near the star. Thus, civilization may not reside very close to stars which are almost completely dimmed. However, it could also be thought that the primary energy transfer from the probes or the secondary transfer which the depositors would re-transfer may indicate locations of their main planets.
Other studies also suggest that von Neumann probes could colonize the entire galaxy (Wiley, Reference Wiley2011; Lingam, Reference Lingam2016; Osmanov, Reference Osmanov2019). The established network model supports the population of probes to become large enough to have invasive behaviour in the galaxy. Since edge weights are population-dependent as an average-weighted degree, the most fundamental of the centrality measures (Akpinar et al., Reference Akpinar, Haliki, Ucar and Haliki Uztan2014) is given as

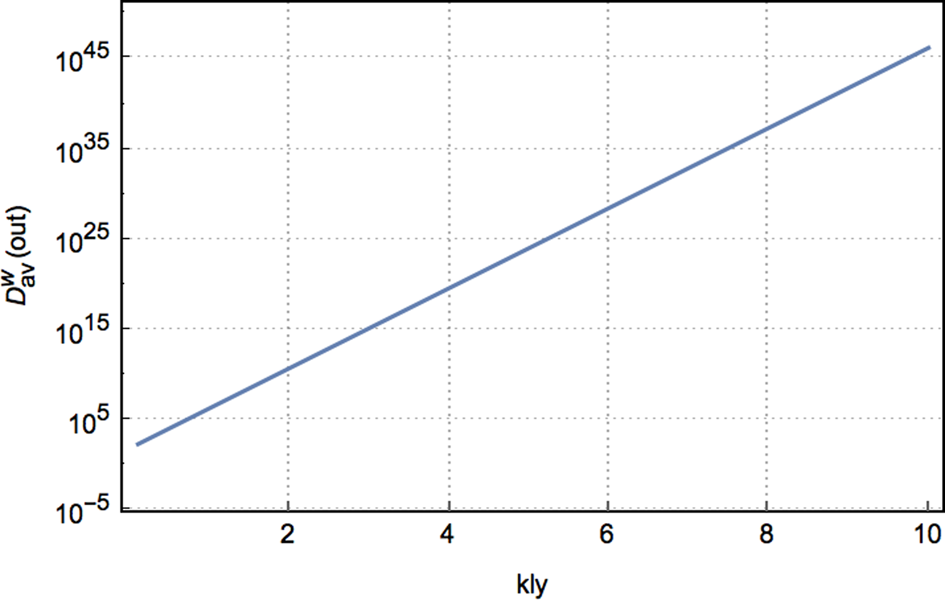
where w ij is the weight of an edge between i and j having an enlarging population with the distance, d j the distance between the hub (i = 1) and leaves for the star graph topology, and the out parameter indicates the out-degree of the hub where outgoing edges are the only ones in a star graph. Consequently, the behaviour of the average-weighted out-degree of the network, which grows according to equation (4), has been shown in Fig. 6. The average medium density at minimal levels (n = 10 cm−3) has been taken at a distance of 10 kly from the sent probes with the initial population N 0 = 100 and how they could become invasive is handled by comparing the path which they took with $D_{av}^w \lpar {out} \rpar$ . The average degree of the system is independent of the number of routes now that the probes of each one have been considered to be moving with the same initial population under equal conditions (β = 0.5, ξ = 0.1, r = 0.1 mm). According to this network that could describe the traffic of the probes, it is one of the possibilities that the probe's transition to the predator−prey behaviour is related to the balance of the massive spread which they could reach and that we have not encountered any signs of the colonized galaxies yet (Forgan, Reference Forgan2019).
Change of weighted out-degree in the probes' network of diffusion in a less dense environment. One could reach even larger numbers where the particle density in galaxies is higher. It characterizes the population increase during the spread of the swarm. Note that since the acceleration could increase their speeds in long distances (Osmanov, Reference Osmanov2019), their average has been equalized to 0.5c (β = 0.5).

Discussion
The basic idea of von Neumann probes is to realize that evolving technology of artificial intelligence would eventually lead to exploratory space probes with a capacity of self-replicating from elements encountered in space, which is not obviously something we can handle now but that sort of technology would become feasible in future. If one can produce kinds of space exploration probes that we have already created but with the sufficiently advanced technology to make copies of themselves, then our civilization could get to explore the Milky Way starting from our solar neighbourhood. It would become efficient in the manner of exponential spreading across any galaxies. Various theoretical calculations and estimations would come into play when the required technology has been reached.
Although different results could be obtained with different interpretations of the number and size of the probes, it is to be seen that the probes moving in regions such as HII clouds could reach very serious numbers due to the density of the environment. It is also clear that they would reach large populations within a galaxy even at a lower medium density. It is obvious that if they are used to obtain energy they could also find more material that might increase their size while enfolding a star. This means that the medium density and probe population would already increase near the stars. If the probes, when they reach the star before their enlargement process, could increase their numbers indicate that even O-type stars could be enfolded. For example, even if Theta Orionis C (Stickland and Lloyd, Reference Stickland and Lloyd2000) was located where Barnard's Star is located, the population of probes (107 in Table 1) would start to grow and the enfolding process could apply a serious dimming to the star. r = 0.1 mm at the time when an enlarged population of 1030 probes continues its milling around the star, even if the probes did not start to grow themselves, in dimming about one thousandth of the population would be applied to the blue giant star according to equation (16) with the transit depth being about 0.32. This indicates a serious decrease in luminosity. Some of the probes reaching the red dwarves in such numbers would enfold the star in a way to grow energy while the remaining would probably continue on their way to reach new celestial bodies.
Although the main sequence stars have been mentioned in the study, celestial objects such as supergiant stars, white dwarfs, neutron stars and black holes could be preferred for enfolding. White dwarfs may be occupied with small swarms, although they are seemingly not likely to be preferred by the probes due to faint luminosities (Bedin et al., Reference Bedin, King, Anderson, Piotto, Salaris, Cassisi and Serenelli2008) caused by their emission of stored thermal energy. On the other hand, calm supergiants and neutron stars could be used entirely to generate energy due to their large luminosity. Of course, flaring activities in giant stars and neutron stars which tend to enter dangerous phases such as a magnetar are not included in this group (Sguera et al., Reference Sguera, Bassani, Landi, Bazzano, Bird, Dean, Malizia, Masetti and Ubertini2008; Haliki, Reference Haliki2019). In black holes, the most massive phase of the collapsars, energy could be harvested either from the heat generated using infalling material or by extracting the angular momentum from black hole rotation (Lasota et al., Reference Lasota, Gourgoulhon, Abramowicz, Tchekhovskoy and Narayan2014). Nevertheless, the main use of building a swarm around a black hole would be to capture the energy released by its accretion disc, which might be actually an efficient way to produce energy since it can turn up to 40% of the rest mass in the disc into radiation, which should be much better than nuclear fusion. Collapsars usually do not have oblate spheroid shapes and mascons as they could be called perfect spheres. However, due to the flattening of the ones with very fast rotations, how the probes could be placed around them or the dangers of being torn apart by them by retrograde motion could be handled in further research. In order to get energy from almost anything using probes, training them against these types of environments, or pre-loading different strategies for any celestial objects that they may encounter are the priorities to be done by a civilization.
Conclusion
All celestial objects which we could see in our galaxy are performing their duties in their medium with no one seeming to be messing around. We are the only known species capable of technological output in the whole galaxy. However, the age of the Milky Way could also be considered to be suitable for any predecessor civilization to have colonized itself. Therefore, we reach Fermi Paradox again, which says that advanced civilizations would never reach interstellar technologies. Another suggestion is that possible advanced civilizations develop their universe simulations and trap themselves into virtual realities since interstellar journeys would be very difficult. Another is that very rare civilizations, which may have recently been Type-II, installed Dyson megastructures around the stars which have yet to be detected.
Even though all these propositions were valid, the question always comes to mind why these things did not occur in the Milky Way which is billions of years old. Until now, we would be supposed to find remnants of development which belonged to ancient civilizations. In other words, they could need to use self-replicators from energy production to interstellar scouting anywhere.
However, even if it took ten million years for a galaxy to be invaded, we would have to detect replication factories near our solar system as well. As a result, either no possible civilization was able to obtain or did not wish to produce them or any advanced civilization did not exist in our galaxy ten million years ago. Nevertheless, this does not mean that there are no advanced civilizations in our galaxy, galactic neighbourhood or largely, inside our Hubble sphere. There may also be few ones and very far distances between them. Although the strong anthropic principle ‘The universe must have features which allow life to exist at some point.’ is still controversial, our quest for ETI motivates us for humanity and our place in the universe.
Acknowledgements
The author thanks the anonymous referee for valuable comments and suggestions. This paper is dedicated to Freeman Dyson, who shed light on our way with his inventions and ideas.