

INTRODUCTION
Recent research shows that self-reported racial/ethnic discrimination is related to risk for health problems, including mortality (Barnes et al., Reference Barnes, de Leon, Lewis, Bienias, Wilson and Evans2008), psychiatric disorders (Kessler et al., Reference Kessler, Mickelson and Williams1999; Landrine et al., Reference Landrine, Klonoff, Corral, Fernandez and Roesch2006), and cardiovascular disease (Lewis et al., Reference Lewis, Everson-Rose, Powell, Matthews, Brown, Karavolos, Sutton-Tyrrell, Jacobs and Wesley2006; Krieger and Sidney, Reference Krieger and Sidney1996). Numerous review articles have found that discrimination is related to these and other health issues across many racial and ethnic populations (Mays et al., Reference Mays, Cochran and Barnes2007; Paradies Reference Paradies2006; Pascoe and Smart Richman, Reference Pascoe and Smart Richman2009; Williams and Mohammed, Reference Williams and Mohammed2009). Reviews also have suggested that many existing measures may not fully capture the experiences of diverse racial/ethnic groups (Bastos et al., Reference Bastos, Celeste, Faerstein and Barros2010; Gee et al., Reference Gee, Ro, Shariff-Marco and Chae2009). A major concern is whether current measures comprehensively and reliably capture the forms of discrimination experienced by diverse groups, and whether these groups report discrimination in the same way. To examine and compare how self-reported discrimination is associated with health, it is important to have a measure that conceptually and empirically captures racial/ethnic discrimination for the range of experiences of diverse groups.
Racial discrimination has a longstanding history in the United States, affecting different racial/ethnic groups in both similar and different ways. For example, studies have found that Asians, Blacks,Footnote 3 and Latinos encounter similar levels of racial discrimination when purchasing a home (Turner and Skidmore, Reference Turner and Skidmore1999). However, other studies show important group differences. For instance, Blacks are more likely to be perceived as dangerous than Asian Americans and other ethnic groups (Bobo Reference Bobo, Smelser, Wilson and Mitchell2001), and Asian Americans (including those born in the United States) are perceived to be “perpetual foreigners” (Tuan Reference Tuan1998), an issue not often faced by Blacks. Importantly, these differences are matters of degree.
To measure this heterogeneity of experiences of discrimination among different racial/ethnic groups in a single instrument and compare it among population groups requires balancing the tension between comprehensiveness and parsimony. Comprehensively assessing the forms of discrimination faced by specific groups would require a large set of items that are detailed for specific groups, and it is expected that groups would vary in their reporting of such items. At the same time, population-based studies have practical limits of respondent burden, cost, and time. Obviously, the survey items should perform reliably across groups and yield group differences that reflect real differences that are not due to survey design or other artifacts.
In this article, we address two challenging questions in measuring racial/ethnic discrimination on population health surveys. First, can a single parsimonious item set be used to measure racial/ethnic discrimination across multiple racial/ethnic groups, and second, what are the implications of directly asking about race when measuring racial/ethnic discrimination? To address these challenges we designed a multi-year research project in which we are using mixed methods to develop and test a concise, valid and reliable multidimensional instrument for measuring self-reported racial/ethnic discrimination in population-based health surveys for multicultural and multilingual populations (Shariff-Marco et al., Reference Shariff-Marco, Gee, Breen, Willis, Reeve, Grant, Ponce, Krieger, Landrine, Williams, Alegria, Mays, Johnson and Brown2009). Our Discrimination Module measures four dimensions of racial/ethnic discrimination—recent everyday discrimination; lifetime discrimination; appraisal of discrimination as stressful; and usual responses to discrimination. In this paper, we focus on a subset of items on recent discrimination that is a modified version of the Everyday Discrimination Scale (Williams et al., Reference Williams, Yu, Jackson and Anderson1997) because this part of our empirical work is especially well suited to address these two challenges.
Building on previous research, our measure conceptualizes exposure to racial/ethnic discrimination as a psychosocial stressor, and we anticipate that it will have psychological, physiological, behavioral, and material consequences that can adversely affect health behaviors and health status (Clark et al., Reference Clark, Anderson, Clark and Williams1999; Epel et al., Reference Epel, Blackburn, Lin, Dhabhar, Adler, Morrow and Cawthon2004; Geronimus Reference Geronimus2001, Reference Geronimus, Hicken, Keene and Bound2006; Krieger Reference Krieger, Berkman and Kawachi2000, Reference Krieger, Whitmarsh and Jones2010; Mays et al., Reference Mays, Cochran and Barnes2007; Seeman et al., Reference Seeman, Singer, Ryff, Love and Levy-Storms2002; Wildsmith Reference Wildsmith2002; Williams et al., Reference Williams, Mohammed, Leavell and Collins2010). Everyday discrimination refers to chronic, day-to-day discrimination including recurrent character assaults—such as being treated as inferior or dishonest—that is part of the social fabric in the United States (Desmond and Emirbayer, Reference Desmond and Emirbayer2009; Essed Reference Essed1990). We use Differential Item Functioning (DIF) to learn whether our subset of items taps into a single underlying concept (Reeve and Fayers, Reference Reeve, Fayers, Fayers and Hays2005; Teresi and Fleishman, Reference Teresi and Fleishman2007; Thissen et al., Reference Thissen, Steinberg, Wainer, Holland and Wainer1993). Further, we use the DIF results to try to identify whether different racial/ethnic groups are more likely to report experiencing different aspects of discrimination.
Based on previous literature, we hypothesize that overall, Blacks would report the highest levels of discrimination, followed by Latinos, Asian Americans/Native Hawaiians/Pacific Islanders and American Indians/Alaska Natives (among whom we do not pose specific ordering), and the lowest reporting among Whites. We expect variation for specific items and that, after accounting for overall levels of discrimination by group, Blacks would be more likely to report being treated as threatening, while Asians and Latinos would be most likely to report discrimination based on language and accent.
TWO KEY CHALLENGES IN MEASURING EVERYDAY DISCRIMINATION
One major challenge lies in validating measures across diverse populations. Most discrimination measures have been developed and validated for Black populations (Kressin et al., Reference Kressin, Raymond and Manze2008). Recent reviews have found that scales specifically designed for Black populations have not been rigorously tested when adapted for other racial/ethnic groups (Bastos et al., Reference Bastos, Celeste, Faerstein and Barros2010; Kressin et al., Reference Kressin, Raymond and Manze2008). For instance, these scales seldom ask about discrimination based on language and accent, yet this type of discrimination may be particularly salient for population groups with large proportions of immigrants like Asian Americans and Latinos (Gee et al., Reference Gee, Ro, Shariff-Marco and Chae2009).
Our second challenge is to assess how to ask about discrimination experiences related to race/ethnicity. Two approaches are common. One approach asks explicitly about experiences with racial/ethnic discrimination in one question (one-stage approach). A second approach divides this line of questioning into two parts and initially uses more neutral language by asking about “unfair treatment” (two-stage approach). Hence, these two approaches make fundamentally different assumptions about how best to query respondents. With the one-stage approach, the intent of the question is clearly focused on racial/ethnic discrimination. The two-stage approach allows participants to report on racial/ethnic as well as other types of discrimination. Both approaches have been shown to have good inter-item reliabilities, and both are correlated with health problems. However, these approaches tend to yield different levels of self-reported exposure (Brown Reference Brown2001; Chae et al., Reference Chae, Takeuchi, Barbeau, Bennett, Lindsey and Krieger2008; Krieger et al., Reference Krieger, Smith, Naishadham, Hartman and Barbeau2005), and it is unclear whether they are empirically equivalent.
Two competing hypotheses propose how the approaches may differ empirically. One hypothesis is that the two-stage approach would yield more accurate—and by implication higher—reporting of racial/ethnic discrimination because it does not require respondents to engage in the challenging cognitive task of attributing cause as they engage in the task of recalling, discerning, and reporting experiences of discrimination (Williams and Mohammed, Reference Williams and Mohammed2009); the one-stage approach requires respondents to attribute discrimination to race/ethnicity at the same time as they report frequency, and this, the authors hypothesize, would result in underreporting experiences of discrimination. A separate and competing hypothesis suggests that including the attribution of race/ethnicity in the stem of the question will result in higher reports of racial/ethnic discrimination due to the highly sensitized terminology and because this approach avoids the challenge of attributing discrimination to other specific factors (e.g., race vs. gender) (Bastos et al., Reference Bastos, Celeste, Faerstein and Barros2010).
To address these unanswered empirical questions, we conducted, through telephone surveys, a head-to-head comparison of the one-stage versus two-stage approaches used to measure self-reported recent everyday racial/ethnic discrimination. We compared these two approaches. For the two-stage approach, we further examined responses separately using only the first stage without specifying attribution to unfair treatment and using the second stage to specify attribution to racial/ethnic discrimination.
METHODS
Overview
A subsample of respondents to the 2007 California Health Interview Survey (CHIS) was selected to receive the Discrimination Module (DM). CHIS is a random digit dial telephone survey. The total adult sample in 2007 was 51,048.Footnote 4 The overall response rate for adults (from the landline/list sample), 18.7%, is comparable to the California Behavioral Risk Factor Surveillance System telephone survey (California Health Interview Survey 2009). The overall response rate is the product of the screener and extended interview response rates, which were 35.5% and 52.8%, respectively in 2007.Footnote 5
Based on prespecified sampling probabilities, 7505 adults were randomly assigned to the one- or two-stage versions of the DM questionnaire. Among these adults, 104 quit the CHIS study before being asked about discrimination, and another 435 did not provide codable information on race/ethnicity (e.g., reported “human race”), resulting in an analysis sample of 6966 respondents (2254 Whites; 1800 Latinos; 1006 Black or African Americans; 190 American Indian/Alaska Natives, 1231 Asian American Native Hawaiian or Pacific Islanders, and 485 Multiracial respondents).Footnote 6 Of these respondents, 3506 were assigned to the one-stage version, and 3460 were assigned to the two-stage version.
The CHIS 2007 Recent Everyday Racial/Ethnic Discrimination Module Field Test
We present findings on the eight items that assess recent everyday discrimination experiences in the past twelve months. Items were adapted from the Everyday Discrimination Scale (Williams et al., Reference Williams, Yu, Jackson and Anderson1997), with changes in the wording of both specific items and response categories. For instance, the “courtesy” item from the original scale was found to be redundant with “respect” and dropped (Reeve et al., Reference Reeve, Willis, Shariff-Marco, Breen, Williams, Gee, Alegria, Takeuchi, Kudela and LevinForthcoming). We added a language item because previous research has found that language discrimination is an important type of racial discrimination faced by ethnic groups (Gee et al., Reference Gee, Ro, Shariff-Marco and Chae2009; Spencer and Chen, Reference Spencer and Chen2004). It is important to note that language discrimination can occur in the absence of factors related to immigration. For instance, Massey and Lundy (Reference Massey and Lundy2001) found that individuals speaking “Black English Vernacular” or “Black Accented English” over the telephone faced more discrimination in renting an apartment than individuals speaking “White Middle-Class English.” Further, our analyses from a separate behavior-coding study suggested that a simplified response category (0 = never to 3 = often) was appropriate for telephone-administered surveys (Reeve et al., Reference Reeve, Willis, Shariff-Marco, Breen, Williams, Gee, Alegria, Takeuchi, Kudela and Levinforthcoming). Participants were asked the following questions: “In the past 12 months, how often have …
1. you been treated with less respect than other people?
2. you been treated unfairly at restaurants or stores?
3. people criticized your accent or the way you speak?
4. people acted as if they think you are not smart?
5. people acted as if they are afraid of you?
6. people acted as if they think you are dishonest?
7. people acted as if they're better than you are?
8. you been threatened or harassed?”
The two approaches are as follows:
One-stage: With this approach, each item above directly attributes discrimination to race/ethnicity in the stem. For example, “Have you been treated with less respect than other people because [of your race/ethnicity]?”
Two-stage: With this approach, each item above asks about unfair treatment in an initial question and then asks for attribution. For example, “Have you been treated with less respect than other people?” If yes, the respondent is asked a series of questions to attribute the experiences of unfair treatment to ancestry or national origin, gender or sex, race or skin color, age, the way he or she speaks English, or some other reason (specify). For example, “Now, I'm going to ask you why you may have been treated unfairly. In the past 12 months, were you treated unfairly because of your ancestry or national origin?”
The two-stage approach yields two sets of results for everyday discrimination: One is unattributed (using information from the first stage only), and a second is attributed to race/ethnicity (using information from both the first and the second stage). To construct the second group, attributions of ancestry or national origin, race or skin color, and the way he or she speaks English were ascribed to racial/ethnic discrimination. Responses attributing discrimination to something other than race/ethnicity or “never” experiencing everyday racial/ethnic discrimination were recoded to “no racial/ethnic discrimination” in order to maintain them in our analytic sample.
We categorized our data into three groups for analysis: (1) two-stage unattributed; (2) two-stage attributed to race/ethnicity; and (3) one-stage. We used the demographic items on CHIS to categorize the DM sample by race/ethnicity. Anyone who self-identified as Hispanic or Latino was categorized as “Latino.” Others were identified as non-Hispanic White, Asian American Native Hawaiian or Pacific Islander (AANHPI), African American/Black, American Indian/Alaska Native (AI/AN) or Multiracial. AANHPIs were aggregated due to small samples. AI/AN were counted differently in order to maximize the likelihood of including them in this group. All respondents who made any mention of AI/AN were included in this category (Lee et al., Reference Lee, Satter and Ponce2009; Mays et al., Reference Mays, Ponce, Washington and Cochran2003; Swan et al., Reference Swan, Breen, Burhansstipanov, Satter, Davis, McNeel and Snipp2006). Multiracial respondents formed their own category with the exception of AI/AN respondents.
Data Analysis
Psychometric Properties
We performed a confirmatory factor analysis (CFA) in our total sample and within each racial/ethnic group. Based on prior literature, we hypothesized a one-factor structure (Kessler et al., Reference Kessler, Mickelson and Williams1999; Krieger et al., Reference Krieger, Smith, Naishadham, Hartman and Barbeau2005; Williams et al., Reference Williams, Yu, Jackson and Anderson1997). Factor analyses were used to test this hypothesis on data without sampling weights using Mplus (version 4.21) software (Muthen and Muthen, Reference Muthen and Muthen2007). Model fit was assessed by examining the comparative fit index (CFI > .95), Tucker-Lewis Index (TLI > .95), and the Root Mean Squared-Error of Approximation (RMSEA < .08). Inter-item reliability was assessed using Cronbach's alpha (Nunnally and Bernstein, Reference Nunnally and Bernstein1994).
We then used Differential Item Functioning (DIF) analysis to determine if individual questions perform differently across racial/ethnic groups after controlling for other items measured in the construct. Scales containing items that exhibit DIF may have reduced validity for between-group comparisons because scores may be indicative of attributes other than those that the scale is designed to measure (Roussos and Stout, Reference Roussos and Stout1996; Teresi and Fleishman, Reference Teresi and Fleishman2007; Thissen et al., Reference Thissen, Steinberg, Wainer, Holland and Wainer1993). If an item displays DIF, the DIF item may be kept in the scale if it does not affect the overall score; or, if it does, the item may be removed (Reeve et al., Reference Reeve, Hays, Bjorner, Cook, Crane, Teresi, Thissen, Revicki, Weiss, Hambleton, Liu, Gershon, Reise, Lai and Cella2007; Teresi and Fleishman, Reference Teresi and Fleishman2007).
DIF tests were performed comparing racial/ethnic groups in pairwise fashion using the Item Response Theory (IRT)-based likelihood-ratio (IRT-LR) method (Thissen et al., Reference Thissen, Steinberg, Wainer, Holland and Wainer1993) with the IRTLRDIF (version 2.0b) software program (Thissen Reference Thissen2001). Each item in the scale was tested for DIF using the remaining seven items as anchors to adjust for the differences in experiences of discrimination. Sample sizes were too small to examine DIF for AI/ANs and Multiracial respondents even after recoding.
Prevalence Estimates
We computed weighted percentages and the weighted mean frequencies of recent everyday discrimination reported in the 2007 CHIS DM field test for each approach by race/ethnicity using SAS-callable SUDAAN (version 10, Research Triangle Institute 2008). Special weights were developed for the DM sample (details available from authors). Though missing data for the module items were small, ranging from 0.7 to 2.3 percent, to minimize loss of data for subsamples, missing data were imputed using the AutoImpute macro (Judkins et al., Reference Judkins, Krenzke, Piesse, Fan and Haung2007, Reference Judkins, Piesse and Krenzke2008; Piesse et al., Reference Piesse, Judkins and Fan2005).
RESULTS
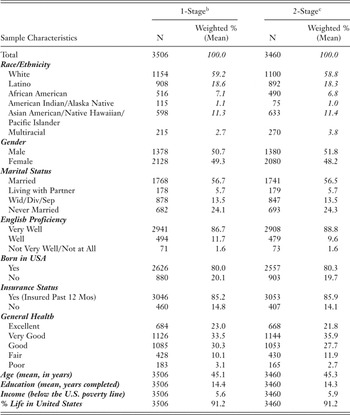
Table 1 presents sample characteristics, stratified by approach. Demographic characteristics (e.g., race/ethnicity or gender) were similar across the two approaches, indicating that the randomization yielded balanced samples.
Sample Characteristics for One- and Two-Stage Approaches,a 2007 CHIS Discrimination Module Field Test

a Chi-square tests and t-tests were performed to test the difference of the distributions of each sociodemographic variable in the two samples. No statistically significant difference was found at alpha=0.05 level.
b Explicit questions on racial discrimination.
c Questions about experiences conceptualized as discriminatory followed by attribution to racial/ethnic attributes.
Psychometric Findings
We obtained a good fit for a single factor solution (CFI = .99; TLI = .99; and RMSEA = .05) for both of the samples shown in Table 1. Factor analyses by racial/ethnic subgroups yielded similar results. These findings indicate that the subset of the eight DM questions tap into a single underlying dimension of recent discrimination.
Cronbach's alpha for the one-stage and the two-stage approach were 0.88 and 0.81, respectively. While both of these estimates are considered acceptable for group level measurement (> .70), the one-stage approach is closer to the acceptable standard for individual level assessment (>.90) (Nunnally and Bernstein, Reference Nunnally and Bernstein1994).
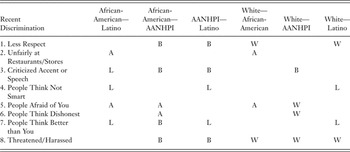
Table 2 summarizes the pairwise DIF findings for the one-stage approach only for parsimony in presentation. DIF results were similar across all three groups (two-stage unattributed; two-stage attributed to race/ethnicity; and one-stage). Small DIF was identified for several items, but no single item had DIF that affected the overall group mean by more than .03 standardized units on a scale with a mean of zero and standard deviation of one. In short, across approaches and racial/ethnic groups, DIF was not large enough to consider deleting any item from the scale.
Results from Differential Item Functioning (DIF) for the One-stage Approach,a,b 2007 CHIS Discrimination Module Field Test

a The letters represent the racial/ethnic groups that endorsed an item more frequently based on the DIF analyses: A-African American, B-Asian American/Native Hawaiian/Pacific Islander, L-Latino. W-White. Item Response Theory—Likelihood Ratio method used to test for DIF. All significant DIF findings are reported when p < .01.
b A small amount of DIF was identified for several items, but, between two groups, no single item had DIF that affected the overall group mean by .03 or more standardized units.
Even though no item has DIF large enough to delete it from the scale, some interesting pair-wise patterns in DIF were discerned:
African Americans and Latinos
DIF was found for questions (2) “… treated unfairly at restaurants/stores” and (5) “… people acted as if they are afraid of you.” As the reported level of overall recently experienced racial discrimination increased, African Americans were more likely to endorse these two items than Latinos at any given level of discrimination. Small DIF was also detected pertaining to three other items where Latinos were more likely to endorse them: numbers (3), “criticized accent or the way you speak”; (4), “… think you are not smart”; and (7), “… acted as if they're better than you.”
African Americans and AANHPIs
DIF was found for questions (1), “… treated with less respect”; (3), “… people criticized your accent or the way you speak …”; (7), “… acted as if they're better than you”; and (8), “… been threatened/harassed.” The DIF findings suggest that for African Americans and AANHPIs with similar levels of discrimination, AANHPIs were more likely to endorse these items than African Americans. A small level of DIF was also found between African Americans and AANHPIs for questions (5), “… people acted as if they are afraid of you,” and (6), “… think you are dishonest,” with African Americans more likely to endorse them.
AANHPIs and Latinos
DIF was found for questions (1), “… you have been treated with less respect than other people …”; (3), “… people criticized your accent or the way you speak …”; and (8), “… been threatened or harassed …”. AANHPIs were more likely to endorse these items than Latinos, despite having experienced the same level of discrimination. DIF was also found for two other items with Latinos more likely to endorse them: numbers (4), pertaining to “… think you are not smart,” and (7), pertaining to “… acted as if they're better than you.”
Whites and All Other Groups
DIF was found for question number (8), “… been threatened or harassed….” Whites who reported recent everyday racial discrimination, after we controlled for differences in the frequency of racial discrimination they experienced, were more likely to endorse the threatened/harassed question than other groups.
Across the set of pairwise findings, several race/ethnicity specific patterns emerged. African Americans were more likely to endorse item number (5), “People acted as if they are afraid of you.” Latinos were more likely to endorse item number (4), “People acted as if they think you are not smart”; or number (7), “People acted as if they're better than you.” AANHPIs were more likely to endorse number (3), “People criticized your accent or the way you speak.” Whites were more likely to endorse number (8), “… been threatened or harassed.” These patterns were also observed for the two-stage approach sample, except for Whites.
Results of Using the One-Stage and Two-Stage Approaches to Measure Everyday Discrimination Experiences
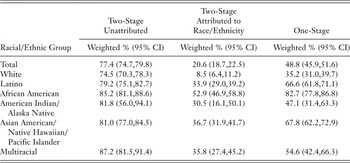
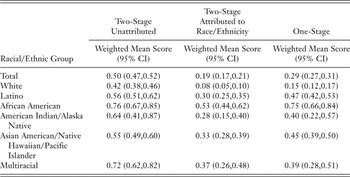
Tables 3 and 4 compare reports of recent discrimination for three groups: two-stage unattributed, two-stage attributed to race/ethnicity, and one-stage. Table 3 presents percentages of reports of any experience of recent discrimination, and Table 4 presents mean scores across the eight items. The first two columns of both tables show the estimates for respondents from the two-stage sample. The first column shows the percentage reporting any kind of discrimination using the first stage of the two-stage approach and the second column shows the percentage reporting discrimination attributed to their race or ethnicity as described in the methods section above. The third column shows the percentage of racial/ethnic discrimination reported by respondents from the one-stage sample who were directly asked whether they experienced recent racial/ethnic discrimination.
Percentage of People Who Reported Any Recent Discrimination by Approach and Race/Ethnicity,a 2007 CHIS Discrimination Module Field Test

a Pairwise t-test were performed to test the differences of the estimates reported above between different racial/ethnic groups within each approach. The pairs that have statistically significant difference in recent discrimination include:
For the one-stage: White-Latino, White-African American, White-AANHPI, White-Multiracial, Latino-African American, Latino-AI/AN, African American-AI/AN, African American/AANHPI, African American-Multiracial, AI/AN-AANHPI.
For the two-stage: White-African American, White-AANHPI, White-Multiracial, Latino-African American, Latino-Multiracial;
For the two-stage specified sample, White-Latino, White-African American, White-AI/AN, White-AANHPI, White-Multiracial, Latino-African American, African American-AI/AN, African American-AANHPI, African American-Multiracial.
Mean Scores for Recent Experiences of Discrimination by Approach and Race/Ethnicity,a 2007 CHIS Discrimination Module Field Test

a Pairwise t-test were performed to test the differences of the estimates reported above between different racial/ethnic groups within each approach—The pairs that have statistically significant difference in mean scores of recent discrimination include:
For the one-stage: White-Latino, White-African American, White-AI/AN, White-AANHPI, White-Multiracial, Latino-African American, African American-AI/AN, African American-AANHPI, African American-Multiracial;
For the two-stage: White-Latino, White-African American, White-AANHPI, White-Multiracial, Latino-African American, Latino-Multiracial, African American-AANHPI, AANHPI-Multiracial;
For the two-stage specified sample:, White-Latino, White-African American, White-AI/AN, White-AANHPI, White-Multiracial, Latino-African American, African American-AI/AN, African American-AANHPI, African American-Multiracial.
For the two-stage approach, 2638 respondents reported experiencing some form of recent everyday discrimination. Of them, 941 (or 27%) reported this was due to race/ethnicity. This varied by racial/ethnic group, with higher proportions attributing discrimination to race/ethnicity among the non-White groups: African Americans (62%); Latinos (43%); AANHPIs (45%); AI/ANs (37%); and Multiracial respondents (41%). Eleven percent of Whites attributed discrimination to racial/ethnic characteristics.
Table 3 shows the percentage of respondents who reported recent everyday discrimination by approach and by racial/ethnic group. As expected, the two-stage unattributed yielded the highest percentage of reports with at least 75% of respondents in each racial/ethnic group having endorsed at least one item. The highest percentage was among Multiracial respondents (87%) followed by African Americans (85%) and the lowest was among Whites (75%).
For discrimination due to race/ethnicity, the one-stage approach yielded a higher percentage of reports than the two-stage approach. Those who were asked using the one-stage approach reported more racial/ethnic discrimination—African Americans (83%), Whites (35%)—than those who were asked using the two-stage approach with attribution for racial/ethnic discrimination specified—African Americans (53%), Whites (9%).
Differences in self-reported exposures between racial/ethnic groups were smaller for two-stage unattributed than for either two-stage attributed to race/ethnicity or one-stage. Subgroups with small sample sizes (AI/ANs and Multiracial respondents) had wide, overlapping 95% CIs around their point estimates. Of the total fifteen pairwise t-tests we conducted, we found a higher number of statistically significant different pairs in discrimination estimates between racial/ethnic groups in the one-stage approach sample (ten pairs) than in the two-stage approach sample (five pairs). The two-stage attributed to race/ethnicity was more similar to the one-stage with nine pairs. This was especially true when comparing Whites to other populations of color.
Table 4 shows mean scores of recent everyday discrimination by approach and by racial/ethnic group. Mean scores may range from 0–3. For both the total and by racial/ethnic group, mean scores were highest for two-stage unattributed followed by one-stage and two-stage attributed to race/ethnicity. Across these groups, African Americans had the highest mean scores (0.76, 0.75, 0.53) and Whites had the lowest (0.42, 0.15, 0.08). The spread of scores between groups was larger in one-stage than in either two-stage analytic samples (attributed and unattributed). Each approach had a similar number of pairs of statistically significant differences.
DISCUSSION
Our study provides new evidence for understanding the two common approaches for measuring racial/ethnic discrimination among multiple racial/ethnic groups. Our results include three central findings. First, our measure of recent everyday discrimination showed small DIF across groups; the DIF that we found for specific racial/ethnic groups was in accordance with what we would expect based on the literature. This suggests that our measure is meaningful for use across different groups. Second, responses to the two-stage unattributed approach yield the highest levels of exposure to everyday discrimination (with no attribution to race/ethnicity) and smallest variation in reported exposure by racial/ethnic group. Third, estimates of self-reported racial discrimination are higher when using the one-stage approach than when using the two-stage approach with attribution to race/ethnicity specified.
Implications
Measurement Challenge 1: Is a Single Measure Valid for Measuring Everyday Discrimination Across Diverse Racial/Ethnic Groups?
Our DIF analysis suggested that our measure of recent everyday discrimination performed similarly across diverse racial/ethnic populations. All DIF was small, and any DIF was cancelled out in the aggregate. The most useful DIF was found in items where there was precedent to anticipate a priori group differences. For example, Blacks were more likely to endorse the item “… they are afraid of you.” Discrimination based on people's fear of one particular person or group, more salient for Blacks in our study, can be expected when groups are singled out and stereotyped as dangerous and criminal, such as African American males are in the United States (Feagin Reference Feagin2006; Krieger Reference Krieger, Berkman and Kawachi2000; Pincus Reference Pincus2003; Williams and Neighbors, Reference Williams and Neighbors2001). A national survey, for example, reported that, in 1990, more than 50% of White Americans stereotyped Black Americans as being prone to violence; White Americans' beliefs that other groups were prone to violence was under 20%, except for Hispanics at 38% (Williams and Neighbors, Reference Williams and Neighbors2001).
Asians and Latinos were more likely to endorse “criticized accent or the way you speak.” Our study confirmed more language and accent discrimination reported by AANHPIs and Latinos, and this is not surprising since these groups have a large proportion of immigrants from non-English-speaking countries (Cameron Reference Cameron1997; Spencer and Chen, Reference Spencer and Chen2004; Yoo et al., Reference Yoo, Gee and Takeuchi2009, Reference Yoo, Gee, Lowthrop and Robertson2010). This form of discrimination may include both overt discrimination based on English-only policies, and patronizing assumptions, such as those revealed in statements like, “you speak English so well” to native speakers who are of Asian or Latino ancestry (Liang et al., Reference Liang, Li and Kim2004). This is consistent with similar points raised in the literature that Latinos and Asians are seen as perpetual foreigners (Gee et al., Reference Gee, Ro, Shariff-Marco and Chae2009; Tuan Reference Tuan1998).
The one unexpected finding was that Whites were more likely to endorse being threatened/harassed because of their race/ethnicity. It is unclear whether this pattern revealed in our DIF analysis is valid versus an artifact due to measurement error, item construction, or other problems with the instrument. Given the extensive research documenting that racially motivated hate crimes are overwhelmingly directed against persons of color (Feagin Reference Feagin2006; National Research Council 2004), this item will require further study, building on the social science literature on reverse discrimination and the social construction of Whiteness (Feagin and O'Brien, Reference Feagin and O'Brien2003; Kluegel and Bobo, Reference Kluegel, Bobo, O'Connor, Tilly and Bobo2001; Pincus Reference Pincus2003).
Using the same measure to examine recent everyday discrimination across diverse racial/ethnic groups appears to be valid as long as the measure taps into the range of discrimination experienced by the populations studied. Thus, we recommend including an item pertaining to language discrimination because this item resonates with groups that include large proportions of immigrants from other countries where American English is not the primary spoken language. An area for further research is whether a language item would also resonate with Black Americans who speak Black Accented English or who are from countries where American English is not the primary spoken language. While the effect of DIF on the overall score was minimal on our eight-item scale, if the scale had fewer items, then the DIF for any of these items could have a larger impact. This is another area for further research.
Measurement Challenge 2: Do the One-Stage and Two-Stage Approaches for Measuring Everyday Discrimination Produce Similar Results?
Our study is also the first that we are aware of to directly compare the two approaches for measuring recent everyday racial/ethnic discrimination, using identically worded questions, in a single study. We compared results across three groups: two-stage unattributed; two-stage attributed to race/ethnicity; and one-stage. The data show that approach matters. As hypothesized by Williams and Mohammed (Reference Williams and Mohammed2009), the first stage of the two-stage approach yields a higher percent of respondents reporting any recent unfair treatment (overall, not attributed to race/ethnicity) than the one-stage approach that asks directly about racial/discrimination. This pattern holds when we look at the average level of reporting of discrimination. However, when we restrict the two-stage to focus on discrimination attributed to race/ethnicity, the one-stage approach yields a higher percentage of people reporting this discrimination, and a higher average. The latter finding supports the hypothesis presented by Bastos et al. (Reference Bastos, Celeste, Faerstein and Barros2010).
Together, these results underscore the difficulties that may arise when comparing results from studies that analyze data on recent “unfair treatment” without attribution with results from studies that analyze data from questions that explicitly ask about racial discrimination. The greatest danger is when studies using the two measures attempt to compare prevalence estimates of recent self-reported discrimination. These estimates will differ, although no way has yet been found to ascertain which estimate is more accurate. Accordingly, researchers are encouraged to state clearly which approach is used when describing and comparing estimates of self-reported discrimination.
Study Limitations
Proper interpretation of our study findings requires the consideration of several limitations. First, our sample size was not adequate to stratify our DIF analysis by multiple characteristics. For example, studying DIF for racial discrimination questions when controlling for other types of social characteristics (e.g., gender, education, and acculturation) would be useful, since these characteristics may also affect self-reports of experiences of racial discrimination (Krieger Reference Krieger, Berkman and Kawachi2000; Landrine et al., Reference Landrine, Klonoff, Corral, Fernandez and Roesch2006; Paradies Reference Paradies2006; Teresi and Fleishman, Reference Teresi and Fleishman2007; Williams and Mohammed, Reference Williams and Mohammed2009).
Second, we do not know whether respondents from different racial/ethnic groups bring the same meaning to the response categories. For example, when White, Black, and Latino respondents endorse “sometimes,” do they have the same frequency in mind? Likewise, when these different groups report having been “threatened or harassed” due to their race/ethnicity, are they describing similar experiences of the same intensity or chronicity? Additional research is required to address these questions, both cognitively and in relation to their impact on measuring associations between racial/ethnic discrimination and health status.
Third, our comparisons of the two different approaches are based on group averages rather than direct comparisons of individual respondents. To directly compare how individuals responded to the two approaches, we could have designed our study to ask every respondent about discrimination using both approaches in a randomly assigned order. No studies have done this, although a few studies have administered different discrimination instruments (e.g., both one-stage and two-stage) to the same respondents (Brown Reference Brown2001; Chae et al., Reference Chae, Takeuchi, Barbeau, Bennett, Lindsey and Krieger2008; Krieger et al., Reference Krieger, Smith, Naishadham, Hartman and Barbeau2005). Doing so would have been impractical in the context of the CHIS, where the repetition of questions could frustrate respondents (the overall discrimination module has twenty-five to thirty-five items). However, such a within-respondent comparison would be an important complement to our current work.
A fourth limitation is that our study could not address the extent to which the perceived race/ethnicity of the interviewer affected levels of reported racial discrimination, and whether such effects varied across racial/ethnic group. Some research suggests that there are large race-of-interviewer effects for self-reports of discrimination by Blacks (Krysan and Couper, Reference Krysan and Couper2003). Other methodologies exist that might improve measures of people's exposure to racial discrimination and its health impact, such as use of the functional MRI (Mays et al., Reference Mays, Cochran and Barnes2007) or the implicit association test (Carney et al., Reference Carney, Banaji and Krieger2010; Krieger et al., Reference Krieger, Carney, Lancaster, Waterman, Kosheleva and Banaji2010). These limitations point to areas for further research.
Lastly, the findings presented in this paper focus only on questions pertaining to everyday discrimination. We are mindful that everyday discrimination does not capture all aspects of racial/ethnic discrimination even at the individual level, much less at other levels (e.g., occupational segregation, residential segregation, etc.). However, our finding that explicitly attributing the discrimination to race/ethnicity within a single question does matter when asking about discrimination experiences is widely applicable to self-report measures that assess other dimensions of discrimination, including everyday discrimination.
CONCLUSION
Our study, based on a population-based sample including a wide range of racial/ethnic groups, provides important findings relevant to research on racial/ethnic discrimination and health.
First, we demonstrate that questions that explicitly ask about recent everyday racial/ethnic discrimination are different from questions that ask about recent everyday unfair treatment. While this latter finding is not surprising, it is important because results of studies using these two different approaches are often treated as equivalent (Albert et al., Reference Albert, Cozier, Ridker, Palmer, Glynn, Rose, Halevy and Rosenberg2010; Lewis et al., Reference Lewis, Aiello, Leurgans, Kelly and Barnes2010; Taylor et al., Reference Taylor, Williams, Makambi, Mouton, Harrell, Cozier, Palmer, Rosenberg and Adams-Campbell2007; Tomfohr et al., Reference Tomfohr, Cooper, Mills, Nelesen and Dimsdale2010). Our study empirically proves that this practice is not scientifically sound and confirms findings from researchers who have inferred this point from both reviewing the literature and also using different approaches to compare results based on one-stage versus two-stage questions (Bastos et al., Reference Bastos, Celeste, Faerstein and Barros2010; Brown Reference Brown2001; Chae et al., Reference Chae, Takeuchi, Barbeau, Bennett, Lindsey and Krieger2008; Krieger et al., Reference Krieger, Smith, Naishadham, Hartman and Barbeau2005; Williams and Mohammed, Reference Williams and Mohammed2009). We also found important differences in results that are computed from the two different approaches we studied. We found that frequencies are lower when racial/ethnic attribution is culled—in a second stage—from questions that initially ask about any type of unfair treatment than they are when racial/ethnic discrimination is detected by questions that ask directly about experiences of racial/ethnic discrimination in a single stage. These results call for greater rigor in comparing existing studies because the two approaches are not conceptually comparable or empirically equivalent. Underscoring this point, we documented that the two approaches yield different results even after adjusting the estimates for the two-stage approach by specifying attribution to race/ethnicity to ensure that we are measuring only racial/ethnic discrimination. Our results also suggest that more studies are needed to ascertain what constitutes accurate measurement of racial/ethnic discrimination. Second, and this is specific to the measure we tested, we found that both approaches have acceptable psychometric properties for use in diverse racial/ethnic groups, and also that including an item pertaining to discrimination based on language is appropriate.
Finally, our study reinforces that DIF is a useful tool for evaluating instruments across racial/ethnic groups. Our analyses, however, suggest that researchers should hypothesize a priori where they anticipate DIF and remind researchers that the detection of DIF does not necessarily indicate measurement bias. In some circumstances, small DIF is warranted. Hence, the presence of small DIF may be a way to validate assumptions about items, but this is only possible when assumptions are made explicit and a priori.
Our findings suggest caution to researchers when comparing studies that have used different approaches to measure racial/ethnic discrimination, and provide useful empirical guidelines for measuring and analyzing racial/ethnic discrimination. Of equal importance, we have developed a self-reported measure of racial/ethnic discrimination that functions well in a range of different racial/ethnic groups and makes possible comparing how racial/ethnic discrimination is associated with health disparities among multiple racial/ethnic groups.