


Why do some people participate in politics, while others abstain? A rich body of research has demonstrated how factors such as individual-level characteristics and resources (Burden et al. Reference Burden, Fletcher, Herd, Jones and Moynihan2017; Verba, Schlozman, and Brady Reference Verba, Schlozman and Brady1995), socialization dynamics (Carlos Reference Carlos2021; Holbein Reference Holbein2017; Jennings, Stoker, and Bowers Reference Jennings, Stoker and Bowers2009), and direct political communications (Green and Gerber Reference Green and Gerber2019) shape patterns of political engagement. Institutional and environmental conditions—including sudden demographic shifts (Enos Reference Enos2016), direct and indirect contact with the criminal justice system (Lerman and Weaver Reference Lerman and Weaver2014; Walker Reference Walker2014), and broader patterns of state capacity and policy feedback (Mettler Reference Mettler, Meyer, Jenness and Ingram2005)—also influence whether and how people participate in politics.
In this vein, some researchers have considered how exposure to crime influences political participation. The motivation is straightforward: crime remains one of the most visible and politically charged features of everyday life. It is an issue that Americans consistently rank among their top concerns and expect the government to address (Gallup N.d.) and there is evidence that exposure to crime is associated with changes in emotions linked to participation (Albertson and Gadarian Reference Albertson and Gadarian2015; Orth et al. Reference Orth, Cahill, Foa and Maercker2008; Skogan Reference Skogan1987; Valentino et al. Reference Valentino, Brader, Groenendyk, Gregorowicz and Hutchings2011), support for incumbent officials (Cummins Reference Cummins2009; Markarian and Kousser Reference Markarian and Kousser2025), and shifts in public opinion across a range of policy domains (Enns Reference Enns2016; Krause Reference Krause2014).
What is less clear is whether exposure to crime mobilizes or demobilizes individuals. Some argue that victimization and community violence heighten personal stakes, elicit galvanizing emotional responses, and create traumatic experiences that induce community-seeking behavior, mechanisms that may mobilize participation. For example, exposure to crime may increase feelings of threat and vulnerability (Bateson Reference Bateson2025; Berens and Dallendörfer Reference Berens and Dallendörfer2019; Laterzo Reference Laterzo2021; Sønderskov et al. Reference Sønderskov, Dinesen, Finkel and Hansen2022), and lead people to engage in political action as a way to “mitigate the emotional consequences of victimization” (Bateson Reference Bateson2012, 571). However, exposure may also demobilize by eroding trust in institutions, lowering political efficacy, reinforcing perceptions that the state is unresponsive to disorder, or making people reluctant to spend time in public (Berens and Dallendörfer Reference Berens and Dallendörfer2019; Ley Reference Ley2018; McCarthy, Hagan, and Herda Reference McCarthy, Hagan and Herda2025; Trelles and Carreras Reference Trelles and Carreras2012).
Empirically, the literature offers results as mixed as these theoretical expectations. Some studies find that crime mobilizes engagement (e.g., Bateson Reference Bateson2012; Sønderskov et al. Reference Sønderskov, Dinesen, Finkel and Hansen2022); others find demobilizing effects, particularly in contexts of persistent or concentrated violence (e.g., Jones Reference JonesForthcoming; McCarthy, Hagan, and Herda Reference McCarthy, Hagan and Herda2025; Trelles and Carreras Reference Trelles and Carreras2012). Against this backdrop of empirical inconsistency, we take a different tack: rather than offering a new theoretical account, we seek to clarify existing debates through a comprehensive empirical approach. We examine the relationship between multiple forms of crime exposure and both turnout (self-reported and validated) and non-electoral participation (like contacting an elected official or attending a protest), all within a preregistered research design.
We draw on an original survey of residents in 21 of the 30 most populous U.S. cities and respondents from those same cities in the Cooperative Election Study (CES; 2016–24). Approximately 33.5 million Americans (10% of the total U.S. population) reside in these 21 cities. We pair responses with hyper-local administrative crime rates constructed from public-facing databases. We find that direct victimization is associated with higher levels of non-electoral participation but lower levels of turnout. By contrast, associations between contextual crime rates and participation are limited and inconsistent, emerging only in select specifications and exploratory tests, where we find some evidence that higher violent crime rates—but not property crime rates—are associated with reduced turnout. Additionally, we find that perceived neighborhood safety is positively associated with higher rates of non-electoral participation, but is unrelated to turnout. Our results are robust across modeling specifications and datasets. Further, in preregistered exploratory analysis, we show that they are insensitive to reasonable alternative measurement strategies, persist when we control for the amount of time respondents say they spend outside of their homes, and replicate in an additional survey of residents of Cook County, Illinois. In unregistered robustness tests, we find that our victimization and perception findings are robust to the inclusion of ZCTA fixed effects and that effect sizes remain similar in magnitude when using two-wave panel data, though they do not reach statistical significance in these latter tests (likely due to limited statistical power).
Additionally, in unregistered exploratory analysis, we find suggestive evidence that the apparent demobilizing effects of victimization on voter turnout are primarily driven by individuals who were attacked rather than those who suffered vehicle theft, stolen items, or break-ins. Similarly, when we separately test the association between violent and property crime rates and participation, we find that violent crime rates are significantly associated with decreased turnout, while property crime rates are not. Finally, we report exploratory analyses that may inspire future research. We assess whether the relationship between exposure to crime and participation systematically varies across racial groups and find little evidence that it does. We also explore the role of institutional trust. We find little evidence that trust mediates the relationship between crime exposure and participation, but suggestive evidence that pre-victimization levels of trust moderate this relationship.
This study contributes to ongoing debates in three ways. First, we simultaneously consider three measures of crime exposure—contextual crime rates, direct victimization, and perceived neighborhood safety. Second, we examine both turnout and non-electoral participation in two independently-fielded surveys. Third, we use high-resolution administrative crime data alongside validated measures of individual turnout. Embedding these contributions in a preregistered framework limits researcher degrees of freedom, overfitting, and post-hoc theorizing, thereby enhancing the credibility of our findings. Although our approach has many benefits and we take numerous steps to confirm the robustness of our findings, our observational data do not position us to make strong causal claims. Our contribution instead lies in providing a comprehensive descriptive account of the relationship between crime exposure and political participation.
CONCEPTUALIZING EXPOSURE TO CRIME AND PARTICIPATION
One plausible explanation for the competing findings in existing work pertains to how exposure to crime is conceptualized. Scholars who focus on direct victimization often find a mobilizing relationship (Bateson Reference Bateson2012; Berens and Dallendörfer Reference Berens and Dallendörfer2019; Laterzo Reference Laterzo2021; Sønderskov et al. Reference Sønderskov, Dinesen, Finkel and Hansen2022), generally positing that victimization affects participation through ego-relevant mechanisms: victims may seek protection, advocate for justice, find solidarity, or make sense of their experiences through collective engagement. Victimization can also prompt emotional responses like anger (Orth et al. Reference Orth, Cahill, Foa and Maercker2008), fear (Skogan Reference Skogan1987), and anxiety (Albertson and Gadarian Reference Albertson and Gadarian2015), which are associated with increased participation (Valentino et al. Reference Valentino, Brader, Groenendyk, Gregorowicz and Hutchings2011)—particularly for those seeking justice or policy change (Bateson Reference Bateson2012). Some argue participation can serve as a form of “meaning-making” where victims reframe private loss as a public issue and find purpose in activism aimed at prevention, accountability, and honoring loved ones (Bateson Reference Bateson2025). Others point to post-traumatic growth, arguing that victimization can produce psychological change that fosters empowerment and new goals after adversity (Tedeschi and Calhoun Reference Tedeschi and Calhoun1996; Reference Tedeschi, Calhoun, Alex Linley and Joseph2004). These frameworks highlight both expressive and instrumental incentives linking direct exposure and participation.
In contrast, studies of contextual exposure—typically using homicide rates or proximity to violent events as treatments—tend to find that exposure to crime demobilizes (Jones Reference JonesForthcoming; Ley Reference Ley2018; McCarthy, Hagan, and Herda Reference McCarthy, Hagan and Herda2025; Trelles and Carreras Reference Trelles and Carreras2012). These scholars point to sociotropic mechanisms emphasizing contextual conditions to explain how crime shapes participation indirectly through concerns about social order, community well-being, and government performance (e.g., Jones Reference JonesForthcoming; Ley Reference Ley2018; McCarthy, Hagan, and Herda Reference McCarthy, Hagan and Herda2025; Trelles and Carreras Reference Trelles and Carreras2012). They contend that persistent or salient crime demobilizes because people fear public participation (Ley Reference Ley2018; Trelles and Carreras Reference Trelles and Carreras2012), become alienated from politics (Jones Reference JonesForthcoming), or interpret disorder as institutional failure, pushing them to retreat from the state (Blanco and Ruiz Reference Blanco and Ruiz2013; Trelles and Carreras Reference Trelles and Carreras2012).Footnote 1 Additionally, living in environments of sustained violence and crime may expose victims to less episodic and more sustained forms of victimization, where criminal perpetrators subjugate and dominate victims constantly (Moncada Reference Moncada2020). In these cases, victims of sustained criminal subjugation may substitute formal participation with what Moncada (Reference Moncada2020) labels “everyday resistance.”
Related studies often emphasize institutional trust, contending it mediates or moderates the link between crime exposure and participation. Constant disorder may depress faith in institutions, from elected officials to local police (Blanco and Ruiz Reference Blanco and Ruiz2013; Fernandez and Kuenzi Reference Fernandez and Kuenzi2010; Singer et al. Reference Singer, Chouhy, Lehmann, Walzak, Gertz and Biglin2019), leading people to disengage from institutionally sanctioned forms of participation like elections. A related, but conceptually distinct, mechanism is that pre-exposure trust conditions how people respond: victims who trust institutions may seek redress through participation, while those already skeptical may become further alienated and withdraw. Research on the two faces of policing in high-crime communities reinforces this possibility: as Prowse, Weaver, and Meares (Reference Prowse, Weaver and Meares2020) show, residents often experience the state as simultaneously hyper-present through surveillance and under-responsive in providing protection—a pattern of “distorted responsiveness” that erodes institutional trust and may lead victims to interpret subsequent crime exposure as further evidence of state failure.
Still others examine subjective perceptions of crime—such as safety concerns or the belief that crime is worsening—which tend to be associated with lower participation, diminished trust, and reduced democratic satisfaction (Blanco and Ruiz Reference Blanco and Ruiz2013; Fernandez and Kuenzi Reference Fernandez and Kuenzi2010; Rahn and Transue Reference Rahn and Transue1996; Trelles and Carreras Reference Trelles and Carreras2012). Some perception measures tap sociotropic concerns (e.g., beliefs about national crime trends), while others capture ego-relevant feelings (e.g., perceived safety near one’s home). Criminological research underscores that these reflect different constructs: many more respondents worry about crime than report feeling unsafe walking near home (Ferraro Reference Ferraro1995). The latter—used in this study—is generally viewed as a closer indicator of personal fear. Here, we consider these three forms of exposure—direct victimization, contextual crime, and subjective safety perceptions—side by side.
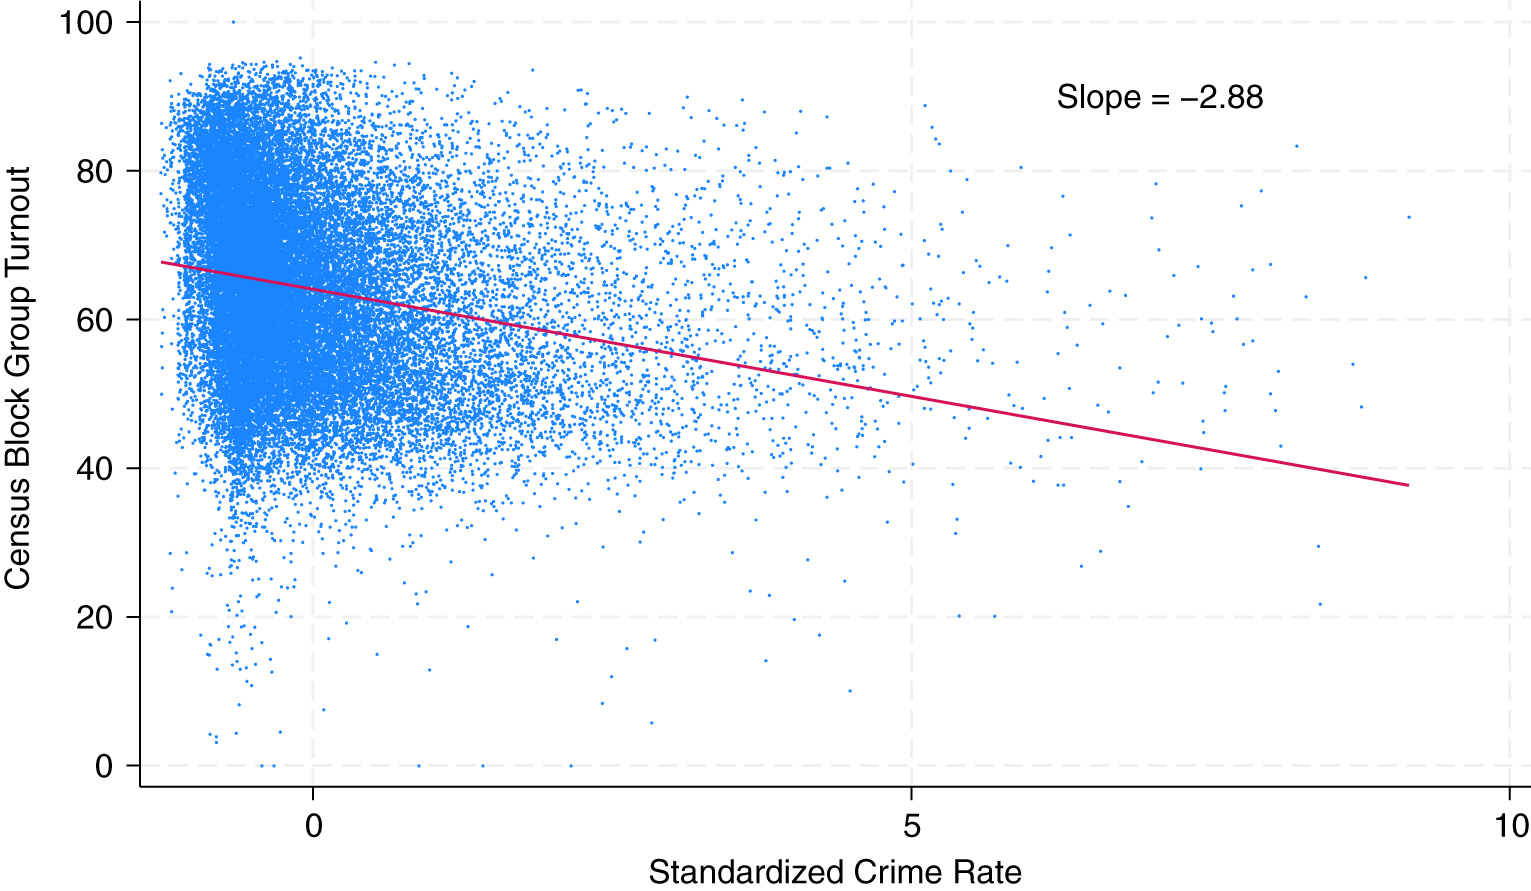
We illustrate the value of our approach with a concrete example. Figure 1 reports the bivariate relationship between per capita crime at the Census block group level and presidential election turnout (Morris and Shoub Reference Morris and Shoub2024).Footnote 2 A clear pattern emerges whereby higher crime areas in these cities have substantially lower turnout rates (a two standard deviation increase in crime is associated with an approximately 6 percentage point lower rate of turnout). However, this aggregate pattern offers only superficial insights: it could be a product of residents’ responses to contextual crime, lower rates of turnout among those who have been directly victimized, or an array of other individual- or contextual-level forces that are correlated with local crime rates. By analyzing individual level behavior merged with neighborhood crime and demographic data, our study allows us to explore these different mechanisms with greater nuance.
Census Block Groups and Turnout
Note: Figure illustrates bivariate relationship between Census block group crime rate (standardized to have a mean of 0 and standard deviation of 1 within cities) and administratively reported turnout rates calculated using data from Morris and Shoub (Reference Morris and Shoub2024).

Figure 1. Long description
The horizontal X axis is labeled Standardized Crime Rate with major tick marks at 0, 5, and 10. The vertical Y axis is labeled Census Block Group Turnout with tick marks from 0 to 100 in increments of 20.
* Data Distribution: A dense cloud of blue data points is concentrated on the left side of the graph, primarily between -1 and 2 on the X axis and between 40 and 90 on the Y axis. As the crime rate increases toward the right, the density of points decreases significantly, becoming sparse beyond a crime rate of 5.
* Trend Line: A solid magenta line starts at approximately (minus 1, 68) and slopes downward to the right, ending near (9, 38).
* Annotation: In the upper right quadrant, text reads Slope equals minus 2.88.
* Grid: The background features a light gray dashed grid.
Another possibility is that crime shapes different forms of engagement in different ways. Elections are administered by the state, offer individual voters limited agenda-setting power, and constrain choices to those set by elites. This contrasts with non-electoral activities, such as protesting or attending community meetings. If crime and insecurity reduce trust in government without dampening political efficacy, as some scholars argue (Blanco and Ruiz Reference Blanco and Ruiz2013; Fernandez and Kuenzi Reference Fernandez and Kuenzi2010; Singer et al. Reference Singer, Chouhy, Lehmann, Walzak, Gertz and Biglin2019), crime may prompt individuals to “turn away from electoral politics to express their grievances in the more active forms of political participation” (Trelles and Carreras Reference Trelles and Carreras2012, 98). Additionally, if those exposed to crime participate as a form of post-traumatic growth, to better understand their lived experiences, or to find solidarity in collective activism (Bateson Reference Bateson2025; Tedeschi and Calhoun Reference Tedeschi and Calhoun1996; Reference Tedeschi, Calhoun, Alex Linley and Joseph2004), then post-exposure mobilization is more likely to flow into sustained collective activities, like joining an organization, than individual, one-time acts like voting.
Existing empirical work offers suggestive but mixed support for this possibility. Studies focusing on contextual exposure tend to find decreases in turnout (Jones Reference JonesForthcoming; Ley Reference Ley2018; McCarthy, Hagan, and Herda Reference McCarthy, Hagan and Herda2025; Moffett-Bateau Reference Moffett-Bateau2024; Trelles and Carreras Reference Trelles and Carreras2012), though some find that direct victimization increases turnout (Berens and Dallendörfer Reference Berens and Dallendörfer2019; Sønderskov et al. Reference Sønderskov, Dinesen, Finkel and Hansen2022). Studies of non-electoral participation—including protest, party meetings, or expressive behavior—tend to find mobilizing effects, though they generally examine direct victimization (e.g., Bateson Reference Bateson2012; Laterzo Reference Laterzo2021, but see Córdova Reference Córdova2019). Here, we consider relationships between multiple forms of crime exposure and both forms of participation.
Prior studies also vary widely in measurement strategies—especially in how contextual crime is defined. Some use coarse administrative data like state homicide rates (Trelles and Carreras Reference Trelles and Carreras2012), subjective perceptions of gang control or insecurity (Córdova Reference Córdova2019; Trelles and Carreras Reference Trelles and Carreras2012), or instances of strategic cartel violence (Ley Reference Ley2018). Measures of participation also vary, with most relying on self-reports that may be susceptible to social desirability (e.g., Berens and Dallendörfer Reference Berens and Dallendörfer2019; Trelles and Carreras Reference Trelles and Carreras2012), and others using aggregate data that risk ecological fallacy (e.g., McCarthy, Hagan, and Herda Reference McCarthy, Hagan and Herda2025). These choices reflect practical constraints, but come with tradeoffs. Our administrative, geographically granular data linked to validated individual level responses help mitigate these measurement concerns.
Finally, many studies emphasize particular subpopulations or report conditionality tied to specific forms of crime. For example, Sønderskov et al. (Reference Sønderskov, Dinesen, Finkel and Hansen2022) find positive effects of violent—but not property—victimization on turnout, while Berens and Dallendörfer (Reference Berens and Dallendörfer2019) find positive effects of nonviolent but not violent victimization. Laterzo (Reference Laterzo2021) finds heterogeneous effects by race, gender, and neighborhood safety, but only for party meeting attendance. Some studies, like the Moffett-Bateau (Reference Moffett-Bateau2024) ethnography of poor Black women in Chicago, focus on theoretically important but demographically narrow populations. These designs offer valuable insights but may risk overfitting to specific contexts, and some findings may stem from exploratory analyses that do not always replicate cleanly. We mitigate these risks through preregistration and by clearly flagging exploratory analyses.
The U.S. Context
Our study is conducted exclusively in major cities in the United States. While the cities we study are home to over 30 million people, large urban centers in the United States have distinctive features. Further, the United States has notably higher levels of violent crime than other developed democracies (Kalish Reference Kalish1988). For example, homicide rates in Canada, South Korea, and Denmark were 1.98, 0.48, and 0.84 per 100,000 residents, respectively, in 2023. The rate was much higher—5.76 per 100,000—in the United States, but higher still in countries like Colombia (24.91), Ecuador (45.72), and Nigeria (15.75) (United Nations Office on Drugs and Crime 2025). Violence in the United States is particularly concentrated in poor communities of color (Lodge et al. Reference Lodge, Hoyo, Gutierrez, Rappazzo, Emch and Martin2021). This said, the United States does not stand out from its peers in terms of property crime (van Kesteren, van Dijk, and Mayhew Reference van Kesteren, van Dijk and Mayhew2014), nor is it more violent than many nations on the American continents (United Nations Office on Drugs and Crime 2025). Further, in similarly racially diverse countries like Brazil, crime is also highly segregated, affecting people of color more than white residents (Schwartzman Reference Schwartzman2020).
Perhaps as importantly, the United States has lower levels of institutional trust than many of its counterparts, which may moderate the impact of crime on participation. For example, in 2024, only 15% of the U.S. public reported having confidence in the national government, compared to 55% of the public in Denmark (OECD 2025). Taken together, differences in baseline institutional trust and violence offer plausible reasons why the participatory consequences of victimization may diverge across settings. Ultimately, our findings are less likely to generalize to high-trust and low-crime nations like Denmark than to low-trust and high-crime nations. Similarly, they may not generalize to post-conflict societies like those studied in Blattman (Reference Blattman2009) where democratic institutions are weaker, participatory cultures are still forming, and exposure to violence typically involves organized civil conflict rather than sustained, unorganized crime. We return to the question of the generalizability of our findings in the discussion when considering our findings within the broader literature.
DATA AND MEASURES
Our analysis focuses on individuals living in ZIP codes that are entirely within 21 of the 30 largest cities in the United States. We selected these 21 cities based on preliminary assessments of the availability of public-facing data on the locations of reported crimes.Footnote 3 We leverage data from two survey sources. First, we contracted with Dynata to recruit approximately 90 respondents from each targeted city to complete an original survey (Major Cities Survey [MCS]). Participants were directed to our survey and provided their ZIP code to validate their eligibility (
$ N $
 = 1,819).Footnote 4 We used custom quotas within each city to ensure that respondents’ demographics approximated Census estimates of the racial, gender, and age composition of each city. Second, we use CES respondents residing in those targeted ZIP codes from federal election years 2016–24 (Ansolabehere et al. Reference Ansolabehere, Schaffner, Rivers, Luks, Broockman, Warshaw and Kuriwaki2016–Reference Ansolabehere, Schaffner and Luks2024). Pooling across years, our analysis leverages 29,025 CES respondents, including 6,302 responses to the 2024 survey which were not fully published at the time of preregistration. See Tables SM.A2 and SM.A3 in the Supplementary Material for the descriptive characteristics of our samples and the distributions of respondents across cities, respectively. In each case, we use a Census crosswalk file to match respondents to their ZCTA based on their ZIP code.Footnote 5
Measures of Exposure to Crime
We attempted to gather data on reported crimes for the years 2016 through 2024 from public-facing city data portals and were mostly successful (see Section SM A.1 of the Supplementary Material for details about this process). For most cities, we used the latitude and longitude of each reported crime to spatially map the location to a ZCTA’s polygon area using R (R Core Team 2024) with the sf (Pebesma Reference Pebesma2018; Pebesma and Bivand Reference Pebesma and Bivand2023) and tidycensus (Walker and Herman Reference Walker and Herman2025) packages.Footnote 6 Some cities do not report latitude and longitude, but do report the city block (including ZIP code) where reported crimes occurred. Once crimes were matched to a ZCTA, a tally of the total number of crimes of any type (violent or not) reported within each ZCTA in each year was calculated.Footnote 7 Per our preregistered analysis plan, within each city we divided the total number of reported crimes by the sum of the total number of residents residing in the ZCTA (five-year ACS estimate for that year; U.S. Census Bureau 2024) and the total number of people employed by businesses in the ZCTA (ZIP code-level estimates from Census County Business Pattern Data; U.S. Census Bureau 2022).Footnote 8
Because cities vary in their reporting systems and norms (Rice and Ellison Reference Rice and Ellison2025), we standardize our calculated ZCTA-level rates to have a mean of zero and standard deviation of one across ZCTAs and years within each city.Footnote 9 Thus, our measure captures annual crime in respondents’ ZCTAs relative to the distribution of annual crime rates across ZCTAs in the respondent’s city across years.
In the MCS, we measure victimization using items adapted from the National Crime Victimization Survey (NCVS; Bureau of Justice Statistics)—a high-quality, government-sponsored survey that is billed as “the nation’s primary source of information on criminal victimization” (Bureau of Justice Statistics 2025). We ask respondents if they had been the victim of each of four attempted or successful crimes in the last 12 months: (1) a home break-in, (2) vehicle or vehicle part theft, (3) theft of a personal belonging, and (4) physical threat or attack with a weapon (full question wording for all items is provided in Section SM A.2 of the Supplementary Material).
Per our pre-analysis plan (PAP), we create a count of victimization instances that ranges from 0 to 4.Footnote 10 The CES surveys each asked respondents a single yes/no question: “Over the past year have you [b]een a victim of a crime?” We report averages for each crime exposure variable broken down by respondent demographics in Table SM.A4 in the Supplementary Material, as well as comparable estimates drawn from the 2024 NCVS. In Figure SM.A1 in the Supplementary Material, we report the relationship between victimization rates among key demographic groups captured in the MCS and CES surveys and rates reflected in 2024 NCVS.Footnote 11 The patterns that emerge are reassuring: groups that reported high rates of victimization in the “gold standard” NCVS survey tended to report high rates of victimization in both the CES and MCS surveys.Footnote 12 This said, virtually any measure of victimization may be distorted by biased self-reports: official crime rates are calculated based on crimes that individuals report to the police and, although the NCVS bills itself as having the advantage of capturing victimization that is not reported to the police, it does so by relying on self-reports. Replication data are available at Doherty et al. (Reference Doherty, Agustin Markarian, Whalen and Garbarski2026).
ANALYSIS AND FINDINGS
We registered our PAP prior to fielding the MCS and before having access to data from the 2024 CES.Footnote 13 Here, we pool CES data from federal election years 2016–24 and report preregistered analysis restricting the analysis to the 2024 data in Tables SM.A12–SM.A15 in the Supplementary Material.Footnote 14 Per our analysis plan, all estimates are from mixed effects models with ZCTA-level random intercepts and city fixed effects, clustering standard errors at the city level.Footnote 15 Pooled CES analyses also include year fixed effects.
For each dataset and outcome, we focus on estimates from two model specifications. Model 1 includes the victimization and crime rate measures, along with respondent demographics (race, gender, age, educational attainment, income, and an indicator for income refusals). We control for three ZCTA characteristics: area in square miles, residential population, and number of people employed in the ZCTA. Model 2 adds ZCTA-level controls for an array of ZCTA-level demographics that are likely to be related to crime rates, but difficult to situate in the causal chain between crime exposure and participation including percent in ZCTA: (1) identifying as white (only, non-Hispanic), (2) Black (only, non-Hispanic), (3) Asian (only, non-Hispanic), (4) Hispanic (any race), (5) with an HS diploma or more, (6) with a BA or more, (7) living in poverty, and (8) 65+ years old.Footnote 16 Estimates from these models are reported in columns 2 and 3 of Tables SM.A5–SM.A10 in the Supplementary Material. We report a preregistered “demographics only” specification for interested readers in column 1 of those tables.
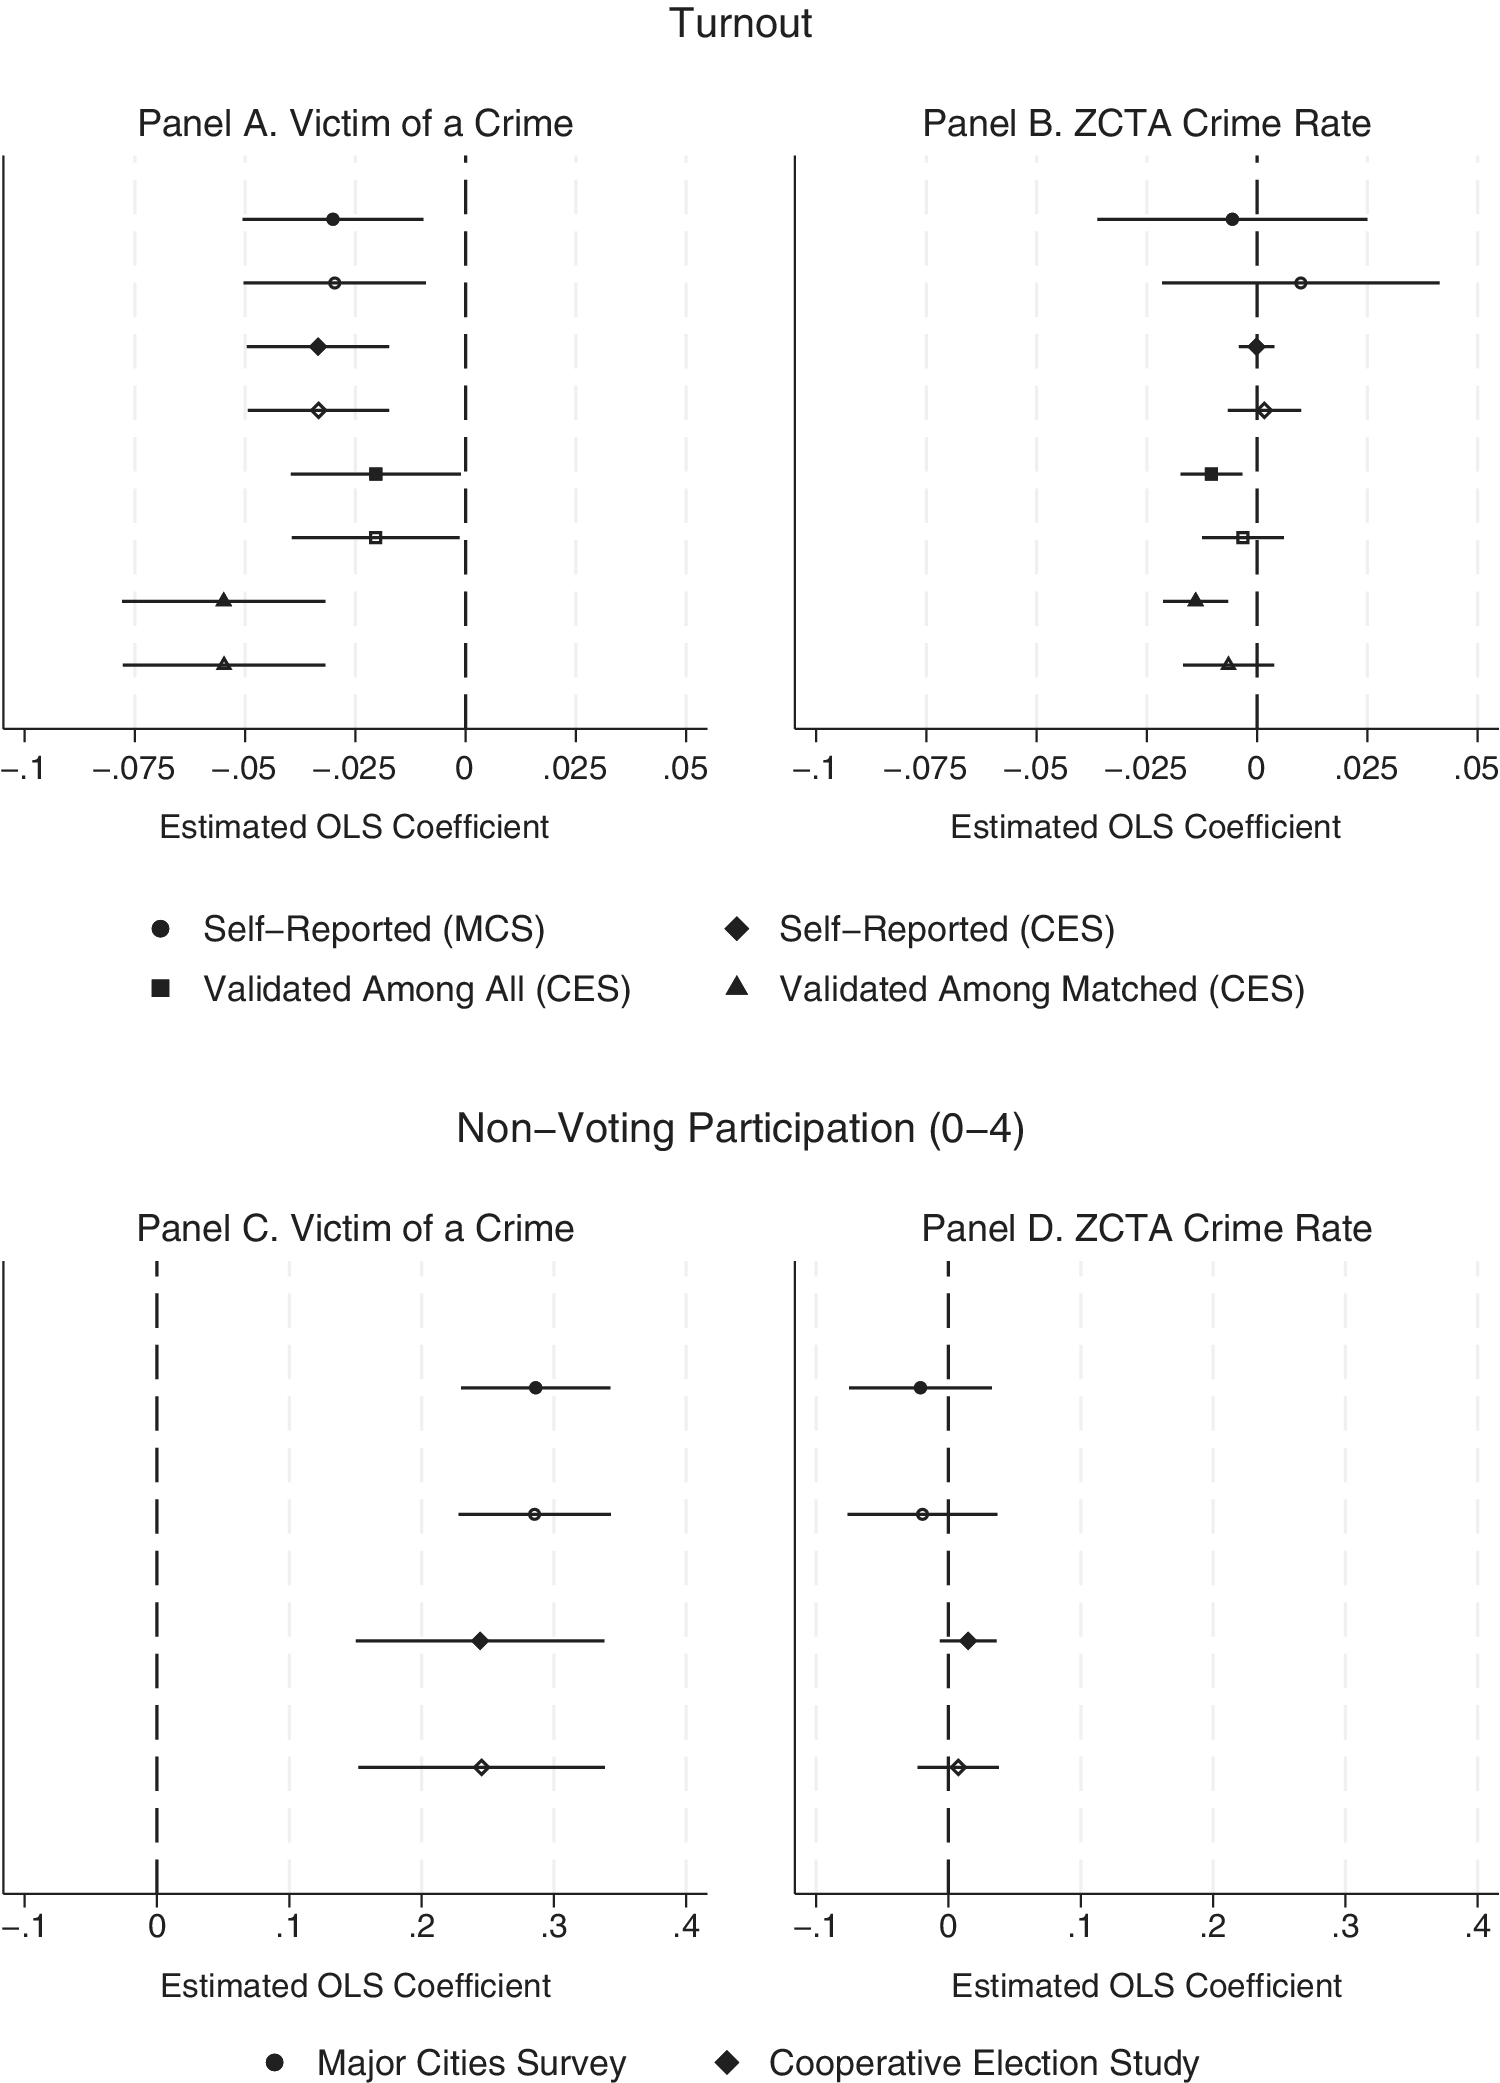
In Panel A of Figure 2, we consider the relationship between victimization and turnout. We consider self-reported turnout in the most recent federal election in the MCS and CES surveys, as well as two measures of validated turnout from the CES. In each case, we report coefficients from model 1 (solid markers) and model 2 (hollow markers).
Estimated Effects of Victimization and Crime Rates on Participation
Note: Solid markers are estimates from models controlling for respondent demographics and three basic ZCTA-level variables (area, number of residents, and number employed). Hollow markers are from models also controlling for percentage of residents in respondents’ ZCTAs: (1) identifying as white (only, non-Hispanic), (2) Black (only, non-Hispanic), (3) Asian (only, non-Hispanic), (4) Hispanic (any race), (5) with an HS diploma or more, (6) with a BA or more, (7) living in poverty, and (8) 65+ years old. Whiskers are 95% confidence intervals. Full models reported in Tables SM.A5–SM.A10 in the Supplementary Material. Observations in voting models: self-reported (MCS;
$ N $
 = 1,819); self-reported (CES;
$ N $
 = 21,461); validated among all (CES;
$ N $
 = 29,025); validated among matched (CES;
$ N $
 = 18,644). Number of observations in nonvoting participation models: Major Cities Survey (
$ N $
 = 1,819); Cooperative Election Study (
$ N $
 = 22,778).

Figure 2. Long description
A multi-panel coefficient plot organized into two rows. The top row is titled Turnout and the bottom row is titled Non-Voting Participation (0-4). Each row contains two panels: Victim of a Crime (left) and Z C T A Crime Rate (right). The x-axis for all panels represents the Estimated O L S Coefficient, with a vertical dashed line at zero indicating no effect.
Top Row: Turnout
- Panel A (Victim of a Crime): All estimates are negative, ranging from approximately -0.02 to -0.06. Data includes Self-Reported M C S (circles), Self-Reported C E S (diamonds), Validated Among All C E S (squares), and Validated Among Matched C E S (triangles). Solid markers represent basic controls; hollow markers represent full controls. All 95% confidence interval whiskers are entirely to the left of zero.
- Panel B (Z C T A Crime Rate): Estimates are clustered near zero. Most whiskers cross the zero line, indicating statistically insignificant effects, though some point estimates are slightly negative or positive.
Bottom Row: Non-Voting Participation (0-4)
- Panel C (Victim of a Crime): All estimates are positive and statistically significant, ranging from approximately +0.2 to +0.3. Data includes Major Cities Survey (circles) and Cooperative Election Study (diamonds). All whiskers are entirely to the right of zero.
- Panel D (Z C T A Crime Rate): Estimates are centered very close to zero with whiskers crossing the zero line, indicating no significant effect on non-voting participation.
The estimated effect of victimization is negative and statistically significant across turnout measures, surveys, and model specifications. In the MCS survey, a one-unit increase in victimization on the 0–4 measure is associated with a 3 percentage point decrease in the likelihood of turning out.Footnote 17 The coefficient on the victimization indicator in the CES is approximately
$ -0.03 $
 in each model. Estimates from the validated turnout models are similar. When we treat respondents who were matched to the voter file and validated as having turned out as voters and all other respondents as not voting, victimization is associated with a 2 percentage point decrease in the probability of turning out. When we only count those who were matched to the voter file, but did not vote as nonvoters (dropping unmatched respondents from the analysis), those who report having been victims are almost 5 percentage points less likely to turn out.
Panel B of Figure 2 reports coefficients on the crime rate measure from the same set of models. The relationships between crime rate and self-reported turnout are small and statistically insignificant. Estimates from the validated turnout models suggest that a two standard deviation increase in the ZCTA-level crime rate is associated with an approximately 2–3 percentage point decrease in turnout. However, the coefficients are attenuated and not statistically significant when more robust ZCTA-level controls are included in the models.
In Panels C and D, we repeat the same exercise, specifying tallies of the number of nonvoting political acts respondents reported participating in over the past year as our outcome. On the MCS survey, activities included: (1) participating in a protest, (2) discussing a political issue with someone, (3) contacting a public official, and (4) attending a meeting about a political issue (
$ M $
 = 1.34;
$ SD $
 = 1.01). The CES items included: (1) attending a local political meeting, (2) putting up a political sign, (3) working for a candidate or campaign, and (4) donating to a candidate or political organization (
$ M $
 = 0.61;
$ SD $
 = 0.93).Footnote 18
In contrast to the estimates from the voting models, victimization is associated with increased nonvoting political participation. The coefficients in the MCS and CES data are approximately 0.29 and 0.23, respectively.Footnote 19 For context, in each survey, the estimated change in non-electoral participation associated with a one unit increase in victimization is comparable to that associated with a respondent having a four year college degree as their highest level of educational attainment, rather than high school diploma. The estimates in Panel D show little evidence of a relationship between ZCTA-level crime rates and nonvoting participation.
Next, per our PAP, using the MCS data, we assess whether subjective safety perceptions are associated with political participation (net of any relationship with our other exposure measures), as well as the plausibility of the argument that subjective safety perceptions are a mechanism for the relationships we find between victimization and participation. Our perceived neighborhood safety measure averages two five-point items that asked respondents to rate how safe they feel walking in their neighborhood during the day and at night. When we add this measure to the model 1 and 2 turnout specifications discussed above, the coefficient is positive, but not statistically significant in the voting models (
$ p=0.378 $
 and 0
$ .418 $
 , respectively; see columns 4 and 5 in Table SM.A5 in the Supplementary Material) and the coefficient on the victimization measure is essentially unchanged.Footnote 20
When we repeat this exercise in the nonvoting participation models we find that perceived neighborhood safety is positively associated with participation. A two standard deviation (approximately 2 units on the 1–5 measure) increase in perceived safety is associated with reported participation in approximately 0.15 more of the 4 acts (see columns 4 and 5 of Table SM.A9 in the Supplementary Material). This pattern suggests that subjective concerns about crime can be demobilizing—even after controlling for more objective measures of exposure that might be expected to impact safety concerns. Our data do not position us to identify the mechanisms driving this pattern. However, safety concerns that operate independently of objective exposure to crime may reflect more general social anxieties. These anxieties may make people reluctant to engage in the collective action or political dialogue the non-electoral acts we consider entail, but be unrelated to the relatively solitary act of voting. Before proceeding, we note that the coefficient on victimization is essentially unchanged in these models, casting doubt on the notion that perceived safety is a key mediator of that relationship.
Robustness Checks and Exploratory Analysis
In this section, we report findings from several robustness checks and exploratory analyses.Footnote 21 We begin with three preregistered robustness tests. First, in Tables SM.A19 and SM.A20 in the Supplementary Material, we show that our main results hold when we calculate ZCTA-level crime rates using only the residential population, rather than the preregistered denominator that includes both residents and workers. Under this alternative specification, our findings are broadly similar, but the negative coefficient on the crime rate variable reaches conventional levels of statistical significance in three (rather than two) of the four CES validated turnout models.
Second, we address the possibility that our victimization findings are confounded by variation in respondents’ routine exposure to public spaces, adding measures of reported average weekday and weekend time spent away from home to our MCS models. Including these covariates does not meaningfully affect the coefficients on victimization (see column 6 in Tables SM.A5 and SM.A9 in the Supplementary Material). The patterns hold when we allow these controls to exert nonlinear effects in Table SM.A23 in the Supplementary Material by “dummying out” our ordinal measures of time out of the house, as well as the two variables used to construct our perceived neighborhood safety measure.Footnote 22
Third, we replicate our analysis using Chicago residents who completed the 2024 or 2025 wave of the Cook County Community Survey (CCCS), fielded in early 2024 and early 2025 (see Section SM A.2.3 of the Supplementary Material for details). Our non-electoral participation findings (pooling 2024 and 2025 CCCS surveys;
$ N $
 = 1,932) are virtually identical in this dataset.Footnote 23 The estimated relationship between victimization and turnout in the 2024 presidential election (2025 CCCS survey only;
$ N $
 = 662) is similar in direction and magnitude, but not statistically significant, possibly due to the smaller sample size (see Tables SM.A21 and SM.A22 in section SM A.9 of the Supplementary Material.)
Next, although our observational data do not position us to make strong causal claims, we report findings from two (unregistered) analyses to partially address concerns that omitted variable bias is shaping our estimated relationships. We first consider the possibility that our estimated victimization and perceived safety relationships are contaminated by omitted ZCTA-level factors by re-estimating our models using ZCTA fixed effects, and excluding all ZCTA-level covariates (see Tables SM.A24 and SM.A25 in the Supplementary Material). The coefficients on our predictors of interest—victimization and perceived safety—are similar in these models.Footnote 24
We then leverage the 2020–22 CES Recontact Survey to consider the relationship between changes in exposure to crime and participation (Ansolabehere, Schaffner, and Luks Reference Ansolabehere, Schaffner and Luks2024). We restrict our analysis to respondents residing in ZCTAs for which we have crime data who did not report having been victimized in the 2020 wave of the survey and whose ZIP code in 2022 matched their 2020 ZIP code. We estimate models predicting each of three measures of 2022 participation—reported turnout, validated turnout, and non-electoral participation (0–6). In each, we include a lagged dependent variable, an indicator for reported victimization in the 2022 wave, a measure of change in ZCTA-level crime rate, and respondent demographics (see Table SM.A26 in the Supplementary Material). Estimates from these models are underpowered (
$ N $
 = 640 to 788 respondents across models, only 31 of whom were “new victims” in 2022). Additionally, the correlation between ZCTA-level crime rates in 2020 and 2022 is 0.942 in our data. This said, the point estimates are similar to those reported in our main analysis. The estimated “effects” of victimization on reported and validated turnout are
$ -0.055 $
 and
$ -0.015 $
 , respectively—quite similar to the comparable estimates of
$ -0.033 $
 and
$ -0.020 $
 reported in Figure 2. The estimated relationship tied to non-electoral participation is almost identical to that reported in Table SM.A15 in the Supplementary Material (where we use the same 6-item battery and the 2024 CES data), but somewhat weaker than the relationship we find in our pooled CES data.
Avenues for Future Research
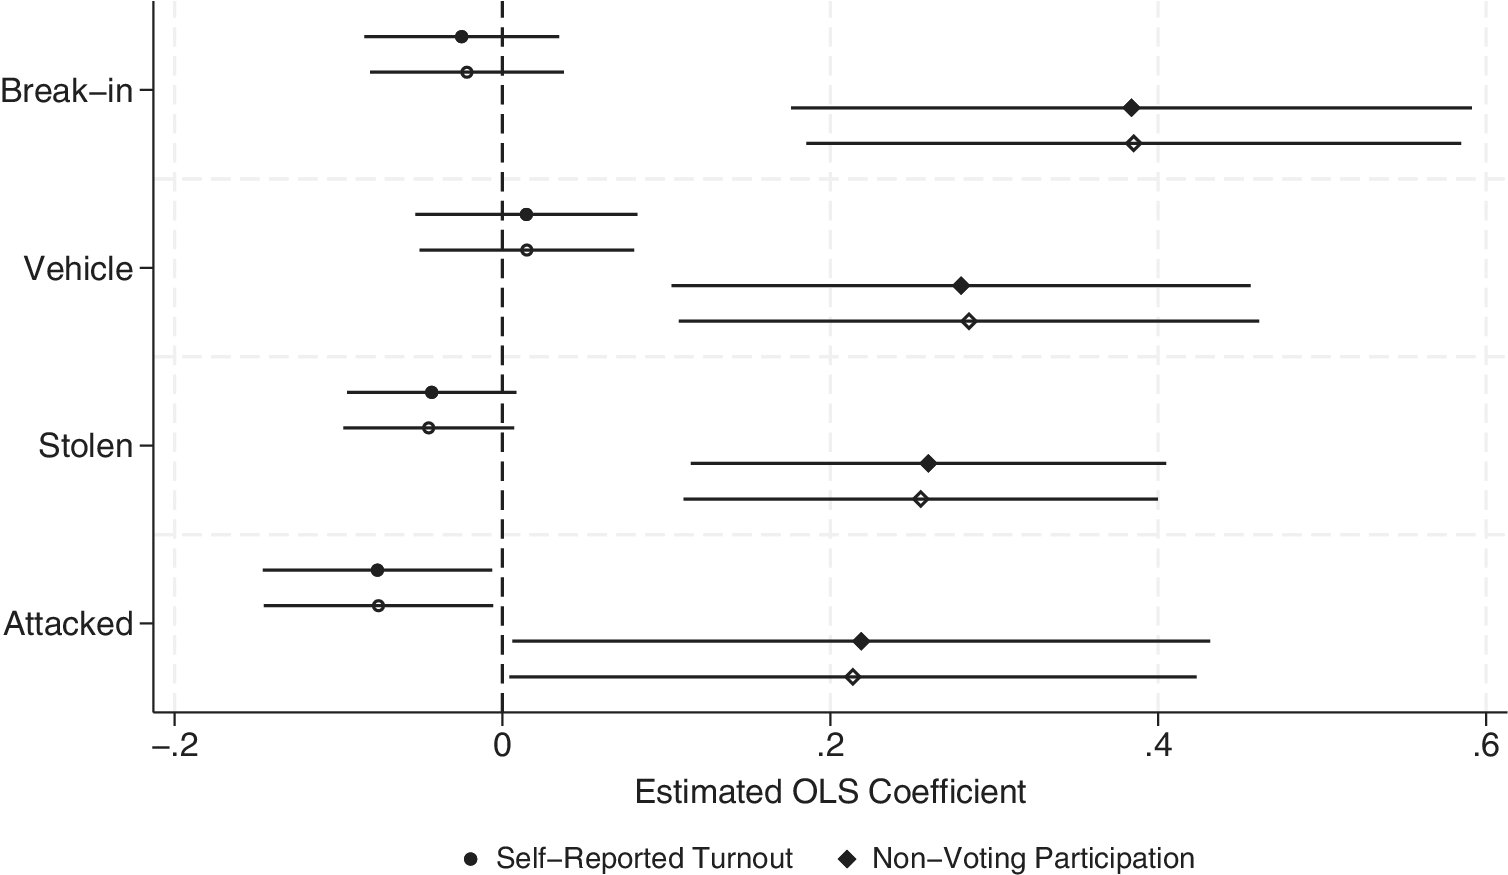
We next turn to (unregistered) exploratory analyses that suggest potential pathways for future research. In Figure 3, we examine whether the effect of victimization varies by type of incident, using indicators for each of the four victimization items included on the MCS (see Table SM.A27 in the Supplementary Material for regression models). All four types of victimization are positively associated with nonvoting forms of political participation, but only physical assault is significantly and negatively associated with turnout. One possible explanation for this pattern is that property crimes—particularly those that occur when the victim is not present, such as break-ins or vehicle theft—generate anger or a desire for redress without inducing the same sense of personal threat. These emotions may motivate individuals to engage in non-electoral forms of participation, such as contacting officials or attending public meetings. Violent crimes like physical assault may also provoke fear and alienation, which may lead individuals to specifically disengage from formal political processes like voting.
Estimated Effects of Type of Victimization on Participation
Note: Solid markers are estimates from models controlling for respondent demographics and basic ZCTA-level variables (area, number of residents, and number employed). Hollow markers are from models also controlling for percentage of ZCTA residents: (1) identifying as white (only, non-Hispanic), (2) Black (only, non-Hispanic), (3) Asian (only, non-Hispanic), (4) Hispanic (any race), (5) with an HS diploma or more, (6) with a BA or more, (7) living in poverty, and (8) 65+ years old. Whiskers are 95% confidence intervals. See Table SM.A27 in the Supplementary Material for regression models.
$ N $
 = 1,819.

Figure 3. Long description
A coefficient plot with a horizontal x-axis labeled Estimated O L S Coefficient ranging from negative 0.2 to 0.6. A vertical dashed line marks the zero point. The y-axis lists four victimization types from top to bottom: Break-in, Vehicle, Stolen, and Attacked. Each category contains two sets of markers with horizontal 95 percent confidence interval whiskers. Circles represent Self-Reported Turnout and diamonds represent Non-Voting Participation. Solid markers indicate models with demographic and basic Z C T A controls, while hollow markers indicate models with additional socioeconomic controls.
* Break-in: Turnout estimates are near zero. Non-Voting Participation estimates are strongly positive, centered around 0.4.
* Vehicle: Turnout estimates are slightly positive, just above zero. Non-Voting Participation estimates are positive, centered around 0.28.
* Stolen: Turnout estimates are slightly negative, centered around negative 0.05. Non-Voting Participation estimates are positive, centered around 0.25.
* Attacked: Turnout estimates are negative, centered around negative 0.08. Non-Voting Participation estimates are positive, centered around 0.22.
In all categories, the Non-Voting Participation coefficients are significantly higher than the Self-Reported Turnout coefficients, and the inclusion of additional controls (hollow markers) slightly shifts the estimates toward zero compared to the basic models (solid markers).
We observe similar patterns when we replicate our model 2 specification using estimates of ZCTA-level violent crime rates and then, separately, nonviolent crime—at least in the CES data (see Tables SM.A28 and SM.A29 in the Supplementary Material).Footnote 25 Even after controlling for an array of ZCTA-level demographics, a two standard deviation increase in the violent crime rate is associated with an approximately 3 percentage point, statistically significant, decrease in turnout.Footnote 26 In contrast, the coefficients in the nonviolent crime rate models are tiny and not statistically significant.Footnote 27
Next, we disaggregate our non-electoral participation outcomes into their constituent acts and report estimates from both model 1 and model 2 specifications in Tables SM.A32–SM.A35 in the Supplementary Material. We find that victimization predicts increased engagement across all nonvoting behaviors except for discussing politics. These patterns suggest that victimization broadly motivates active, outward-facing non-electoral engagement and is not specifically limited to less-conventional forms of engagement like protests.
Another possibility is that the relationships between exposure to crime and patterns of participation vary across groups, particularly race which is closely linked with crime and surveillance in the United States (Lodge et al. Reference Lodge, Hoyo, Gutierrez, Rappazzo, Emch and Martin2021). In Tables SM.A36 (MCS) and SM.A37 (CES) in the Supplementary Material, we replicate our model 1 specification, interacting our measures of exposure to crime with indicators for respondents’ reported race. The interaction coefficients of interest are almost all statistically insignificant and do not follow any discernible pattern across models and surveys.Footnote 28
Finally, although our data do not position us to identify the mechanisms driving our findings, trust in government may play a role—particularly given that crime exposure is associated with less participation in government-run elections but more participation in other forms. We assess whether our data are consistent with a dynamic where exposure to crime affects trust, which, in turn, affects participation. We also consider whether trust in government authorities is better thought of as a more stable disposition that, like other markers of social connection, insulates individuals from any demobilizing effects of exposure to crime (Moffett-Bateau Reference Moffett-Bateau2024). If so, trust may condition the relationship between exposure and participation even if it is not affected by exposure to crime.
We explore these possibilities in several ways, emphasizing that these analyses are not preregistered, nor are the findings definitive. First, in Table SM.A38 in the Supplementary Material, we use data from the 2024 CES to assess whether exposure to crime is associated with reported trust in state and federal governments (items only available on 2024 postelection wave). We find that victimization is associated with lower reported trust in both levels of government, but no relationship between contextual exposure and trust in either form of government. We then add these measures of trust in federal and state governments to our participation models in column 4 of Tables SM.A12–SM.A15 in the Supplementary Material. The coefficient on our victimization measure is only slightly attenuated in each turnout model (self-reported, validated, and validated among matched) and slightly amplified in our non-electoral participation model, casting doubt on the notion that trust substantially mediates the relationship between crime exposure and participation. In columns 5 and 6, we re-estimate our model 1 and 2 specifications, including interactions between each trust measure and our victimization and crime rate measures and find that the estimated demobilizing effects of victimization on turnout are particularly strong among those low on trust in the state government and attenuated among those higher on trust. The coefficient on this interaction only reaches statistical significance in our self-reported turnout models. The point estimates in the validated turnout models are similar, but the standard errors are notably larger. The other interactions in the turnout models, as well as interactions in the non-electoral participation models, fall well short of conventional thresholds of statistical significance.
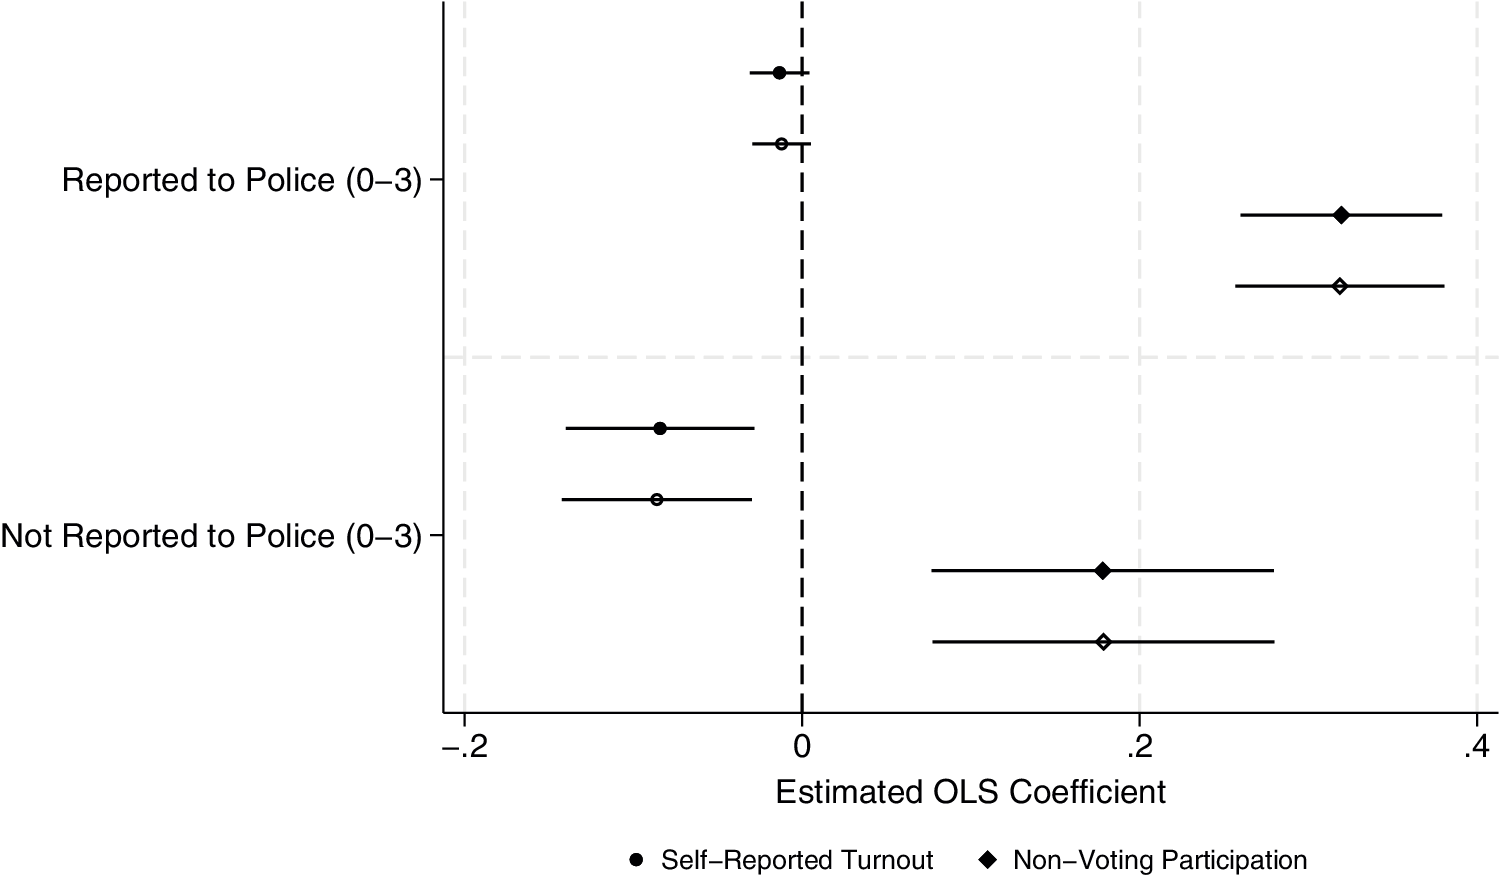
In the MCS data, we further explore the role of trust by disaggregating our victimization measure based on follow-up questions that asked victims whether they reported the crime to the police. We posit that low-trust individuals will be less inclined to report victimization to the police. We examine whether the relationship between reported victimization and participation differs from the relationship between unreported victimization and participation in Table SM.A39 in the Supplementary Material (using measures of the number of reported and unreported instances of victimization).Footnote 29 Figure 4 reports estimates of interest. We find a negative association between unreported victimization and turnout, but not between reported victimization and turnout. Both victimization measures are associated with higher rates of non-electoral participation, though the relationship is somewhat stronger for reported victimization.
Victimization, by Whether Reported to Police
Note: Solid markers are estimates from models controlling for respondent demographics and basic ZCTA-level variables (area, number of residents, and number employed). Hollow markers are from models also controlling for percentage of ZCTA residents: (1) identifying as white (only, non-Hispanic), (2) Black (only, non-Hispanic), (3) Asian (only, non-Hispanic), (4) Hispanic (any race), (5) with an HS diploma or more, (6) with a BA or more, (7) living in poverty, and (8) 65+ years old. Whiskers are 95% confidence intervals. See Table SM.A39 in the Supplementary Material for regression models.

Figure 4. Long description
A coefficient plot with a horizontal x-axis labeled Estimated O L S Coefficient ranging from negative 0.2 to 0.4. A vertical dashed line marks the zero point. The y-axis contains two categories.
1. Reported to Police (0-3). Located at the top. This category shows two sets of markers. Circles representing Self-Reported Turnout are clustered near zero, slightly on the negative side. Diamonds representing Non-Voting Participation are positioned far to the right, centered around 0.3.
2. Not Reported to Police (0-3). Located at the bottom. Circles for Self-Reported Turnout are positioned to the left of zero, centered around negative 0.1. Diamonds for Non-Voting Participation are positioned to the right of zero, centered around 0.18.
In both categories, solid markers represent models controlling for demographics and Z C T A variables, while hollow markers represent models with additional controls for race, education, poverty, and age. Horizontal whiskers extending from each marker indicate 95 percent confidence intervals.
Taken together, these patterns are consistent with the notion that the effects of victimization on participation depend on how much victims trust government. Trust appears to insulate individuals from the demobilizing effects of victimization in the domain of turnout and, perhaps, enhance the mobilizing effects of victimization when it comes to non-electoral participation.
DISCUSSION
This study offers new insight into a longstanding question in political behavior: how does exposure to negative events government is expected to prevent affect political participation? Our preregistered findings draw on multiple surveys to build on existing research. We consider the relationships between three measures of exposure to crime—direct victimization, local crime rates, and perceptions of neighborhood safety—and both turnout (including validated turnout) and non-electoral forms of participation. To the best of our knowledge, our findings offer the most comprehensive analysis of the relationship between exposure to crime and political participation in the U.S. context to date.
We find that direct victimization is consistently associated with higher levels of non-electoral participation but lower levels of turnout. The relationships between contextual crime rates and participation, by contrast, are far less consistent and potentially limited to a negative association between violent crime rates and turnout uncovered in exploratory analysis. This may be due to the fact that victimization tends to be a fairly rare and distinctive experience, whereas people may get used to persistent crime in their neighborhoods. Additionally, perceptions of neighborhood safety are positively associated with non-electoral engagement but unrelated to turnout, suggesting that subjective safety concerns can affect participation in ways that are independent of the effects of more objective exposure to crime. The findings suggest that personal, direct exposure to crime plays a particularly central role in shaping participation. They also suggest that victimization “redirects” the inclination to participate from state-run avenues to other forms of political engagement.
In addition to our preregistered analysis, we conduct an array of exploratory tests to deepen our inquiry. We show that our results are robust to alternative approaches to operationalizing crime rates and the inclusion of controls for a key potential confound: time spent outside one’s home. We also find similar patterns when analyzing additional surveys of Cook County residents. Beyond these preregistered exploratory tests, we report additional analyses seeking to account for omitted variable bias and probing heterogeneous effects across racial groups (which we find little evidence of).
Our exploratory analysis also suggests that trust plays an important role in shaping responses to crime exposure. Including measures of institutional trust as covariates does not meaningfully change the coefficients on our predictors of interest. This suggests that, at least in this context, institutional trust is not a substantial pathway whereby exposure to crime affects participation. Instead, we find that victims who trust institutions less appear to be more electorally demobilized and less non-electorally mobilized than victims who trust institutions more. In short, rather than mediating the relationship between exposure and participation, trust appears to moderate this relationship.
At first glance, these patterns may appear to offer an explanation for our countervailing findings showing that victimization is associated with a decrease in turnout but increase in non-electoral participation: when low-trust individuals are victimized, they may withdraw from state-run elections and instead pursue less institutionally constrained forms of participation like protesting. However, we find limited support for a pure substitution mechanism: as we show in Tables SM.A32-SM.A35 in the Supplementary Material, victimization is not only associated with increased participation in activities like protesting, but also in “institution-facing” activities like donating to campaigns and contacting elected officials. Thus, the divergent relationships between victimization and the two types of participation we consider may be better explained by theories of post-traumatic growth, which posit that some victims experience positive psychological change and a renewed sense of agency (Tedeschi and Calhoun Reference Tedeschi and Calhoun1996; Reference Tedeschi, Calhoun, Alex Linley and Joseph2004) or that political activism can help victims make sense of their experience by reframing their private loss as a public problem, pursuing prevention and accountability, and honoring loved ones (Bateson Reference Bateson2025). From this perspective, non-electoral activities—including more “conventional” acts like contacting elected officials or attending a community meeting—may be attractive because they are experienced as social, sustained, and instrumentally purposeful, rather than as one-off, low-feedback actions like voting.
The notion that trust conditions the relationship between exposure to crime and participation may also help reconcile discrepancies between our findings and Sønderskov et al. (Reference Sønderskov, Dinesen, Finkel and Hansen2022), who—using validated individual-level panel data in Denmark—find that violent victimization mobilizes voters. On average, Denmark displays higher institutional trust than the United States, and OECD indicators place the United States far below the OECD average for confidence in the national government (OECD 2024a; 2024b). If crime victimization has differential effects on participation depending on individuals’ pre-existing trust, then aggregate effects are likely to vary across countries as a function of baseline trust. That said, our findings are broadly consistent with studies conducted in low-trust settings linking victimization to non-electoral engagement and violent contexts to lower turnout (e.g., Bateson Reference Bateson2012; Trelles and Carreras Reference Trelles and Carreras2012), as well as with recent working papers on policing and surveillance in the United States, which find that localized policing mobilizes turnout (Naftel Reference Naftel2024; Romero Reference Romero2024). While scholars advance different mechanisms to explain these patterns, our findings suggest that, to the extent that policing reduces crime—and thus, the number of people who are victimized—we should expect turnout to increase absent other indirect effects (Romero Reference Romero2024).
This study is not without limitations. Our measures of nonvoting political behavior may be contaminated by self-reporting biases, though this concern is partly mitigated by the strong correspondence between results using self-reported and validated turnout, as well as by the expectation that social desirability is more acute for voting than for contacting officials or attending protests. While we take several steps to address omitted variable bias concerns by preregistering our analysis to limit researcher degrees of freedom (Simmons, Nelson, and Simonsohn Reference Simmons, Nelson and Simonsohn2011), including a rich set of controls, providing analysis leveraging ZCTA fixed effects, and analyzing (albeit limited) panel data, reliance on observational data limits our ability to make strong causal inferences. Our crime-rate measures, while carefully constructed and standardized, rely on public reporting systems that vary in coverage and classification (Rice and Ellison Reference Rice and Ellison2025). And although ZCTAs are far more granular than cities or counties, some remain sizable (median ZCTA area for CES respondents = 3.6 square miles), meaning crime rates may obscure hyper-local variation. Finally, as noted above, our analysis focuses on individuals living in major U.S. cities and may not generalize to other contexts.
Future research can build on these findings in several directions. First, although we report exploratory analyses that suggest political trust may moderate the relationship between crime exposure and participation, this evidence is limited and preliminary. Scholars should pursue more suitable data sources and research designs to more convincingly examine potential psychological and attitudinal pathways linking victimization to distinct participatory outcomes and conditioning those relationships. Although it appears that trust plays a role, personal efficacy, personality traits, and other individual and contextual factors may also be at play. Second, future studies should further explore heterogeneity in responses to crime across racial, ethnic, and socioeconomic groups, especially given persistent inequalities in both crime exposure and political voice. Finally, attention to institutional context—such as policing regimes, access to participatory networks, or electoral competitiveness—may help explain when victimization triggers engagement rather than withdrawal.
SUPPLEMENTARY MATERIAL
To view supplementary material for this article, please visit https://doi.org/10.1017/S0003055426102007.
DATA AVAILABILITY STATEMENT
Research documentation and data that support the findings of this study are openly available at the American Political Science Review Dataverse: https://doi.org/10.7910/DVN/53YI22.
CONFLICT OF INTEREST
The authors declare no ethical issues or conflicts of interest in this research.
ETHICAL STANDARDS
The authors declare that the human subjects research in this article was reviewed and approved by Loyola University Chicago’s Institutional Review Board (Project No. 3115). The authors affirm that this research note adheres to the principles concerning research with human participants laid out in APSA’s Principles and Guidance on Human Subject Research (2020).















 Open access


Comments
No Comments have been published for this article.