In November 2013, a new round of state-owned enterprise (SOE) reform was announced at the third plenum of the Chinese Communist Party (CCP). The reform agenda appears ambitious and comprehensive, ranging from ownership to various corporate governance issues. Most commentators’ attention has so far been focused on the so-called “mixed ownership economy,” arguably a new phrase for partial privatization. Reconfiguration of ownership structure has been a major therapy for problematic SOEs. Since the 1990s, many SOEs have been partially privatized through listing a minority of their shares on domestic or international stock exchanges to attract private investors. The proclaimed purpose of such partial privatization was to improve the management efficiency of SOEs by subjecting them to capital market pressures. Existing literature, however, provides inconclusive evidence on whether this form of partial privatization has produced substantive change in SOE governance.Footnote 1
A much less discussed reform policy is that regarding executive personnel management. The Chinese government has explicitly included the “professionalization” of the SOE managerial leadership in the recent reform agenda. It seems that this reform policy will fix the crux of the SOE governance problem. As Richard McGregor notes, “[t]he Party's control over personnel was at the heart of its ability to overhaul state companies, without losing leverage over them at the same time.”Footnote 2
While it is well-recognized that the CCP's personnel control plays a critical role in SOE governance, there remains very limited research on the SOE managerial elite. A number of leading sociologists have recently called for a systematic investigation of the business elite in China. For instance, as Andrew Walder critically points out, scholars have little understanding about the managerial elite who control China's largest companies.Footnote 3 What are their backgrounds? How have they come to power? How cohesive are the elite? How are they connected with the government and the CCP? How are they connected internationally through formal organizations or other ties? Neil Fligstein and Jianjun Zhang specifically urge an investigation of top-level managerial careers to reveal both the “conception of control” in Chinese companies and how China fits in the taxonomy of comparative capitalism.Footnote 4
Among the very few extant studies on the Chinese SOE elite, my recent work provides an in-depth investigation of chief executive officers (CEOs) in China's large non-financial non-listed SOEs between 2000 and 2010.Footnote 5 Extending my previous work, this article compares executive characteristics of China's listed and non-listed industrial SOEs to evaluate whether domestic and international capital markets play any role in influencing the CEO recruitment results. More importantly, as the survival of Chinese industrial SOEs heavily relies on the support of the state-owned banks, this article examines the CEOs of China's state-owned banks and compares them with industrial CEOs. The comparison shows weak integration between the industrial and financial SOEs through personnel connections and quite different career patterns between the industrial and bank CEOs. It provides a refined and comprehensive understanding of the human resource management in China's state-owned sector. Methodologically, this article innovatively uses Sankey diagrams to illustrate the executives’ career flow patterns.
This article is organized as follows. It starts with a brief analysis of the SOE executive personnel reform rules to identify the desirable executive attributes proclaimed by the state owner. It then further systematically investigates the biographic backgrounds and in particular career pathways of the CEOs of three types of SOEs: the non-financial SOEs under the control of the State-owned Assets Supervision and Administration Commission (SASAC), the largest 100 listed non-financial SOEs, and the largest 50 state-controlled banks as of the end of 2013. The focus on CEOs considers the fact that many large Chinese SOEs have not yet established boards of directors and the management power remains concentrated in the top manager of the corporate entity. The anatomy of the SOE managerial elite provides a timely evaluation of the recent SOE reform policy and a richer understanding of China's state-owned sector through a comparative capitalism lens.
The Professionalization Scheme
Professionalization of the SOE executive personnel in fact is not a new policy. Detailed regulatory rules have been in place for years. Over the past decade, the Chinese regulators overseeing the large financial and non-financial SOEs have promulgated numerous rules seeking to improve the leadership quality. This section provides a brief overview of these executive personnel rules for China's industrial SOEs and state-owned banks. The formal rules provide some guidance on the attributes that the Chinese state owner (or ultimately the CCP) is looking for when selecting top managers.
Non-financial SOEs
A large non-financial SOE in China is typically organized as a corporate group with a hierarchical ownership structure. In each group, a holding company controls a large number of subsidiaries.Footnote 6 The holding company itself is a non-publicly traded company and comes under the direct control of the central or local government's ownership agency, SASAC, which was established in 2003. At present, 106 SOEs come under the supervision of the central SASAC. The mission of SASAC is to consolidate the shareholder control rights which were formerly split among various Party and government organs. In reality, SASAC's mission faces an uphill battle as the old power structure is recalcitrant to change. The CCP's Organization Department, often dubbed “the world's largest human resource department,” still controls the executive appointments of the largest SOEs in China. In the 53 central enterprises, the occupants of top positions, including board chairmen, CEOs, and Party secretaries, are appointed and evaluated by the Organization Department.Footnote 7 Appointments and evaluations of vice-executives in these companies and top managers in the remaining central enterprises are made by SASAC.Footnote 8 Therefore, the executive reform rules and personnel decisions are always jointly announced by SASAC and the Organization Department. SASAC also has the power to approve executive nominations of important SOE subsidiaries such as listed firms.
Many rules and guidelines seeking to professionalize the SOE executive personnel have been introduced by SASAC and the Organization Department since 2003.Footnote 9 According to the rules, executives shall have a minimum of a bachelor's degree, which is not a demanding requirement given the popularity of college education in China. This educational requirement also reflects the CCP's long-enduring penchant for college students.Footnote 10 The recruitment rules further require at least ten years of work experience within business organizations, which suggests business experience is more important than political experience. Still, SASAC's recruitment rules shamelessly state that political loyalty to the CCP is a primary requirement.
Another feature of the professionalization scheme is the opening up of the SOE executive labour market. In the past, the SOE executive recruitment process was highly secretive. People outside the system had no access to job information, let alone any chance of appointment. The closed system suggests a great likelihood that old practices are perpetuated and new management skills in short supply. In recognition of these potential problems, SASAC has publicly solicited job applications for hundreds of executive positions, including CEOs, vice-CEOs and chief accountants (equivalent to CFOs), within the holding companies under its supervision. According to the rules, successful job applicants have to pass a series of exams and interviews. The recruitment rules explicitly allow for a relaxation of the political, educational and work experience requirements discussed above for executives recruited through this process. This executive recruitment process invites not only domestic professional managers but also overseas talent. The Chinese government has celebrated this public recruitment process for its “openness, fairness, competitiveness, and meritocracy.”
State-controlled banks
Banks are the central institutions in China's financial system, and the People's Bank of China (PBOC) is the central bank.Footnote 11 The China Banking Regulatory Commission (CBRC) is a major regulator overseeing the banking industry. China's banking industry is dominated by five large state-controlled banks: Bank of China, China Construction Bank, Agricultural Bank of China, Industrial and Commercial Bank of China, and Bank of Communications. The Bank of Communications is directly controlled by the Ministry of Finance while the other four banks are controlled by Central Huijin Investment Inc., which is wholly owned by the Ministry of Finance through the China Investment Corporation. In addition to the big five banks, there are a dozen second-tier commercial banks (three of which are non-state controlled) and hundreds of city/rural commercial banks in the third tier. The city/rural commercial banks are often controlled by local government. Besides the commercial banks, there are three policy banks responsible for financing national economic development projects. All three policy banks are directly and wholly owned by the central government. The CCP's Central Organization Department appoints the top management positions of the largest five commercial banks and the three policy banks.Footnote 12
In 2000, the PBOC promulgated rules regarding the required qualifications for directors and executives of financial institutions.Footnote 13 The rules state that top managers in commercial banks must hold at least a bachelor's degree and have at least eight years of work experience in the financial industry or 12 years of work experience in business (of which five years must be in finance). Also, financial executives must be capable of correctly implementing the nation's economic and financial policies. In March 2012, the General Office of the CCP's Central Committee and the Central Organization Department announced rules regarding the appointment and evaluation of the top managers of the 18 financial institutions supervised by the central government.Footnote 14 These rules stipulate the institutionalization of CCP organs (i.e. Party committees) in these financial institutions and require cross appointments between the Party committee and the board of the directors. More recently, in November 2013, the CBRC released the latest regulations on necessary qualifications. Executives shall possess relevant financial knowledge and experience as well as have a good record of compliance with laws and regulations.Footnote 15 In addition, the recruitment of executives to state-controlled banks is subject to the CCP's controls and personnel management rules, which, among other things, demand political loyalty to the CCP and a minimum of a college degree, and favour relatively young leaders.Footnote 16
An Empirical Investigation
The formal recruitment and appointment rules shed some light on the educational, political and career attributes that the CCP is looking for when selecting the top managers for SOEs. But, in China, formal rules do not necessarily mean actual implementation. It requires empirical evidence to verify that the formal rules are actually followed. Furthermore, the formal recruitment rules, as discussed above, require SOE executives to have relevant work experience. Where do the executives gain this work experience? Does the system value firm-specific knowledge over general skills across business and political spheres? To what extent do SOE executives accumulate experience across the financial and non-financial sectors?
Data and methodologies
This article analyses the biographical information of the CEOs from three kinds of SOEs in China: the 113 non-financial SOEs controlled by the central SASAC, the largest 100 state-controlled non-financial listed companies, and the largest 50 state-controlled banks, as of the end of 2013. One prominent characteristic of China's state-owned sector is the central role held by the large non-financial SOEs controlled by the central SASAC in critical industries such as steel, telecommunications, and transportation. They are often regarded as China's national champions. These central SOEs are holding companies tightly controlled by the state and there is little transparency with regard to their governance practices. In order to evaluate how exposure to the stock market would affect the CEO appointments in SOEs, this article also investigates the largest 100 state-controlled non-financial listed companies according to the Fortune China 500 list.Footnote 17 Another key feature of China's state capitalism is that most banks are controlled by the central or local government and provide cheap financial resources to industrial SOEs. Thus, this article investigates the CEOs of the largest 50 state-controlled banks according to China's Top 500 Companies in Finance, published annually by Net Ease Finance (a Chinese news company) since 2011.Footnote 18
The biographical data of CEOs used in this article were manually gathered from multiple sources including corporate securities prospectuses and annual reports, corporate websites, government publications and websites, industrial association websites, and several biography databases (Baidu Baike, Hexun Renwu, and China Vitae). Using multiple sources ensures the completeness and accuracy of the information. The main attributes are as follows: (1) educational attributes – alumni of Tsinghua University (China's best university in engineering), alumni of the C9 League (China's equivalent of the Ivy League), engineering/natural science degree, MBA/EMBA degree, graduate degree, foreign degree; (2) political attributes – CCP membership, age when joining CCP, membership of the National Congress, Consultative Assembly or CCP Congress; and (3) career attributes – age when appointed CEO, tenure, pre-CEO career patterns and post-CEO status.
A career pattern is constructed as a directed sequence composed of movements across organizations. This article uses organizations of various kinds as the basic units to build career sequences and then categorizes the sequences according to the prevailing organizational structures and relevant institutional environments. Because the industrial SOEs and state-controlled banks have different organizational structures, the basic organizational units also differ.
For industrial SOEs, the basic organization units include: the company in question (coded as “com”), an affiliate within the same corporate group (coded as “aff”), an unaffiliated SOE (coded as “soe”), other government units (coded as “gov”), and a private company (coded as “prv”). All the sequences always end with “com.” For example, Guo Wenqing 国文清 spent his early career years in several government units, including working as a county government secretary, a deputy town mayor, a secretary of Chengde city government, a secretary of the CCP committee office of Hebei province, a deputy head of the highway bureau and then a head of the harbour and shipping administration bureau of Hebei province. He then worked as an executive for eight years in an unaffiliated listed SOE prior to his CEO appointment to China Metallurgical Group Corporation in 2012. His career pathway is coded as <gov/gov/gov/gov/gov/gov/soe/com>. This coding method produces 213 career sequences for the industrial SOE CEOs, with 36 distinctive types of sequences. The maximum sequence length is eight (i.e. job movements across eight different organizations) and the minimum is one. The mean of the sequence length is 2.5 and the mode is 2 (n = 110).
The career pathways of the CEOs of the state-controlled banks require a different coding strategy because the state-controlled banks are not structured as corporate groups and have different regulatory backgrounds. The organizations are categorized into several types based on the nature and status of the organization, including: financial regulatory institution (coded as “A”), first-tier bank (“B”), second-tier bank (“C”), third-tier bank (“D”), industrial SOE (“E”), other financial institute (“F”), government bureau/unit (“G”), foreign bank (“H”), and academic institute (“I”). Each CEO has his/her own organizational sequence. For instance, a career sequence from the People's Bank of China (financial regulatory institution) to Industrial and Commercial Bank of China (first-tier bank) then to the Bank of Nanjing (third-tier bank) is coded as <ABD>. In this dataset, excluding missing data, there are 44 career sequences, including 29 unique types of sequences. The maximum length of the sequence is seven (i.e. job movements across seven different organizations) and the minimum is one. The mean of the sequence length is three and the mode is two (n = 21).
Results and Discussion
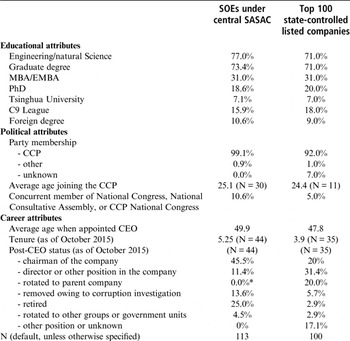
Table 1 reports the executive backgrounds of the 113 SOEs under central SASAC's supervision and the top 100 state-controlled non-financial listed companies. Many of the listed companies are major subsidiaries of the holding companies controlled by the central SASAC. As shown in Table 1, there are great similarities in the educational and political attributes of the CEOs of these two kinds of SOEs. More than 70 per cent of the CEOs hold a bachelor's degree in engineering or natural science. The dominance of engineering-trained CEOs is probably an outcome of China's industrial structure and political history. Most of the SOEs are either in extractive, infrastructure or manufacturing industries, which require a high degree of technological capacity. Moreover, this could also be a legacy of the Cultural Revolution, as engineering was, politically, a safer field of study than most during that period.
Attributes of CEOs of Large Industrial SOEs in China (as of December 2013)

Source: Data collected by author.
Notes: Because the SOEs under SASAC are parent companies themselves in a group, there is no observation in this category.
Over 70 per cent of the CEOs hold a graduate degree, and over 30 per cent hold an MBA or EMBA degree. The most popular MBA/EMBA programmes among the executives are offered by the China Europe International Business School, Tsinghua University School of Economics and Management, and Peking University Guanghua School of Management. These three schools are often ranked among the best business schools in China. Around 20 per cent of the CEOs hold a PhD degree. Given the commonness of holding a master's degree, having a doctorate degree may provide a competitive edge.
As to the elite university education, about 7 per cent of the CEOs are alumni of Tsinghua University, China's leading university in the field of engineering and natural science. More than 15 per cent of the CEOs graduated from the C9 League, universities typically with a strength in engineering. Nevertheless, it should be noted that the CEOs’ association with these elite schools is largely unrelated to the field of engineering or natural science. Among the 15 Tsinghua alumni, only five were engineering students while the rest were associated through the MBA/EMBA programmes. Similarly, only 12 of the 36 C9 League alumni are engineering graduates while the rest are mostly MBA/EMBA graduates. In other words, while over 70 per cent of the CEOs hold a bachelor's degree in engineering or natural science, only a minority of them obtained their degrees from elite engineering/natural science universities. Attending an elite undergraduate institute seems unimportant for their career attainment.
More than 10 per cent of the central SOE CEOs and 9 per cent of the listed SOE CEOs have a foreign degree. While many of the listed SOEs are listed overseas and are thus more exposed to international management practices, the results here do not show that they are more likely to have foreign-educated CEOs. Of the 21 foreign-educated CEOs, 13 obtained their degrees (often MBA degrees) in the United States. It remains to be seen how the dissemination of US business management education may influence the governance of China's SOEs.
Overall, the educational attainment data seem to suggest China's industrial SOEs are governed by a body of highly educated professionals. However, this professionalism through academic excellence should be treated with great caution. The MBA/EMBA programmes in China, especially those offered by elite universities, have been criticized for being a hotbed of collusion and corruption among officials (including SOE managers) and private businessmen. These programmes have recently been targeted by the anti-corruption campaign. The advantage these MBA/EMBA programmes really offer is more about social networking than knowledge improvement. Furthermore, many of the CEOs gained their doctorate degrees through part-time programmes while performing their duties as busy corporate executives. Some of them completed their degree just a few years prior to being appointed CEO. It raises a red flag about the credibility of the degrees, especially considering the rampant use of fake academic credentials in China.Footnote 19
With regards to political membership, the data show that virtually all of the CEOs are CCP members. There are two executives affiliated to the China National Democratic Construction Association, a CCP-allied party. The marginal representation of non-CCP members is of symbolic importance and does not signal any real political diversity in the SOE system. The CCP-affiliated executives joined the Party at quite an early age, around 24–25 years old. An early pledge of political loyalty may be beneficial to career development in the state system because it signals political commitment and also allows an extended period of scrutiny and training, which thus enhances promotion chances.Footnote 20
It is an institutionalized practice of the Chinese government to appoint top managers as members of the three national political bodies, the National People's Congress, the National People's Political Consultative Conference and the National Congress of the CCP. Membership of such political bodies bestows social or political status rather than any substantive law-making power. The data show that 10.6 per cent of the central SOE CEOs and 5 per cent of the listed CEOs are concurrently members of these political bodies. The central SOEs have more political affiliations than the listed companies. This is because the central SOEs are economically and politically more important than the listed firms, which are usually the central SOEs’ subsidiaries. Overall, the data on political attributes confirm that political loyalty to the CCP remains a paramount requirement.
Turning to the career attributes, the data show that the CEOs of central SOEs were a couple of years older at the time of their appointment than the CEOs of listed SOEs. This may be owing to the central SOEs having a higher position in the organizational hierarchy, meaning that it would take longer to reach the executive positions. The CEOs of listed SOEs had a shorter tenure than those of central SOEs, which might be because they were also subject to performance scrutiny by capital markets.
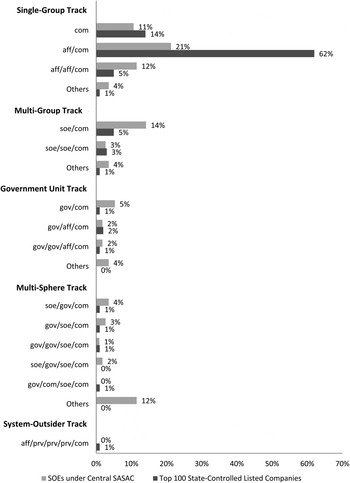
The details of career patterns are shown in Figure 1. To reduce the patterns into a manageable number, the career sequences are grouped into five types based on the prevailing organization structures of the SOEs. Figure 1 shows that the most common career pattern both for the central SOE CEOs (47 per cent) and the listed SOE CEOs (82 per cent) is the single-group track in which the CEO developed his/her career entirely within one business group. However, a closer look reveals that most of the CEOs did not build their careers entirely within the parent company. In particular, 21 per cent of the central SOE CEOs and 62 per cent of the listed SOE CEOs started their careers in a subsidiary (denoted as “aff”) and then received promotions into the parent holding company (denoted as “com”) of the corporate group. The prevalence of the single-group path in which the CEO moves from one subsidiary to another or to the parent company may be a result of the hierarchical ownership structure and “the one-level down” management principle in China's state-owned business group.Footnote 21
Career Patterns of Central and Listed Industrial SOEs (December 2013)

The fact that the single-group track is the major career pattern contradicts the common anecdotal belief that the CEOs are typically transferred from government bureaus. The prevalence of single-group track CEOs implies that the SOE management system values group-specific knowledge and gives group insiders promotional advantages. On the one hand, the single-group track assures some professionalism in the SOE management owing to the CEO's possession of rich, firm-specific knowledge. On the other hand, it may increase the risk of an undue concentration of power, particularly given that corporate governance-monitoring mechanisms such as the board of directors are dysfunctional in China's SOEs. As SOEs have become more formidable in size and like “small kingdoms,” internally promoted executives may have leverage over the government partly because they possess a considerable amount of valuable business information on which government bureaus, often understaffed, need to rely in order to formulate plans and regulations.Footnote 22
The second most common career pattern is the multi-group track, which has been followed by 20 per cent of the central SOE CEOs and 9 per cent of the listed SOE CEOs. These CEOs have work experience in the SOEs of other corporate groups, typically rival companies in the same industry. This pattern suggests that there are quite frequent personnel rotations across state-owned corporate groups in the same industry. Such personnel rotations may facilitate management knowledge sharing among the SOEs and also function as a monitoring mechanism where the board of directors is absent or dysfunctional. The single-group and the multi-group tracks together account for 67 per cent of the central SOE pathways and a whopping 91 per cent of the listed SOE pathways. Thus, the great majority of CEOs reach their executive posts through the accumulation of work experience within the SOE system rather than zigzagging between the political and business spheres.
Figure 1 further shows that, unlike the CEOs of the listed SOEs, where the vast majority follow the single-group track, the CEOs of the central SOEs directly under the control of SASAC have more diverse work experience across organizations within the state system. This pattern may be attributable to that fact that the central SOEs have a higher status in the state's administrative system, and therefore their CEOs tend to have more splendid employment histories. About 12 per cent of CEOs in the central SOEs had spent part of their careers in government bureaus (i.e. the government unit track) and about 20 per cent of them had developed their careers through the multi-sphere track. Both tracks involve some career development in government units, often ministries or bureaus that supervise a given SOE's industrial matters. While these two career tracks may not be as common as usually expected, the degree of career integration across the business and political spheres is still quite significant. On the one hand, these tracks may be detrimental to the corporate governance quality of SOEs; on the other hand, they may create greater elite cohesion among Chinese political and business leaders through shared career experiences, which can facilitate national policy coordination and implementation.
Note that only one CEO in the dataset has work experience outside the state system; this career pattern is labelled as the system-outsider track. After graduating from college, Wu Gang 伍刚 worked at China Automobile Trading Company (a subsidiary of the China National Machinery Industry Corporation (CNMIC)) for just under three years. He then worked as a senior consultant at Roland Burger Strategy Consultants (a global consulting firm headquartered in Germany), the chief investment officer of Dapeng Venture Capital (a privately owned private equity company in China), a vice-CEO of the greater China region of Watson Wyatt Worldwide (a global consulting firm headquartered in the United States), and then became the CEO of Sinomach, a listed subsidiary of CNMIC (an SOE under central SASAC).
This single case has some implications. First, the virtual absence of the system-outsider track for listed SOEs suggests that corporate elite recruitment remains closed to outsiders even though the listed SOEs are exposed to domestic and international capital markets. Second, this case occurs in the automobile industry in which competition is intense and which thus may be under more pressure to bring in system outsiders for innovation reasons. Third, the CEO is not a complete stranger to the SOE system. His early work experience in a state-owned affiliated company might have played an important role in reconnecting him with the SOE system. And, finally, Mr Wu has an outstanding career history and educational background. He has a well-established career in the private sector and he is one of the very few CEOs in the dataset who holds both an engineering degree and an MBA degree from the elite Tsinghua University; he also holds a PhD degree in economics. System-outsider executives may be regarded as institutional brokers importing new management knowledge into the SOEs. System outsiders may use their brokerage advantages to secure executive posts in the SOE system. Meanwhile, they have the “liability of foreignness,” namely, a foreigner's competitive disadvantages in a local system. Since China's SOEs maintain a strict hierarchical system in employee administration, any external hiring would disrupt internal promotion expectations and raise legitimacy concerns. Therefore, system outsiders need to have spectacular records in order to justify their parachuting into the elite posts coveted by insiders.
As of October 2015, 44 CEOs of the SOEs under the central SASAC, and 35 CEOs of the top state-controlled listed companies, had already left their executive positions, as shown in Table 1. The most common post-CEO career path is to continue working in the same business group, either as chairman, director or in another similar role in the company, or as an executive of the parent company. Retirement owing to age is another common departure reason for CEOs under SASAC. Note that 13.6 per cent of the central SOE CEOs and 5.7 per cent of the listed CEOs were removed from their posts owing to corruption scandals. Also, only a small number of CEOs transferred to another business group or to a government unit.
Overall, despite the multiple rounds of organizational restructures and ownership reforms including public listing since the 1990s, the current executive career patterns of the industrial SOEs still reflect the vertical functional hierarchies in China's bureaucracy, typically called xitong 系統, literally meaning “systems.”Footnote 23 The CEOs of the industrial SOEs develop their careers either within a single business group, across multiple groups often in the same industry, or in a supervisory bureau related to the group's industrial business. Furthermore, only one of the 213 industrial CEOs has a career track across the vertical functional divide between finance and industry.Footnote 24 The SOE executive personnel management still seems governed by the xitong concept.
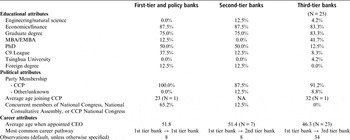
With reference to the bank CEOs, Table 2 reports the attributes of CEOs of the state-controlled banks including eight first-tier banks (including three policy banks), eight second-tier banks and 34 third-tier banks. In terms of education, most of the bank CEOs have an undergraduate degree in economics or finance rather than engineering or natural science. A majority of the bank CEOs at all tiers have a graduate degree. MBA/EMBA degrees are popular with third-tier bank CEOs (41.7 per cent) while PhD degrees are much more common for first-tier and second-tier bank CEOs (50 per cent). First-tier bank CEOs (37.5 per cent) are more likely to be alumni of the C9 League, compared to second-tier bank CEOs (12.5 per cent) and third-tier bank CEOs (8.3 per cent). Also, first-tier and second-tier bank CEOs (12.5 per cent) are more likely to have overseas study experience than third-tier bank CEOs, which suggests foreign education may be more important for larger and higher-status banks as they have more international business. Overall, the higher-status banks have CEOs with better educational backgrounds.
Attributes of CEOs of State-controlled Banks (2013)

Source: Data collected by author.
In terms of political backgrounds, the large majority of bank CEOs are CCP members. Moreover, the top-tier CEOs are significantly more likely than lower-tier CEOs to be concurrent members of the major national political assemblies, which is explainable as candidacy in these national representative bodies is linked to social, political and economic status.
As to career attributes, Table 2 shows that the executives of the higher-tier banks tend to be older when they assume their positions, possibly because it takes more time to reach the higher-status positions. The most common career pattern for first-tier bank CEOs is to move jobs between first-tier banks, while the most common career pattern for second-tier and third-tier bank CEOs is to change positions from within a first-tier bank to the respective tier.
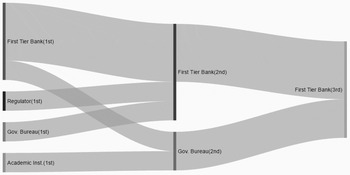
To provide a better illustration of the career patterns of bank CEOs, this article uses Sankey diagrams to show the CEOs’ career-flow patterns for each tier of the banks. Sankey diagrams are a specific type of flow chart, in which the width of the flows is shown proportionally to the flow quantity. The flows begin from the left bars and then move rightwards. Figure 2 shows the career-flow patterns of the CEOs of the first-tier banks. Three of the eight CEOs started their careers at a first-tier bank (1st), then moved to another first-tier bank (2nd) and finally became the CEO of a first-tier bank (3rd), where they are currently employed. One CEO started his career with the regulator (the People's Bank of China) and one started in a provincial government policy research office, but both later moved to a first-tier bank where they became the bank's CEO. Finally, one of the CEOs began his career in a first-tier bank and another started in an academic institution; both then transitioned to a provincial government position and then became the CEO of a first-tier bank. None of the first-tier bank CEOs had work experience in any second-tier or third-tier banks.
First-tier Bank CEOs’ Career Flows (2013)

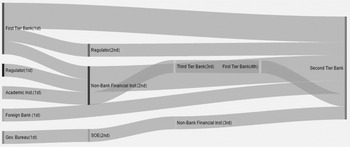
Next, Figure 3 shows the career flows of the second-tier CEOs. Four of the eight CEOs began their careers in a first-tier bank, one in a regulatory agency, one in an academic institute, one in a foreign bank and one in a government bureau. Four of the eight CEOs had some work experience in one or more non-bank financial institutions (for example, securities firms, investment or trust corporations). The CEO with experience of working in a foreign bank was Li Mingxian 利明献. He worked at Citi Bank (Taiwan) for more than 20 years before his CEO appointment at China Guangfa Bank (CGB). Citi Bank is one of CGB's major shareholders (along with the State Grid Corporation and China Life Insurance Company, both of which are state-controlled). Moreover, Citi Bank, with the Guangdong government's support, acquired management powers through contracts in 2006. This institutional relationship helped this outsider to acquire the top management post in a state-controlled bank.
Second-tier Bank CEOs’ Career Flows (2013)

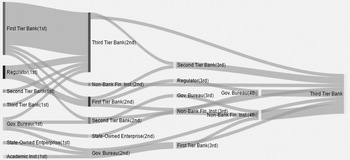
Figure 4 shows the CEO career flows of the third-tier banks. The diagram includes 28 career pathways. The most popular career pattern is to move from a post in a first-tier bank to a post in a third-tier bank, which accounts for 42.9 per cent (12 out of 28). The diagram also shows that 15 CEOs started their careers in a first-tier bank; 12 of them then directly, or indirectly via a second/third-tier bank, transitioned to the third-tier bank where they were appointed CEO; and the remaining three CEOs changed jobs across multiple types of organizations before landing in the CEO post of a third-tier bank. Figure 4 also shows that four CEOs began their careers in a regulatory agency (the PBOC), one in a second-tier bank, one in a third-tier bank, four in a government bureau, one in an industrial SOE and one in an academic institution. These 12 CEOs then moved across various sorts of organizations before becoming the CEO of a third-tier bank.
Third-tier Bank CEOs’ Career Flows (2013)

When Figures 2, 3 and 4 are read together, it reveals that there are few career connections across the major banks and industrial SOEs. None of the top-tier bank CEOs had any work experience in any industrial SOE; and only one of the second-tier CEOs and two of the third-tier CEOs worked for an industrial SOE at some point in their careers. The career network seems to play a marginal role in facilitating resource exchanges across the major banks and the industrial SOEs in China.
The figures also show that most of the career flows are between the institutions in the banking industry. In particular, the first-tier banks have a significant presence in these career diagrams. Of the bank CEOs, 72.7 per cent (32 of 44) had work experience in at least one first-tier bank. Industrial and Commercial Bank of China (ICBC) is the organization in which most CEOs spent some time: 12 CEOs worked at ICBC at some point. China Construction Bank (CCB) is also a popular one, with ten CEOs having gained work experience there. These banks may act as training and knowledge-dissemination hubs in the industry. While the great majority of the career pathways are job movements among institutions related to the financial industry, which to some extent may support financial professionalism, 13 of the total 44 career pathways of CEOs from all tiers cross at least one government unit. The most common government unit is the general office or policy office of a municipal government.
When focusing on the relations among the banks alone, there appears to be a hierarchically descending pattern in the bank elite's inter-firm job movements, that is, movement from a higher-status organization to a lower-status organization in the banking industry. As discussed above, the most common career pattern for the CEOs of first-tier banks is a sequence of job movements from one first-tier bank to another. The executive career pathways of CEOs in the top-tier banks present a lateral-training pattern rather than a pattern descending down the hierarchy of the banking industry. But, the hierarchically descending pattern clearly exists for the CEOs of the second-tier and third-tier banks. The most common career pattern for second-tier bank CEOs is from a first-tier to a second-tier bank. The popular pattern for the third-tier bank CEOs is to move from a first-tier to a third-tier bank. The hierarchically descending career pattern suggests that the elite training system of the banking industry values the management knowledge of higher-status organizations, and such knowledge diffuses from the higher to the lower organizations. It is a hierarchical learning and training network.
The career patterns of the bank CEOs demonstrate similarities with, but also differences from, the patterns of the industrial CEOs. Like industrial SOEs, the state-controlled banks have virtually no outsider CEOs. Only one bank (the China Guangfa Bank) and one industrial SOE (Sinomach) have a CEO with work experience outside the state system. Both these system-outsider CEOs secured the top corporate executive positions through their previous employers’ shareholding connections to the state system. Meanwhile, the bank CEOs demonstrate different career patterns from those of the industrial SOE CEOs. Unlike industrial SOE CEOs, who generally climb the corporate ladder within a single business group, a majority of the bank CEO career pathways show a hierarchically descending pattern across multiple banks within the banking industry. The management of the industrial SOEs seems to stress good possession of group-specific knowledge while the management of the banks seems to place more value on industry-wide knowhow. The prevalence of inter-bank career movements in the banking industry may be partly because financial knowledge tends to be more generalizable across organizations than industrial production knowledge. This career network may also facilitate isomorphism in the banking practices in China.
Conclusion
This article has tried to explore what “managerial professionalization” actually means for the Chinese government's SOE reform agenda by examining the relevant formal rules and backgrounds of top CEOs. The SOE managerial elite demonstrate a high degree of cohesion in terms of their educational training and political affiliation. Virtually none of the CEOs has any work experience outside the state system, despite partial privatization through public listing in domestic and international capital markets, the mass-scale internationalization through the “going-out” policy since the late 1990s, and the executive recruitment reform over the past decade. It is a system which favours insiders over outsiders, showing a high degree of closure. Moreover, this article shows that the executives of financial and non-financial SOEs present different prevailing career pathways. The most common career pathway for industrial CEOs is to climb the corporate ladder within a single corporate group, as they typically begin their careers in a subsidiary and then move to the parent company in the corporate group. Unlike the industrial CEOs, the bank CEOs follow a career trajectory that demonstrates job transitions from a higher-status organization to a lower-status organization within the banking industry. The executive personnel system in China's state-owned sector suggests a politically bounded management approach: value is placed on a high degree of firm- or industry-specific management knowledge that is developed within permissible political boundaries.
Shifting the focus from structure to people in China's state-owned sector advances several important research inquiries into China's SOE reform. First, the anatomy of the SOE elite raises questions about the corporate governance reform of China's SOEs. Ownership restructure has been, and continues to be, the major component in the SOE reform package. An immediate question is whether ownership restructuring through mixed ownership or partial privatization will change the composition and management of the SOE leadership. This is a particularly important question as recent empirical evidence has suggested that the party-state's idiosyncratic control over executive personnel is the crux of the SOE governance problem.Footnote 25 As shown in this article, detailed regulations for professionalization and marketization of the SOE executive personnel system have been in place for well over a decade, and partial privatization through listing shares in domestic and international capital markets since the 1990s has wrought little change in the executive recruitment results. The implementation results to date should cast doubts on any substantive change in the executive recruitment practices as promised in the very recent reform agenda.
Second, the divergent executive career patterns in the industrial and bank SOEs provide a richer understanding of the relationship between the industrial and banking sectors in China. China's financial system relies heavily on loan financing provided by banks. Resource dependence theory in business literature suggests that such financial reliance creates incentives for companies to build ownership or personnel ties with banks as a means to manage resource dependence and reduce uncertainties.Footnote 26 Thus, it is expected that bank CEOs often play a central role in the corporate elite network. The findings on executive career paths in this article and interlocking directorship in existing literature both show that China's industrial SOEs have little reason to recruit top managers from the financial industry.Footnote 27 Furthermore, there is very limited cross-shareholding between banks and industrial SOEs in China.Footnote 28 Therefore, unlike industrial firms operating in other major capitalist systems such as that in Japan, China's industrial SOEs do not build direct ownership or personnel ties to the major banks to secure financial resources.
Despite the lack of direct ownership and personnel connections, the industrial SOEs enjoy endless flows of money from the major banks in China. Rather than relying on lateral shareholding or personnel exchanges, the coordination mechanism between the industrial and the financial giants is probably through vertical relations that ultimately tie the financial and non-financial SOEs together to a common entity: the central or local state owner. At the national level, the central industrial groups are supervised by the central SASAC and the large banks are controlled by the Ministry of Finance, and both the central SASAC and the Ministry of Finance are under the State Council and ultimately the CCP. The State Council is a critical coordination connection between the industrial and financial SOEs. Similar vertical connections are present at the local government level. Thus, the industrial SOEs can easily secure their financial resources through the ultimate common connection. It makes the use of direct ownership or personnel connections across the financial and industrial worlds practically redundant.
Furthermore, when resource availability is secured through the ultimate common connection, the major concern for the state as the owner and as the policymaker shifts towards risk control in the system. The sparse lateral ownership and personnel connections between the industrial SOEs and the major banks help to reduce management complexity and risk connectivity in the state-owned sector, which is of particular importance as both the industrial and financial SOEs are suffering from their own management problems. Such a lack of lateral connections at the same time reinforces the vertical control. Unlike in other capitalist systems, the corporate network in China's state-owned sector is characterized by party-state centrality rather than bank centrality.
Third, the analysis of executive career patterns sheds light on the productivity and diversity problems in China's SOEs. China's industrial SOEs, typically organized as business groups, have been criticized for their weak production coordination among group members.Footnote 29 In theory, the predominance of the single-group career pathway in which industrial SOE CEOs tend to accumulate work experience across firms within a group suggests the potential for intra-group integration and coordination. The lack of lateral coordination may relate to the vertical control structure within the group. How to utilize intra-group human resource flows effectively to facilitate group production integration without encouraging corruption is a challenging task for China's industrial SOEs. Unlike industrial SOEs, the state-controlled banks are quite well connected to each other through the career flows of their executives, and a couple of banks act as training hubs. Rich sociological literature has shown that the flow of top managers between firms plays an important role in the isomorphism of business practices.Footnote 30 The prevalence of executive rotations among the state-controlled banks partly explains the lack of differentiation and diversity in the competition strategies of China's banking industry. Introducing more system outsiders may promote innovation in banking practices, but this really depends on the state owner's willingness to surrender powers of control, as seen in the CGB case.
Finally, the executive career analysis affirms that China is a case sui generis in comparative capitalism. For instance, a number of scholars suggest that China operates a system of centrally managed capitalism, which bears some resemblance to the French model, in which there are frequent personnel exchanges between government agencies and corporations.Footnote 31 French CEOs often have a long career in the public sector before transferring to the corporate sector. However, unlike France, the findings in this article suggest the flow of human resources between the SOE sector and the government sector in China is more from the former to the latter than the other way around. It is also interesting to observe that the CEOs of China's banking industry frequently present a career pathway that crosses multiple banks. In contrast, in the United States the most common executive career pathway (50 per cent) for the largest ten commercial banks (by assets) is an in-house career pattern.Footnote 32 This suggests some specific institutional factors other than the generalizability of financial knowledge per se play an important role in shaping the executive career pathway in the banking industry.
Biographical note
Li-Wen Lin is an assistant professor at the University of British Columbia Peter A. Allard School of Law. She holds a PhD degree in sociology from Columbia University and a JSD degree from the University of Illinois.