I. INTRODUCTION
TiO2 is the most promising material in the field of photocatalysis because of its superior photocatalytic activity, chemical stability, low cost, and nontoxicity. As such, its performances in photocatalytic degradation of chemical pollutants and solar energy conversion have been widely studied in the past decades, and its practical application has been seriously considered. Reference Hoffmann, Martin, Choi and Bahnemann1,Reference Chen and Mao2 TiO2 assembled with Ag nanoparticles (NPs) has received much attention because such a hybrid can effectively separate the charges and redshift the absorption to visible light via plasmonic resonance. Reference Es-Souni, Es-Souni, Habouti, Pfeiffer, Lahmar, Dietze and Solterbeck3–Reference Hou and Cronin5 For example, Awazu et al. combined TiO2 and Ag core/SiO2-shell NPs in a heterostructure and the photocatalytic activity was enhanced by a factor of 7 under near-ultraviolet (UV) irradiation. Reference Awazu, Fujimaki, Rockstuhl and Tominaga4 TiO2 assisted by the localized surface plasmon resonance (LSPR) is promising in applications such as photocatalysis, Reference Es-Souni, Es-Souni, Habouti, Pfeiffer, Lahmar, Dietze and Solterbeck3–Reference Hou and Cronin5 photovoltaic cells, Reference Tian and Tatsuma6,Reference Liu, Hou, Pavaskar, Aykol and Cronin7 reversible imaging, Reference Ohko, Tatsuma, Fujii, Naoi, Niwa, Kubota and Fujishima8 LSPR sensors, Reference Tanahashi, Iwagishi and Chang9 etc.
Photocatalytic synthesis is a cost-effective way to fabricate Ag–TiO2 films. Using TiO2 films as the photocatalytic reduction media, the Ag+ ions in the AgNO3 solution are reduced on TiO2 films under UV irradiation, forming TiO2-catalyzed Ag NP films, which have been used as the substrates for surface enhanced Raman scattering (SERS). Reference Li, Pan, Li, Liu, Wu and Peng10,Reference Mills, Hill, Stewart, Graham, Smith, Hodgen, Halfpenny, Faulds and Robertson11 However, the growth dynamics of Ag NPs still remains an open question and has attracted fundamental interest. Ag NPs synthesized by photocatalytic reduction generally exhibit irregular sphere-like shapes. Recently, the photocatalytic growth of anisotropic Ag NPs on the TiO2 films in the AgNO3 ethanol solution was reported, and the vertical growth of Ag nanoplates was attributed to the surface roughness and random features of substrate. Reference Tanabe, Matsubara, Stridge, Kazuma and Kelly12,Reference Matsubara, Kelly, Sakai and Tatsuma13 Using an annealed single-crystalline TiO2 substrate, Kazuma et al. reported the bi- and uniaxially oriented growth of Ag NPs. Reference Kazuma, Matsubara, Kelly, Sakai and Tatsuma14 The preferential orientation and morphology of these Ag NPs were found depending on the presence of ethanol, acetaldehyde, and UV exposure conditions. Though the photocatalytic reduction method has been widely used for fabricating Ag–TiO2 films, studies involving the growth mechanism of Ag NPs are unavailable. In this study, the Ag NP growth in the AgNO3 aqueous solution was systematically studied in terms of reduction, nucleation, and coalescence via morphological characterization and in situ extinction spectroscopy. A photocatalytic growth model was proposed, and the plasmonic properties of the Ag–TiO2 films were studied.
II. EXPERIMENTAL DETAILS
A. Preparation of TiO2 films
The nanoparticulate TiO2 films used for the growth of Ag NPs were prepared using a conventional sol–gel method. First, solutions A and B were prepared by mixing 3 mL acetylacetone in 50 mL titanium isopropoxide and by adding 0.21 mL nitric acid and 1.4 mL deionized water to 150 mL ethyl alcohol, respectively. After mixing, solutions A and B were stirred for 10 min. All the chemicals used in the preparation were of analytical reagent grade and were purchased from Kermel Chemical Reagents Co. Ltd. Subsequently, the TiO2 sol was prepared by adding solution B dropwise to solution A under vigorous stirring, and then stirred for 2 h at room temperature. The TiO2 sol was aged for 2 days before use. Finally, the TiO2 gel films were coated on the substrate of a cleaned glass slide via a dip-coating method. The TiO2 gel films were heated at 550 °C for 1 h in a muffle furnace to obtain nanoparticulate TiO2 films. The TiO2 films were controlled at a thickness of ∼100 nm.
B. Growth of Ag NPs
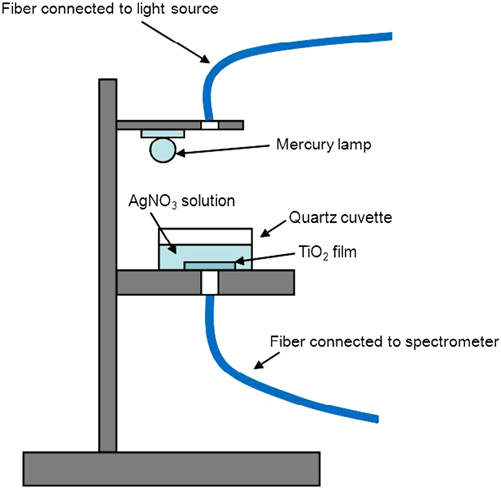
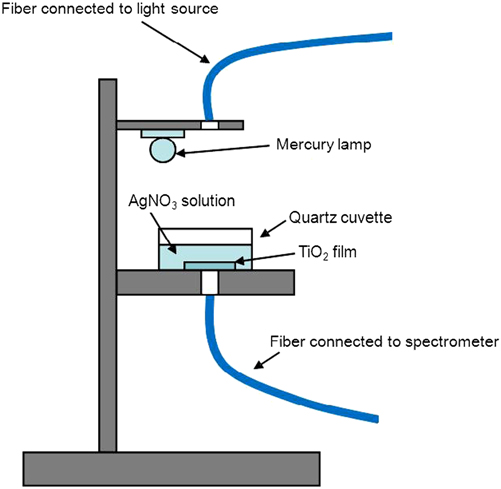
Ag NPs were grown in the AgNO3 aqueous solution under UV irradiation by a low-pressure mercury lamp (Philips TUV, Amsterdam Noord-Holland, Holland, 8 W). The UV photon (>3.1 eV) flux was estimated to be 1016/cm2·s when fixing the lamp at a distance of TiO2 film of ∼6 cm. The experimental setup is depicted in Fig. 1, and the Ag NP growth was performed in a dark room and monitored by in situ extinction spectrum measurement using a UV–visible–near-infrared spectrometer (UV–Vis–NIR, Ocean Optics, Maya 2000-Pro, Dunedin FL). 50–3200 mg/L (∼0.3 to ∼18.8 mM) AgNO3 aqueous solutions were used for the study on the growth dynamics of Ag NPs. After the growth was stopped, the samples were immediately taken out and were carefully cleaned, and then dried with a slow flow of dry nitrogen.
Schematic experimental setup and the in situ monitoring system of extinction spectroscopy.
C. Characterization of Ag–TiO2 films
Scanning electron microscopy (SEM, Hitachi, S-4800, Tokyo, Japan) was used to characterize the morphology of Ag–TiO2 films. The SEM images were statistically analyzed to obtain the size distribution of Ag NPs. Transmission electron microscopy (TEM, Hitachi, H800, Tokyo, Japan) was used to study the crystal structure of Ag nanoplates. The roughness of Ag–TiO2 films was determined by atomic force microscopy (AFM, Benyuan, CSPM 5000, Shenzhen, China). Using 10 μM Rhodamine 6G (R6G) ethanol solution as the probe, the SERS activity of the Ag–TiO2 films was evaluated by collecting Raman signals under excitation of a He–Ne laser operating at ∼3.5 mW with a Raman spectroscope (Renishaw inVia plus, Renishaw, Wotton-under-Edge Gloucestershire, UK). Raman enhancement factor (EFSERS) was calculated using the Raman spectrum of 0.1 M R6G solution on a pure TiO2 film as the reference and by taking the numbers of R6G molecules within the irradiated area into account. Rhodamine B (RhB) was used as the fluorophore to study the fluorescence enhancement. To avoid fluorescence quenching due to a direct contact of fluorophore with Ag NPs, 1 mM RhB was added to TiO2 sol–gel, and then coated on Ag–TiO2 films by a spin-coating method. Photoluminescence (PL) and PL excitation (PLE) spectra were measured using a FLS 920 fluorescence spectrometer (Edinburgh Instruments Ltd., Scotland, U.K.) under excitation of a Xe lamp. Time-resolved spectroscopy was used to study the PL decay under excitation of a 405 nm laser diode with a pulse width of <80 ps and a repetition frequency of 20 MHz. The average PL lifetimes of RhB molecules were obtained by fitting the time-resolved PL spectra with a double exponential function.
III. RESULTS AND DISCUSSION
A. Isotropic growth of Ag NPs
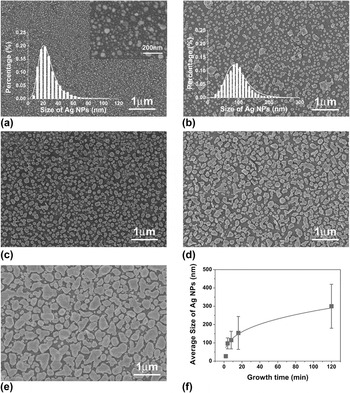
Figure 2 shows the typical morphology of isotropic Ag NPs, which were grown in the 180 mg/L (∼1 mM) AgNO3 solution. The SEM images show that the Ag NPs at the growth time of 2, 4, 8, 16, and 120 min exhibited irregularly spherical shapes. At a 2 min growth time, the Ag NPs are ∼27 nm of average size and ∼4 × 10⁹/cm2 of density. When increasing the growth time to 4 min, the Ag NP density dramatically reduced to ∼2.3 × 10⁶/cm2, and the size increased to ∼97 nm, indicating that the coalescence process took place between Ag primary particles at a growth time in between 2–4 min. By fitting the time dependence of average size (d) after the coalescence phenomenon, we found d 3 ∝ t, as shown in Fig. 2(f). Such a relationship is an indication of diffusion-limited growth. In other words, Ostwald ripening (OR) Reference Viswanatha, Santra, Dasgupta and Sarma15 dominates the coarsening process of Ag NPs.
(a–e) SEM images of Ag–TiO2 films grown in 180 mg/L AgNO3 solution at the growth time of 2, 4, 8, 16, and 120 min, respectively. The insets in (a) and (b) are the size distributions of Ag NPs. (f) Growth-time dependence of Ag NP size.

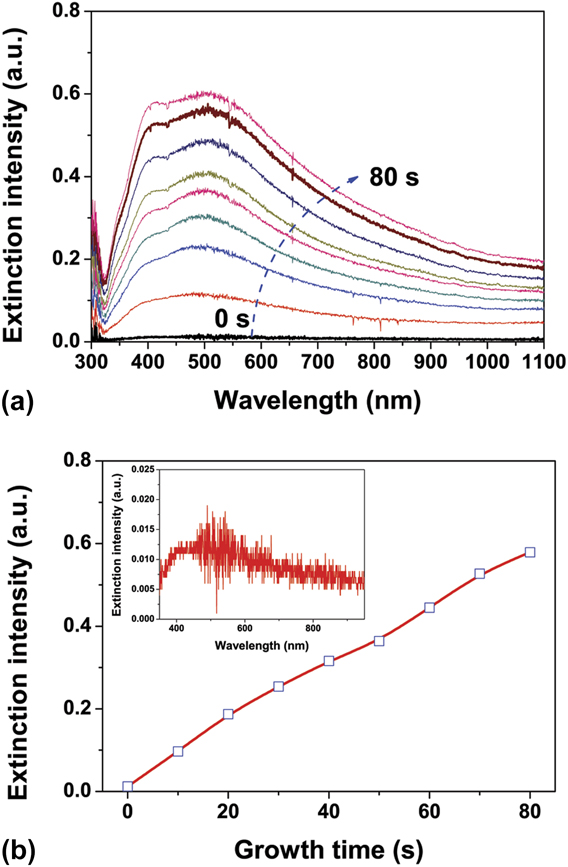
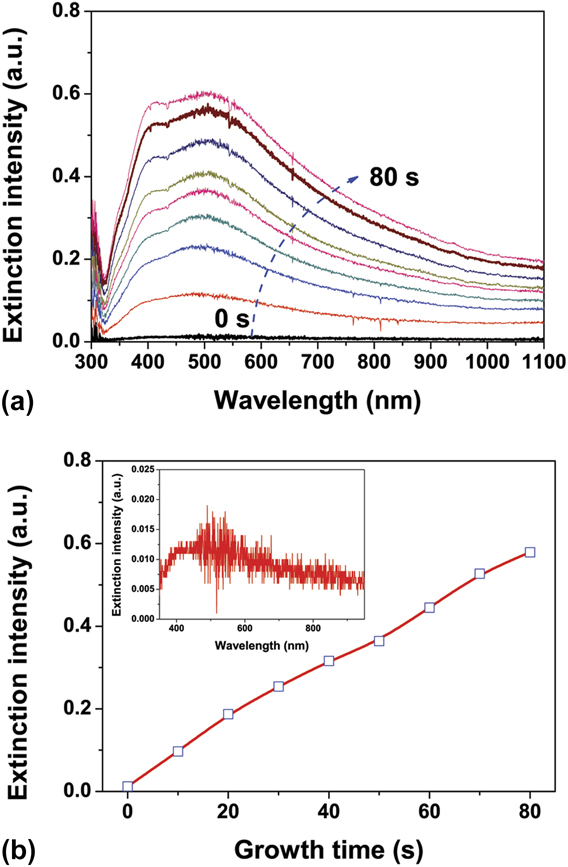
Ex situ SEM observation is incapable of detecting the dynamic process of Ag NP growth and cannot provide the required resolution to recognize the Ag primary NPs in the nucleation stage. Therefore, in situ extinction spectroscopy was used to study the photocatalytic nucleation of Ag NPs. Figure 3(a) shows the in situ extinction spectra from the photocatalytic beginning to 80 s. The extinction was defined by ln(I 0/I), where I 0 is the transmitted intensity before photocatalytic reduction and I is the intensity during photocatalytic reduction. The extinction spectra were recorded in 13 ms with intervals of 10 s. As shown in the figure, two extinction peaks, which are associated with Ag primary particle density and size, appeared at ∼400 and ∼510 nm. By plotting the extinction intensity at ∼400 nm as a function of growth time, as shown in Fig. 3(b), the formation of Ag primary particles was extrapolated to a time as early as <1 s after the photocatalytic beginning. As a matter of fact, the extinction of Ag primary particles was observed in the 0-s spectrum, as shown in the inset of the figure, indicating that the nucleation took place truly in a very short time after the photocatalytic reduction started. The extinction spectra show that the number of Ag NPs is increasing with the irradiation time, whereas the change in sizes is not obvious. The formation of Ag primary particles originates from supersaturated Ag atoms, which are related to the photocatalytic reduction ability of TiO2 films. Based on the statistical analysis of Ag NPs, the Ag reduction rate was estimated to be ∼2 × 1013 cm−2 s−1, which is reasonable in comparison with the irradiation photons of ∼1016 cm−2 s−1.
(a) In situ extinction spectra of Ag NPs grown in 180 mg/L AgNO3 solution from the photocatalytic beginning to 80 s, in which the spectra were recorded in 13 ms with intervals of 10 s. (b) Growth-time dependence of extinction intensity at ∼380 nm and the inset is 0-s extinction spectrum.
B. Anisotropic growth of Ag NPs
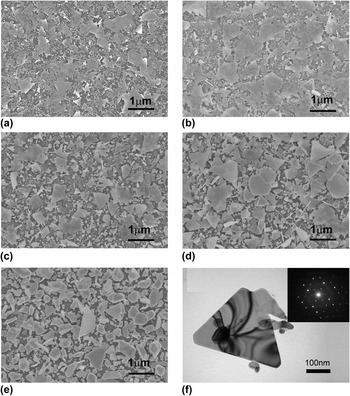
The Ag reduction rate is determined by the parameters related to UV irradiation, reduction activity of TiO2 film, AgNO3 concentration of solution, etc. By increasing the AgNO3 concentration, we found that the increased Ag reduction rate gave rise to a change in Ag NP growth, resulting in the formation of Ag nanoplates in the product. Figure 4 shows an example of Ag NP growth in the 2800 mg/L AgNO3 solution. As shown in the figure, a large amount of thin Ag nanoplates were produced at the growth time as early as 2 min. The Ag nanoplates were ∼10 nm thick and 0.1–1 μm of edge length. With an increase in the growth time, the sizes of Ag nanoplates were not varied obviously, but the thickness increased. TEM analysis shows that the nanoplates are faced with Ag (111) planes, as shown in Fig. 4(f). At a 120 min growth time, the Ag nanoplates were rarely observed, instead evolved into three-dimensional Ag NPs with the well-defined shapes, which are a little different from the irregular Ag NPs grown in the 180 mg/L AgNO3 solution. The SEM images reveal that the increased AgNO3 concentration promoted an early coalescence resulting in the formation of Ag nanoplates. In other words, the Ag nanoplates were formed in the early period of coalescence, rather than gradually grew up with the increase in the growth time.
(a–e) SEM images of Ag–TiO2 films grown in 2800 mg/L AgNO3 solution at the growth time of 2, 4, 8, 16, and 120 min, respectively. (f) TEM image of a triangular Ag nanoplate and diffraction pattern (inset).

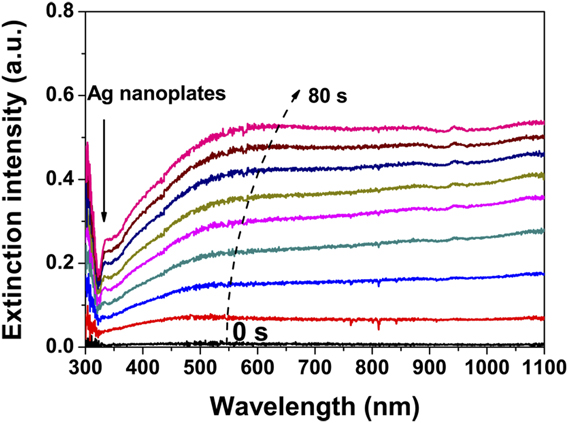
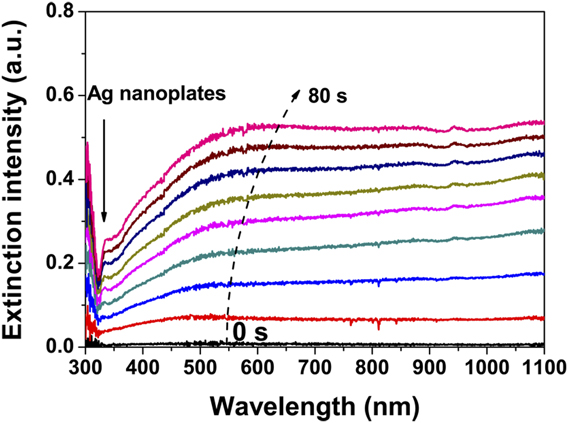
Figure 5 shows the in situ extinction spectra from the beginning to 80 s. It is different from the growth of Ag NPs in the 180 mg/L AgNO3 solution that the extinction in the visible region is slowly increased and the extinction peaks associated with individual Ag NPs are not clearly distinguishable. On the other hand, the extinction in the NIR region is rapidly increased with the increase in the growth time. According to the effective medium theory, Reference Moores and Goettmann16,Reference Ung, Liz-Marza and Mulvaney17 the enhanced extinction in the NIR region can be attributed to the extreme high-density primary particles and/or the formation of Ag nanoplates. In fact, the Ag nanoplates were formed at a quite early time, because a small extinction peak at ∼340 nm, which has been assigned to out-of-plane quadrupole resonance of Ag nanoplates in the AgNO3 solution, Reference Jin, Cao, Hao, Me, Schatz and Mirkin18 emerged in the 30-s spectrum and gradually changed to be clear with the increase in the growth time, as indicated by the arrow in the figure. SEM images show that Ag nanoplates and irregularly spherical Ag NPs were co-existed in the photocatalytic growth using 2800 mg/L AgNO3 solution, whereas the isotropic growth of Ag NPs was restrained. The Ag reduction rate in 2800 mg/L AgNO3 solution was estimated to be ∼2 × 1014 cm−2 s−1, which is ∼10 times of that in 180 mg/L AgNO3 solution. Therefore, we conclude that the increased reduction rate promotes the formation of Ag nanoplates. Such nanoplates are of interest in the fields such as stereoscopic visions, storing multiple information, certification, and anticounterfeit technologies and polarizers, Reference Sakai, Tanabe and Tatsuma19,Reference Tanabe, Matsubara, Sakai and Tatsuma20 because they have three major LSPR modes, namely, out-of-plane mode, in-plane longitudinal and transverse modes, and respond selectively to light polarized in a specific angle.
In situ extinction spectra of Ag nanoplates grown in 2800 mg/L AgNO3 solution from the photocatalytic beginning to 80 s, in which the spectra were recorded in 13 ms with intervals of 10 s.
C. Growth mechanism of Ag NPs
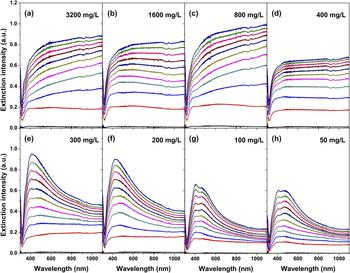
Using 50–3200 mg/L AgNO3 solution, we systematically investigated the photocatalytic growth dynamics of Ag NPs using in situ extinction spectra. As shown in Fig. 6, the extinction spectra reveal that the Ag NPs are of typical isotropic growth in the solutions of ≤300 mg/L and transit into anisotropic growth in the solutions of ≥400 mg/L, indicating that a critical AgNO3 concentration in between 300 and 400 mg/L is needed for the formation of Ag nanoplates. Besides AgNO3 concentration, the surface properties of TiO2 films were also found to be responsible for the formation of Ag nanoplates. All the films used for the above study were kept in moisture environment for weeks. Using a fresh film, which was immediately used for Ag NP growth after calcination, or using films kept in a dry atmosphere, Ag nanoplates were never obtained by photocatalytic growth in 50–3200 mg/L AgNO3 solutions, suggesting that H2O absorption modified the surface properties of TiO2 films and changed the photocatalyic reaction. We believe that the re-oxidation of reduced Ag atoms and the electron–hole recombination are the likely reasons for decrease in Ag reduction rate. To prevent Ag atoms from re-oxidation and/or to effectively separate charges, a layer of vacuum pump oil was coated on the surface of TiO2 film, and then the anisotropic Ag NP growth was successfully induced, Reference Li, Tao, Li and Zhang21 evidencing our assumption.
In situ extinction spectra of Ag–TiO2 films grown in 50–3200 mg/L AgNO3 solutions, in which the extinction spectra were recorded in 13 ms with intervals of 6 min.

By carefully observing the SEM images [Figs. 4(a)–4(c)], we found that the nanoplates generally lie on the irregularly spherical NPs, and the small NPs beneath thin nanoplates are visible, indicating that the nanoplates were produced in the solution, rather than on the surface of TiO2 film. In other words, Ag nanoplates were produced primarily in the area adjacent to the film surface, and adhered to the surface when they were taken out from the solution. As a matter of fact, a large amount of low-dimensional Ag nanostructures, such as nanowires, nanoribbons, and nanoplates, had been taken from the solution when the photocatalytic growth of Ag NPs was conducted for a longer time using TiO2 or ZnAlO films as the reduction media, as shown in the supporting material (Fig. S1). To understand the formation mechanism of Ag NPs and Ag nanoplates, we proposed a growth model by taking Ag atom and Ag+ ion diffusion into consideration. Because the solution density is close to that of a solid, the force applied to Ag atoms by the substrate atoms is approximately equal to that by the atoms in the solution. Thus, it is different from the film growth in a vacuum that Ag atoms on the surface of TiO2 film have a large possibility to diffuse into a solution. Considering that the Ag atoms were produced on the surface of TiO2 film by the reduction of Ag+ ions, the one-dimensional diffusion equations and the boundary conditions for Ag atom and Ag+ ion diffusion can be written as
 $${{\partial u(x,t)} \over {\partial t}} = {D_0}{{{\partial ^2}u(x,t)} \over {\partial {x^2}}}\quad ,$$
 $${{\partial v(x,t)} \over {\partial t}} = {D_ + }{{{\partial ^2}v(x,t)} \over {\partial {x^2}}}\quad ,$$
 $${\left. {{{\partial u(x,t)} \over {\partial t}}} \right|_{x = 0}} = {k_{\rm{R}}}v(0,t) - {k_{\rm{O}}}u(0,t)\quad ,$$
 $${\left. {{{\partial v(x,t)} \over {\partial t}}} \right|_{x = 0}} = - {k_{\rm{R}}}v(0,t) + {k_{\rm{O}}}u(0,t)\quad ,$$
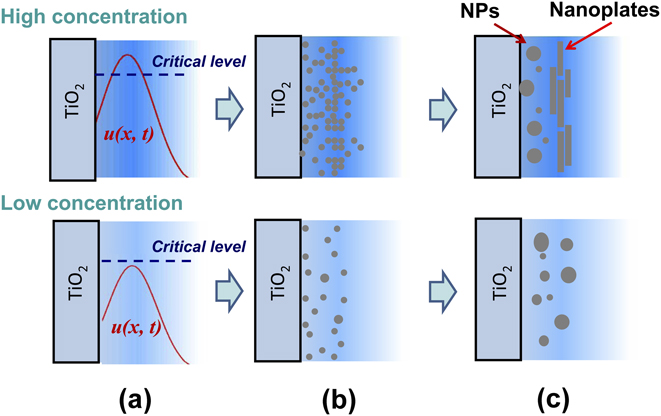
where u(x, t) and v(x, t) are the Ag and Ag+ densities at position x and at time t, respectively; D 0 and D + are the corresponding diffusion coefficients; k R and k O are the reduction and oxidation rates. Numerical calculations showed that the reduction on TiO2 film reaches equilibrium with the oxidation in a time scale of <<1 ms. Thus, u(x, t) is something like the diffusion function with u(0, t) = constant. Taking the film roughness and the transverse diffusion into account, a specific u(x, t) in Fig. 7(a) is suggested. Once u(x, t) is supersaturated, nucleation is possible. The critical free energy (ΔG c), critical radius (r c), and critical density (n c) of primary particles are related to supersaturated concentration (C) by Reference Ohring22
 $$\Delta {G_{\rm{c}}} = {{16\pi {\sigma ^3}} \over 3}{\left[ {{{{v_{\rm{a}}}} \over {kT\ln \left( {{C \mathord{\left/ {\vphantom {C {{C_0}}}} \right. \kern-\nulldelimiterspace} {{C_0}}}} \right)}}} \right]^2}\quad ,$$
 $${r_{\rm{c}}} = {{2\sigma {v_{\rm{a}}}} \over {kT\ln \left( {{C \mathord{\left/ {\vphantom {C {{C_0}}}} \right. \kern-\nulldelimiterspace} {{C_0}}}} \right)}}\quad ,$$
 $${n_{\rm{c}}} = {n_{\rm{s}}}\exp \left( { - {{\Delta {G_{\rm{c}}}} \over {kT}}} \right)\quad ,$$
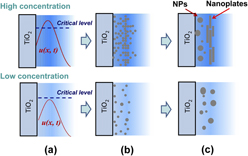
where C 0 is the saturated concentration of Ag atoms, σ is the surface free energy density of primary particles, v a is the atomic volume, and n s is the number of nucleation sites. Equations (5) and (7) tell us that the distribution u(x, t) of Ag atoms produces nonuniformly distributed primary particles, which might be decisive for the formation of Ag nanoplates or not. According to Eqs. (6) and (7), the large value of u(x, t) produces the high-density and small-size primary particles. Therefore, if the supersaturated u(x, t) is lower than a critical level in the nucleation gestation, the density of primary particles is low, and then the OR mechanism dominates the coalescence process leading to the isotropic growth of Ag NPs. If u(x, t) within a large enough area is higher than the critical level, the density of primary particles is so high that a new coalescence mechanism, probably the oriented attachment (OA) mechanism, promotes the formation of Ag nanoplates, as shown in Figs. 7(b) and 7(c). At the same time, the OR growth still dominates the area where u(x, t) is lower than the critical level, and then the isotropic Ag NPs are present. The restrained isotropic growth of Ag NPs can be attributed to the larger surface free energy of irregular Ag NPs in comparison with that of Ag nanoplates because the atom transfer is always from where surface free energy is high to where surface free energy is low.
Photocatalytic growth model of Ag NPs in AgNO3 solution: (a) reduction of Ag atoms, (b) nucleation of Ag primary particles, and (c) coalescence of Ag NPs and/or Ag nanoplates. The top panel is for high AgNO3 concentration and the bottom panel is for low AgNO3 concentration.
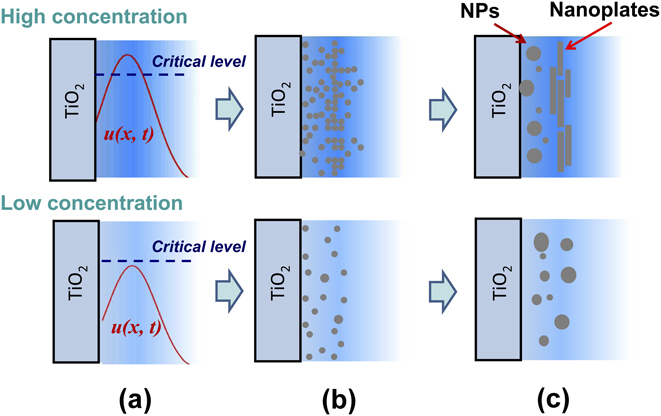
The growth model can explain the phenomenon of Ag nanoplates lying on the small Ag NPs. On the other hand, the growth model is consistent with the conclusion of Yin et al. that the OA growth is facilitated in high-density primary particles. Reference Yin, Huang, Zhang, Zheng and Lin23 Similarly, the formation of Ag nanoplates using AgNO3 ethanol solution Reference Tanabe, Matsubara, Stridge, Kazuma and Kelly12 or using oil-decorated TiO2 films Reference Li, Tao, Li and Zhang21 can also be attributed to the increase in the Ag reduction rate due to the photodegradation of organic molecules. It should be emphasized that the growth model suggested the importance of surface roughness in the formation of Ag nanoplates, which is consistent with the observation of Tanabe et al. that the growth of Ag nanoplates was related to the surface roughness and random features of substrate. Reference Tanabe, Matsubara, Stridge, Kazuma and Kelly12 According to our growth model, a smooth TiO2 film facilitates the formation of large-scale Ag nanoplates. As a matter of fact, a Ag nanoplate larger than ∼10 μm × 10 μm was obtained by using a smooth TiO2 film, as shown in the supporting material (Fig. S2). On the other hand, the growth model is proposed on the basis of our experimental setup with strong UV irradiation. Under strong UV irradiation, the nucleation on TiO2 films is not important in the photocatalytic growth of Ag NPs because the reduction–oxidation environment does not facilitate the formation of stable Ag primary particles. To realize the epitaxial growth of Ag NPs, we recommend using a low UV photon flux and a single-crystal TiO2 substrate.
D. Extinction spectra of Ag–TiO2 films
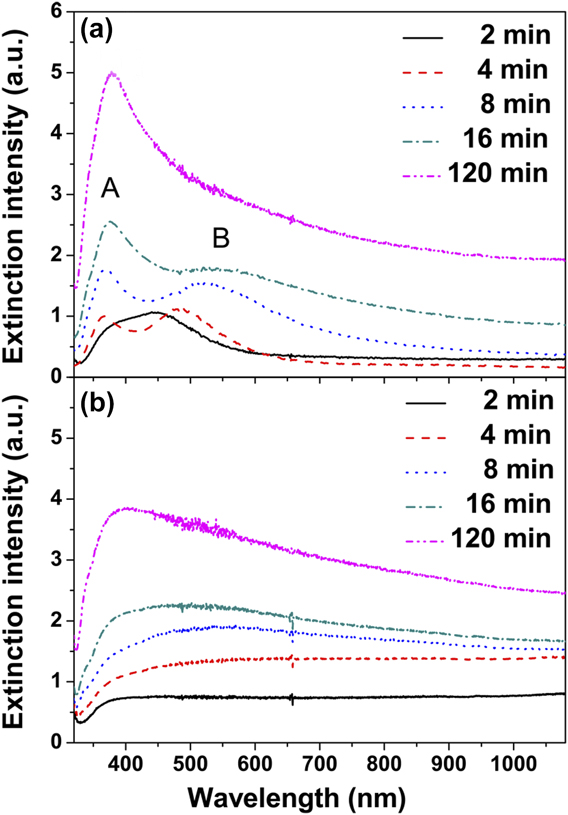
Figure 8 shows the extinction spectra of Ag–TiO2 films grown at the growth time of 2, 4, 8, 16, and 120 min. For the films grown in the 180 mg/L AgNO3 solution, the Ag–TiO2 film at 2 min growth time exhibits a UV extinction peak at ∼380 nm and a blue–green extinction peak at ∼450 nm, as shown in Fig. 8(a). With an increase in the growth time, the UV peak was blue-shifted and the blue–green peak was red-shifted. The two extinction peaks are very like the quadrupole and dipole resonances of Ag spheroids, Reference Kelly, Coronado, Zhao and Schatz24 however, they are more likely due to a combination of factors because visible quadrupoles require extreme size, shape, and external medium regularity in a typical macro geometry which averages over thousands of particles. In other words, the extinction spectra are the hybridized plasmon response of the complex nanostructures Reference Prodan, Radloff, Halas and Nordlander25 or due to an asymmetric dielectric environment. Reference Beck, Verhagen, Mokkapati, Polman and Catchpole26 When increasing the growth time, the extinction peak at ∼380 nm was rapidly enhanced and the extinction peak at ∼450 nm was weakened. The extinction peak at ∼450 nm was no more observed for the Ag–TiO2 film at a 120 min growth time.
Extinction spectra of Ag–TiO2 films at the given growth times: (a) Ag–TiO2 films grown in 180 mg/L AgNO3 solution and (b) Ag–TiO2 films grown in 2800 mg/L AgNO3 solution.
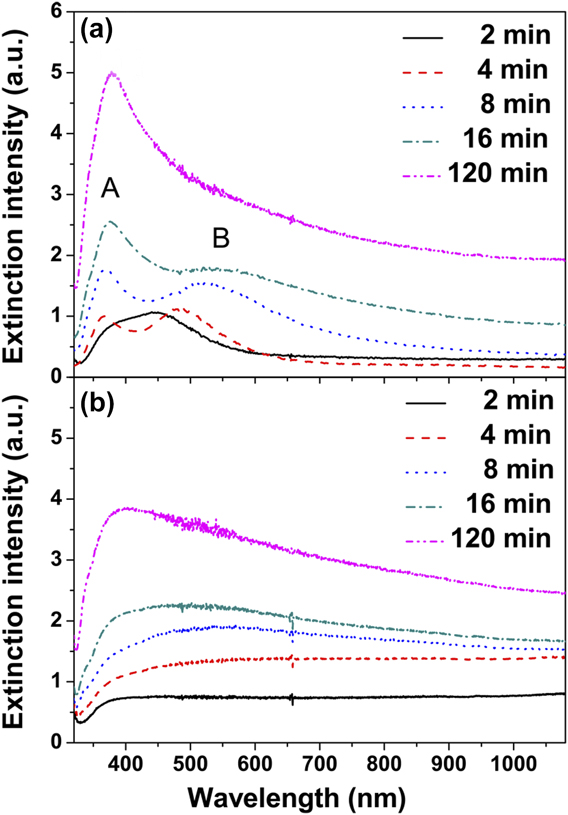
For the Ag–TiO2 film grown in the 2800 mg/L AgNO3 solution at 2 min growth time, the extinction spectrum is something like that of a smooth and compact Ag film, and no particle-like extinction peak was observed, as shown in Fig. 8(b), indicating that the Ag nanoplates with various sizes dominate the extinction of the Ag–TiO2 film. With the increase in the growth time, the particle-like extinction emerges and gradually changes to be visible. By observing the SEM images presented in Fig. 4, we suggest that the particle-like extinction results from the transition of Ag nanoplates to the Ag NPs with well-defined shapes. At 120 min growth time, the extinction spectrum changed to be similar to that of the Ag–TiO2 film grown in 180 mg/L AgNO3 solution, which is in accordance with SEM observation.
E. SERS of Ag–TiO2 films
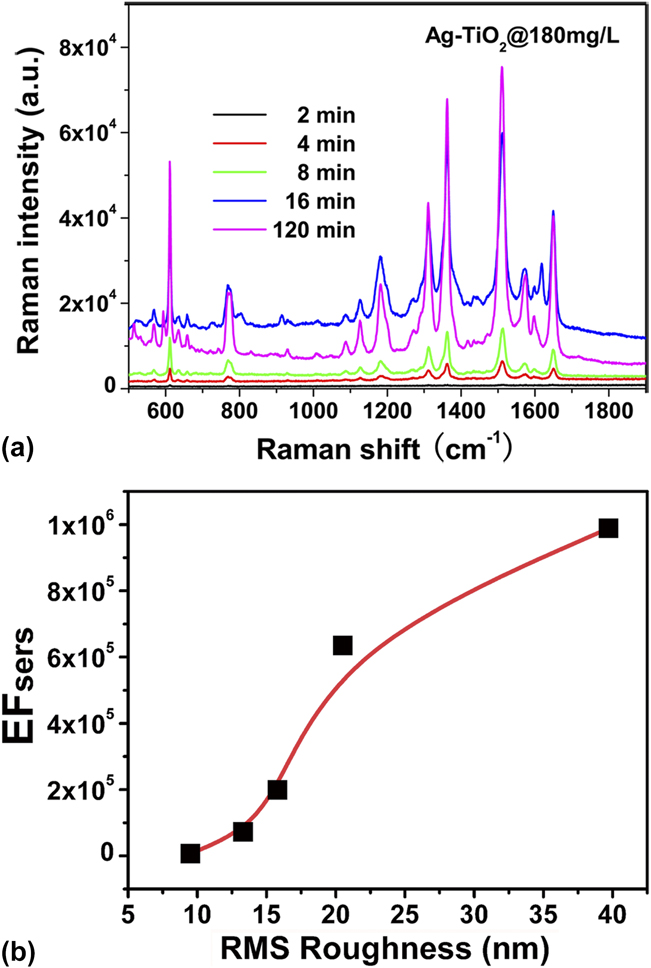
Using R6G as the probe molecule, the SERS activity of the Ag–TiO2 films was evaluated. Figure 9(a) shows the Raman spectra of R6G molecules on Ag–TiO2 films grown in 180 mg/L AgNO3 solution at the growth time of 2, 4, 8, 16, and 120 min. The R6G featured bands are identified to be the in-plane bending vibration of C–C–C ring at 612 cm−1, the out-of-plane and in-plane bending vibrations of C–H at 770 and 1130 cm−1, and aromatic stretching vibrations at 1362, 1510, and 1650 cm−1. Reference Hildebrandt and Stockburger27,Reference Tao, Li, Zhang, Kang, Yang, Qiu and Liu28 The Raman intensities increased when increasing the growth time from 2 to 120 min. Using the Raman intensity of 0.1 M R6G on a pure TiO2 film as the reference, EFSERS was determined by carefully calculating the number of R6G molecules within the irradiation area. The Ag–TiO2 film at 120 min growth time exhibits an enhancement factor of ∼106, indicating that such a cost-effective Ag–TiO2 film is available for SERS applications.
(a) Raman spectra of R6G molecules on Ag–TiO2 films that were grown in 180 mg/L AgNO3 solution at the given growth time. (b) SERS enhancement factor as a function of the film surface roughness.
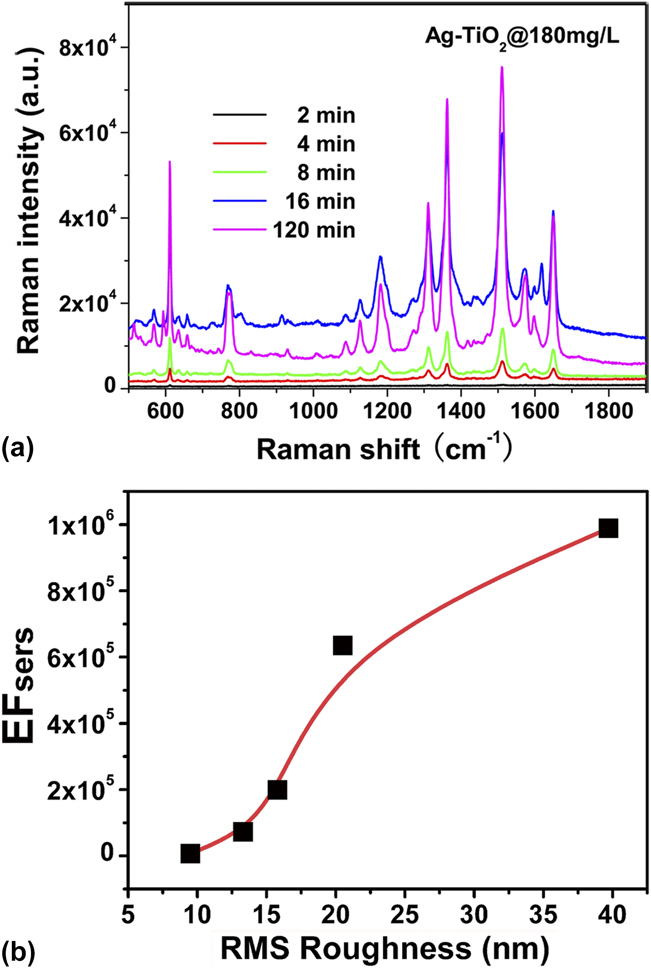
Two kinds of electromagnetic “hot spots”, the sub-10 nm “feed-gaps” between metal NPs and the “lightning rods”, Reference Garcia-Vidal and Pendry29,Reference Yang, Matsubara, Xiong, Hayakawa and Nogami30 have been known making the important contributions to SERS. Based on our SEM observation, the “feed-gaps” were excluded because the adjacent Ag NPs are generally separated by a distance larger than 10 nm. Thus, “lightning rods” are proposed to be the SERS mechanism of Ag–TiO2 films. To demonstrate our proposal, AFM was used to quantitatively measure the roughness of Ag–TiO2 films, and the roughness dependence of EFSERS is plotted in Fig. 9(b). EFSERS increased with the roughness of Ag–TiO2 films, indicating that the enhanced Raman signals can be attributed to the “lightning rods” effect at the sharp edges of Ag NPs, similar to the SERS mechanism on a rough Ag metal surface.
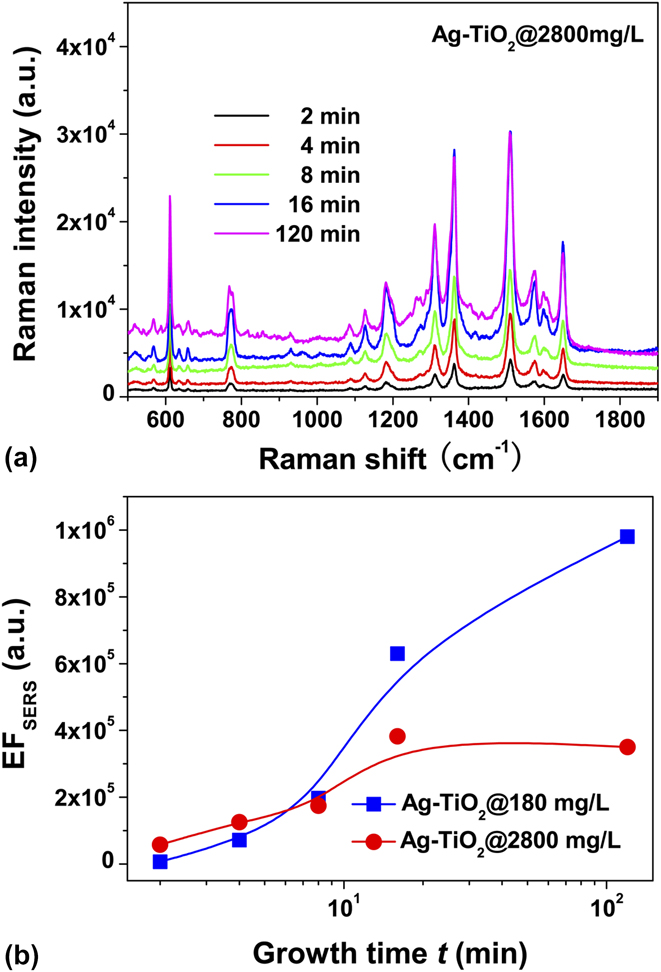
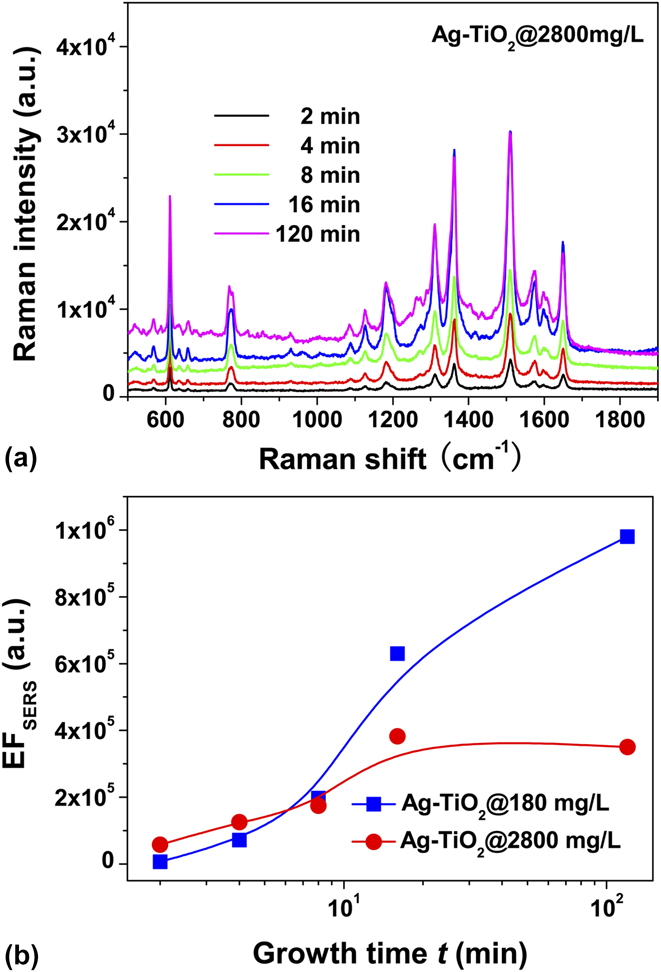
Similar to the films grown in 180 mg/L AgNO3 solution, the Ag–TiO2 films grown in 2800 mg/L AgNO3 solution extremely enhanced the Raman signals of R6G molecules, as shown in Fig. 10(a). Figure 10(b) shows the growth-time dependence of SERS enhancement factor, and the EFSERS values of the Ag–TiO2 films grown in 180 mg/L AgNO3 solution are also plotted for comparison. The Ag–TiO2 films dominated by Ag nanoplates, which are the two samples grown in 2800 mg/L AgNO3 solution for 2 and 4 min, produced a ∼1 × 10⁵ Raman enhancement, which is larger than that of Ag–TiO2 films with small Ag NPs, but smaller than that of Ag–TiO2 films with large Ag NPs. With the increase in the growth time, the EFSERS values increased. The increase of EFSERS values can be ascribed to the transition of Ag nanoplates to Ag NPs with well-defined shapes, increasing the density of large Ag NPs. However, the production of large Ag NPs in 2800 mg/L AgNO3 solution is lower than that in 180 mg/L AgNO3 solution, as shown in Fig. 4(e). Therefore, the increase in Raman enhancement is limited when the growth time was extended to 120 min. The results suggest that using a high concentration solution cannot bring large SERS values due to the formation of Ag nanoplates.
(a) Raman spectra of R6G molecules on Ag–TiO2 films that were grown in 2800 mg/L AgNO3 solution at the given growth time. (b) SERS enhancement factor as a function of the growth time.
F. Enhanced fluorescence of Ag–TiO2 films
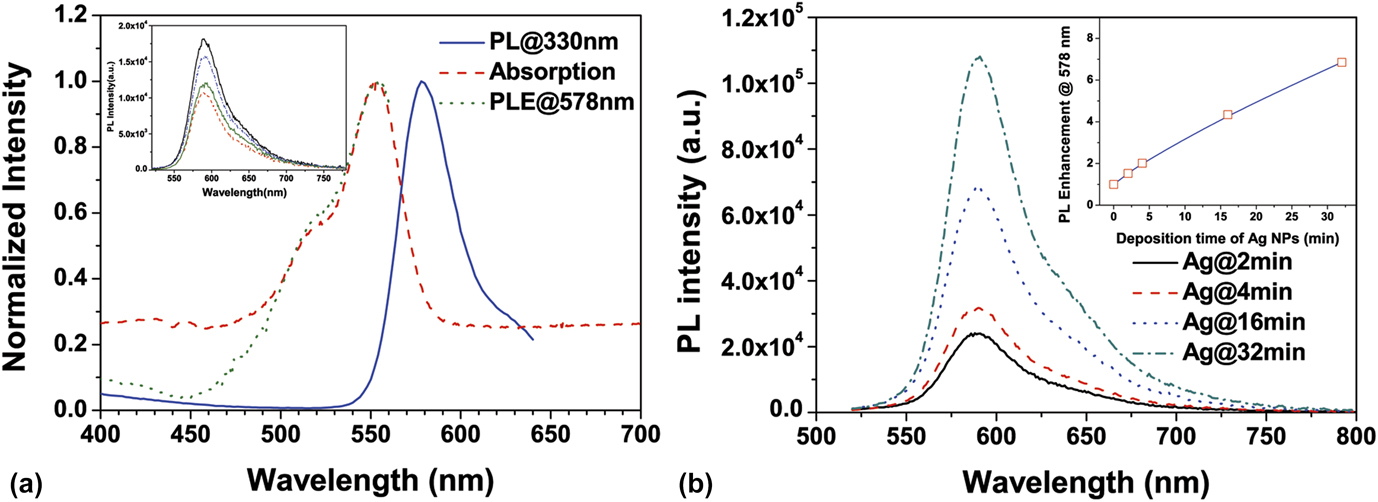
Silver island films were studied in fluorescence enhancement, but few reports involved the Ag–TiO2 film with high-density Ag NPs. Using RhB as the fluorophore, we studied the fluorescence enhancement of the Ag–TiO2 films grown in 180 mg/L AgNO3 solution. The fluorophore of 1 mM RhB in TiO2 sol–gel was coated on the surface of Ag–TiO2 films to avoid the fluorescence quenching. The average distance between the fluorophores is ∼12 nm, larger than Forster distance (4.2 nm) for the homoresonance energy transfer, and the fluorophore density was estimated to be ∼6 × 1015 cm−2 in a 100 nm layer adjacent to the surface of Ag NPs. Considering that the PL spectrum strongly depends on excitation photon energy, we first measured the absorption, PL, and PLE spectra of RhB in solution to determine the excitation wave length. As shown in Fig. 11(a), the PLE spectrum was found essentially superposed with the absorption, and the maximum PLE at 554 nm partially overlapped with PL emission, thus the excitation light for PL measurement was set at the wave length of 500 nm. Similar RhB PL spectra on the pure TiO2 films were obtained and the PL intensity did not obviously depend on the thickness of fluorophore layer, as shown in the inset of Fig. 11(a), in which the RhB PL spectra of the samples with different thick fluorophore layers are presented. Compared to the RhB fluorescence on the pure TiO2 films, the PL intensity of RhB on the Ag–TiO2 films was enhanced and the enhancement strongly depends on the growth time of Ag NPs, as shown in Fig. 11(b). Using the RhB PL spectra on the pure TiO2 as the reference, the enhancement factor (EFPL) was determined to be 1.5–6.9, as shown in the inset of Fig. 11(b). The enhancement is consistent with the measurement for the other fluorophore on the silver island films. Reference Lakowicz, Geddes, Gryczynski, Malicka, Gryczynski, Aslan, Lukomska, Matveeva, Zhang, Badugu and Huang31
(a) Absorption, PL, and PLE spectra of RhB solution. The PL spectrum was excited by 330 nm light and the PLE spectrum was detected at 578 nm. The inset shows RhB PL spectra on pure TiO2 films. (b) RhB PL spectra on Ag–TiO2 films that were grown in 180 mg/L AgNO3 solution at the given growth time.
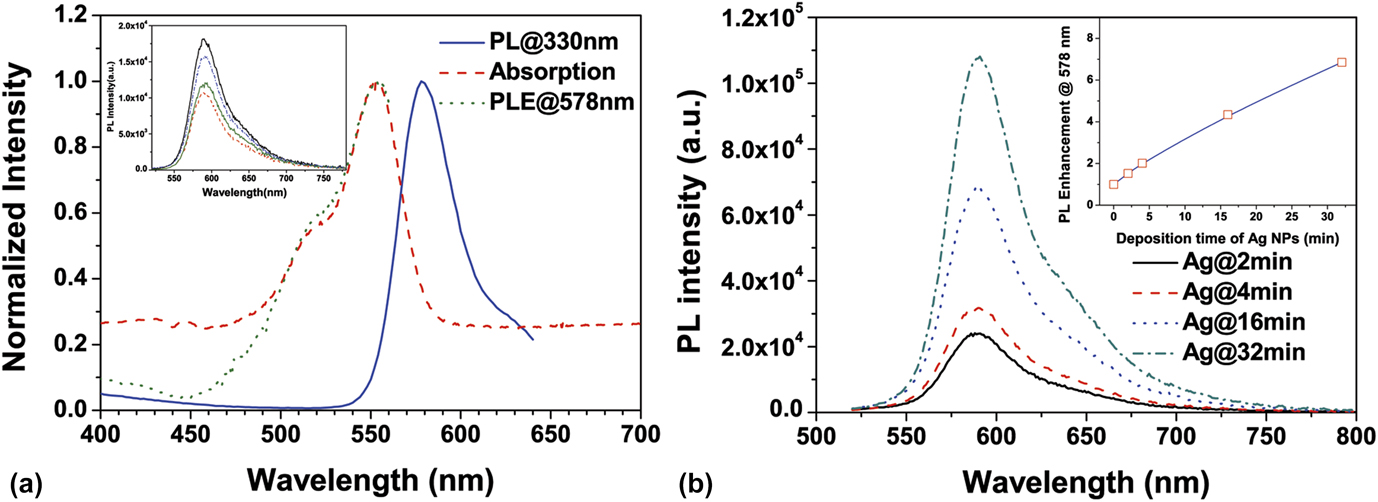
Fluorescence enhancement results primarily from two processes, an increase of the localized electromagnetic fields near the metal NPs and an increase of radiative decay rate. Reference Lakowicz32 Thus, EFPL = G exc × G QY, where G exc is the enhancement of the localized electromagnetic field, and G QY is the increase in quantum yield of the fluorophore, which can be estimated with the PL lifetime. For the RhB molecules on the pure TiO2 films, the determined average lifetime was 0.63 ± 0.14 ns. The RhB PL lifetime on the Ag–TiO2 films was found to be 0.35–0.58 ns and did not obviously depend on the growth time of Ag NPs. Considering that the quantum yield of a fluorophore in solid cannot exceed a few percents, G QY was estimated smaller than 2. Thus, the localized electromagnetic field and/or the increased scattering of the Ag–TiO2 films play an important role in the PL enhancement of RhB besides the increase in quantum yield. In addition, the increased roughness of the Ag–TiO2 film by deposition time might result in larger surface area allowing more dye molecules located in the near field of the Ag nanostructures, thus leading to more enhancement of PL intensity.
IV. CONCLUSIONS
Growth dynamics of Ag NPs by photocatalytic reduction is critical for isotropic and anisotropic growth of Ag NPs, depending on the AgNO3 solution concentration and the reduction ability of TiO2 films. For the photocatalytic growth of Ag NPs on the TiO2 films under the given UV irradiation in this study, a critical AgNO3 concentration in between 300 and 400 mg/L is determined for the transition from isotropic growth to anisotropic growth. In the solutions lower than the critical concentration, the isotropic growth is the predominant mechanism that leads to the formation of irregularly spherical Ag NPs. In the solutions higher than the critical concentration, the increased reduction rate promotes the formation of Ag nanoplates in the product. Nucleation of Ag primary particles was demonstrated taking place as soon as in a time scale of <1 s after the beginning of photocatalysis. By taking the diffusion of Ag atoms into consideration, a photocatalytic growth model was proposed and the primary particle density was suggested, which plays a decisive role in the formation of Ag nanoplates. OR dominates the isotropic growth of Ag NPs for the low-density primary particles and OA growth is the mechanism responsible for the formation of Ag nanoplates when the density of primary particles is high. The plasmonic properties of Ag–TiO2 films with Ag nanoplates are a little different from those of Ag–TiO2 films with irregularly spherical Ag NPs. For the Ag–TiO2 films with irregularly spherical Ag NPs, the maximum enhancement factors were determined to be 1 × 10⁶ and 6.9 for SERS and fluorescence, respectively. The enhancement of localized electromagnetic fields near the surface of Ag NPs is demonstrated to be responsible for the enhancement.
Supplementary Material
To view the supplementary material for this article, please visit http://dx.doi.org/jmr.2014.378.
ACKNOWLEDGMENTS
One of the authors, K. Liu, thanks the support from Science and Technology Project Fund of Liaoning Province under Grant No. 2013231005 and Fundamental Research Funds for the Central Universities of China under Grant No. DUT13LK21.