Introduction
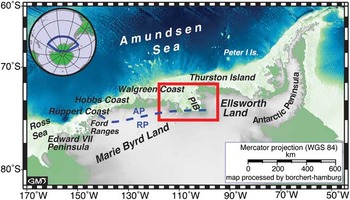
Coastal West Antarctica (Fig. 1) consists of three major crustal blocks, Marie Byrd Land (MBL), Thurston Island and the Antarctic Peninsula (e.g. Vaughan & Storey Reference Vaughan and Storey2000). The Thurston Island block is separated from the MBL block by Pine Island Bay, and from the Antarctic Peninsula block by Eltanin Bay and Ronne Entrance. Whether the deep glacial troughs of both embayments follow the block boundaries, is still unknown. Until 90–83 Ma, West Antarctica formed part of the Gondwana supercontinent along with Zealandia and Australia. The conjugate margins of West Antarctica and Zealandia are key locations for understanding processes that cause supercontinent breakup. Whereas reasonably comprehensive Cretaceous geological datasets and syntheses exist for Zealandia (e.g. Tulloch & Kimbrough Reference Tulloch and Kimbrough2003, Tulloch et al. Reference Tulloch, Ramezani, Mortimer, Mortensen, van den Bogaard and Maas2009), Marie Byrd Land (e.g. Weaver et al. Reference Weaver, Adams, Pankhurst and Gibson1992, Reference Weaver, Storey, Pankhurst, Mukasa, DiVenere and Bradshaw1994, Pankhurst et al. Reference Pankhurst, Weaver, Bradshaw, Storey and Ireland1998, Storey et al. Reference Storey, Leat, Weaver, Pankhurst, Bradshaw and Kelley1999, Mukasa & Dalziel Reference Mukasa and Dalziel2000) and the Antarctic Peninsula (e.g. Leat et al. Reference Leat, Scarrow and Millar1995, Wareham et al. Reference Wareham, Millar and Vaughan1997, Vaughan & Storey Reference Vaughan and Storey2000), much less is known about the Thurston Island block because of more remote access and greater ice sheet coverage.
Overview map of West Antarctica. The red box indicates the map area shown in Fig. 2, the dashed blue line marks the boundary between Amundsen Province (AP) and Ross Province (RP) after Pankhurst et al. (Reference Pankhurst, Weaver, Bradshaw, Storey and Ireland1998). Map based on ETOPO 1-minute grid (Smith & Sandwell Reference Smith and Sandwell1997). PIB = Pine Island Bay.

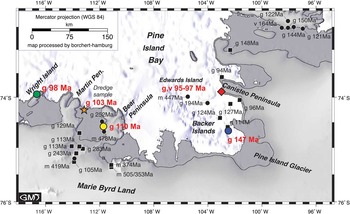
During RV Polarstern expedition ANT-XXIII/4 to the Amundsen Sea embayment in 2006, several ice-free basement outcrops were visited along the coast of easternmost MBL and on small islands in Pine Island Bay that are part of the Thurston Island block (Fig. 2). In the course of this expedition, four of these outcrops were surveyed and sampled using small boat and helicopter support. Subsequently dredge material from a fifth location was obtained. In this paper, we report results of Ar-Ar laser method radiometric dating and geochemical analyses of the recovered plutonic and dyke rocks. The data and results presented in this study contribute to the small but growing geological understanding of this part of the Antarctic margin.
Overview map of the Walgreen Coast and Pine Island Bay area. RV Polarstern expedition ANT-XXIII/4 sampling sites of the igneous basement are marked by coloured symbols (the same coloured symbols are used in subsequent figures). Bold red numbers indicate Ar-Ar ages presented in this study, small black numbers published age data from Pankhurst et al. (Reference Pankhurst, Millar, Grunow and Storey1993, Reference Pankhurst, Weaver, Bradshaw, Storey and Ireland1998) and Mukasa & Dalziel (Reference Mukasa and Dalziel2000). U-Pb ages are marked by black squares. Letters indicate rock types which have been dated (g = granitoids, m = metamorphic rocks, v = volcanic rocks). Map based on ETOPO 1-minute grid (Smith & Sandwell Reference Smith and Sandwell1997).

Geological and tectonic setting
Geological knowledge of the Pine Island Bay area (Fig. 2) is based on early reconnaissance mapping along the coast by, for example, Craddock et al. (Reference Craddock, Bastien and Rutford1964) and later geochronological and geochemical sampling by Leat et al. (Reference Leat, Storey and Pankhurst1993), Pankhurst et al. (Reference Pankhurst, Millar, Grunow and Storey1993, Reference Pankhurst, Weaver, Bradshaw, Storey and Ireland1998) and Mukasa & Dalziel (Reference Mukasa and Dalziel2000). This work has shown that episodic I-type subduction-related plutonism and volcanism occurred from the Permian to the Early Cretaceous throughout the Pine Island Bay-Thurston Island area, and that minor older gneissic basement is also present. The West Antarctica coastline provides a very oblique cross section across the Mesozoic-Paleozoic orogenic belts of Gondwana. Pankhurst et al. (Reference Pankhurst, Weaver, Bradshaw, Storey and Ireland1998) divided MBL into two geological provinces, Ross Province in the west and Amundsen Province in the east, with the boundary at c. 140°W (Fig. 1). The Amundsen Province (which includes Pine Island Bay), is a Permian to Mesozoic Gondwana-margin batholithic belt that is spatially continuous with the Pacific Margin Magnetic Anomaly of Maslanyj & Storey (Reference Maslanyj and Storey1990), the Antarctic Peninsula Batholith of Leat et al. (Reference Leat, Scarrow and Millar1995) and the Central Domain of Vaughan & Storey (Reference Vaughan and Storey2000). Prior to Gondwana breakup the batholith also continued into the Median Batholith of New Zealand (Pankhurst et al. Reference Pankhurst, Weaver, Bradshaw, Storey and Ireland1998).
Several studies have addressed the age of cessation of subduction-related magmatism in West Antarctica. In MBL, a 124–108 Ma suite of calc-alkalic, metaluminous I-type granitoids reflects the final stage of subduction prior to its cessation beneath the Zealandia/West Antarctic Gondwana margin (e.g. Bradshaw Reference Bradshaw1989, Weaver et al. Reference Weaver, Storey, Pankhurst, Mukasa, DiVenere and Bradshaw1994). According to Weaver et al. (Reference Weaver, Storey, Pankhurst, Mukasa, DiVenere and Bradshaw1994), subduction ceased at 105 Ma in western MBL (Ruppert and Hobbs coasts). The onset of intracontinental rifting in western MBL is clearly indicated by 102–95 Ma alkalic, metaluminous to peralkaline A-type granitoids, which make up about 75% of the exposed rocks at the Ruppert and Hobbs coasts (e.g. Weaver et al. Reference Weaver, Storey, Pankhurst, Mukasa, DiVenere and Bradshaw1994). These interpretations were supported by the western MBL U-Pb study of Mukasa & Dalziel (Reference Mukasa and Dalziel2000) who reported their youngest dated subduction-related I-type pluton to be 110 Ma, A-type plutons to range from 102–98 Ma and rift-related mafic and intermediate dykes to be 101 ± 1 Ma. Siddoway et al. (Reference Siddoway, Baldwin, Fitzgerald, Fanning and Luyedndyk2004) interpreted mylonitic gneisses and granites to be an indication of crustal extension in western MBL at 98–95 Ma.
In eastern MBL (Walgreen Coast to western Pine Island Bay, Fig. 1), which had Chatham Rise between it and the subducting margin, subduction-related I-type magmatism occurred at least until 94 ± 3 Ma (U-Pb zircon date), the implication being that, in MBL, subduction ceased earlier in the west than in the east (Mukasa & Dalziel Reference Mukasa and Dalziel2000). The change from subduction to rifting has been related to forces acting upon the plate margins by interaction of the palaeosubduction zone at the Zealandia/MBL margin of Gondwana with: 1) the Pacific-Phoenix spreading centre (e.g. Bradshaw Reference Bradshaw1989, Luyendyk Reference Luyendyk1995, Mukasa & Dalziel Reference Mukasa and Dalziel2000), 2) the collision of the Hikurangi Plateau with Zealandia (e.g. Bradshaw Reference Bradshaw1989, Davy et al. Reference Davy, Hoernle and Werner2008), and/or 3) the activity of a mantle plume (e.g. Weaver et al. Reference Weaver, Storey, Pankhurst, Mukasa, DiVenere and Bradshaw1994, Storey et al. Reference Storey, Leat, Weaver, Pankhurst, Bradshaw and Kelley1999, Hoernle et al. Reference Hoernle, Hauff, van den Bogaard, Werner, Mortimer, Geldmacher, Garbe-Schönberg and Davy2010). Storey et al. (Reference Storey, Leat, Weaver, Pankhurst, Bradshaw and Kelley1999), for example, claimed to have identified HIMU Pb-isotope signatures (high time-integrated U/Pb-ratios in the source region) in Late Cretaceous mafic alkaline dykes of MBL, which may indicate the involvement of a mantle plume in the final breakup.
Sample background
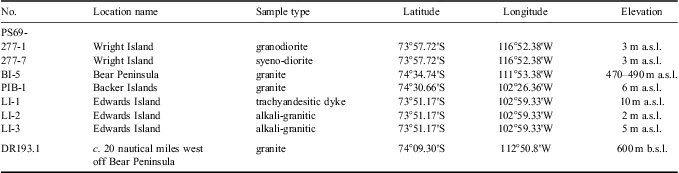
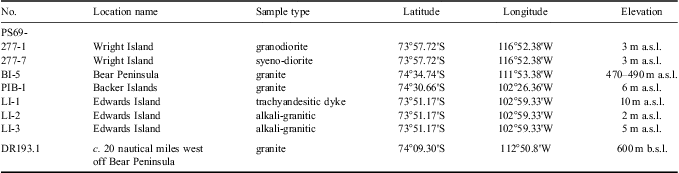
Rock sampling was conducted on Wright Island and Bear Peninsula along the Walgreen Coast and on two islands within Pine Island Bay, an area that has been sampled by earlier expeditions (Fig. 2, Table I). Additionally, a granitic sample (DR 193.1, kindly provided by R.D. Larter, British Antarctic Survey) dredged c. 20 nautical miles west of Bear Peninsula at c. 600 m water depth during RRS James Clark Ross cruise JR141 has been dated for this study, but not geochemically analysed because of the small sample size.
Sample locations.
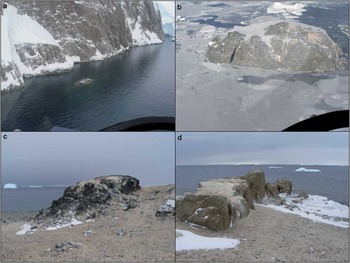
On the north-western coast of Wright Island of the Walgreen Coast, huge cliffs expose outcrops of relatively fine-grained crystalline basement (Fig. 3a, samples PS69/277-1 and -7), cut by several (inaccessible) dykes. Dark biotite-rich inclusions and dykes a few centimetres wide are common at the sampling site. On Bear Peninsula, relatively homogeneous, coarse-grained granitic rocks outcrop c. 490 m above sea level on top of a smooth hill (sample PS69/BI-5). A weakly developed foliation in the granitic rocks, the common occurrence of dark xenoliths (most probably meta-sediment) and intercalated siliceous layers may indicate that this outcrop represents the edge (or roof) of a pluton, probably intruding the gneissic rocks reported and dated by Pankhurst et al. (Reference Pankhurst, Weaver, Bradshaw, Storey and Ireland1998).
Outcrops in the Walgreen Coast and Pine Island Bay area. a. Huge cliffs expose crystalline basement at the north-western coast of Wright Island. Samples PS69/277-1 and -7 were taken from the small island in front of the cliffs. b. Most islands surveyed on cruise ANTXXIII/4 in the Pine Island Bay consist mainly of granitic rocks. c. A porphyritic dyke (sample PS69/LI-1), and d. granitic rocks (samples PS69/LI-2 and -3) on Edwards Island. Note the dyke-like structure of the granitic outcrop.

In Pine Island Bay, Backer Islands (sample PS69/PIB-1) are part of a prominent SE–NW striking island chain, which extends from Ellsworth Land (Evans Knoll) beneath the ice-shelf north of the Pine Island Glacier. These islands mainly consist of granitic rocks and our sample was taken from the southern part of the island chain (Fig. 3b, cf. Mukasa & Dalziel Reference Mukasa and Dalziel2000). In contrast, an island group west of Canisteo Peninsula is marked by a succession of east–west striking dykes, up to a few meters wide. Our field observations on Edwards Island revealed black porphyritic dykes (Fig. 3c, sample PS69/LI-1) alternating with light, holocrystalline granitic rocks (samples PS69/LI-2 and -3). The granitic rocks also show a dyke-like morphology (Fig. 3d), but it is not evident from field observations whether the trachyandesitic dykes intruded into a granitic host rock or all the rocks exposed on Edwards Island are dykes. Radiometric dating (see below) indicates, however, that formation and cooling of the granitic rocks occurred at the same time and after the emplacement of the trachyandesitic dykes. Therefore Edwards Island most probably consists of a succession of trachyandesitic and granitic dykes as suggested by the structure of the outcrops.
Analytical methods
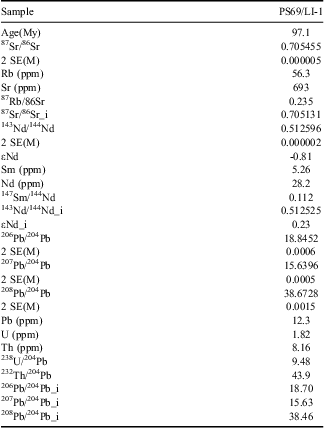
Samples selected for geochemistry were first crushed, then repeatedly washed in de-ionized water and thereafter carefully handpicked under a binocular microscope. Major and trace element data were analysed at SARM (Service d'Analyse des Roches et des Mineraux) laboratories in France. Major elements were determined using an ICP-OES IRIS Advantage ERS - ThermoFisher, trace elements using an ICP-MS X7 - ThermoFisher. Standards BR, DR-N, UB-N, AN-G and GH were used for calibration. For a more detailed description of methods and reference materials see Carignan et al. (Reference Carignan, Hild, Mevelle, Morel and Yeghicheyan2001). The Sr-Nd-Pb isotopic composition of sample PS69/LI-1 was determined at the Helmholtz Centre for Ocean Research Kiel (GEOMAR) by thermal ionization mass spectrometry (TIMS) following the methods outlined in Hoernle et al. (Reference Hoernle, Hauff, van den Bogaard, Werner, Mortimer, Geldmacher, Garbe-Schönberg and Davy2010). Measured and initial isotopic ratios along with standard values are shown in Table II.
Sr-Nd-Pb isotope ratios of sample PS69/LI-1.
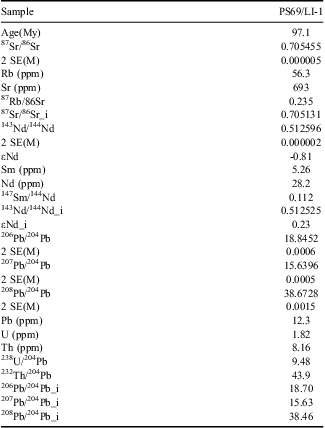
Standards measured along with the sample were normalized and gave 87Sr/86Sr = 0.710250 ± 10 (n = 10, 2σ external) for NBS987 on the MAT262 and 143Nd/144Nd = 0.511850 ± 8 (n = 13, 2σ external) for La Jolla on the TRITON. Pb double-spike corrected values for NBS981 are 206Pb/204Pb = 16.9416 ± 21, 207Pb/204Pb = 15.4996 ± 20 and 208Pb/204Pb = 36.7231 ± 52 (n = 45, 2σ external) on the MAT262 during the period 2006–08 when the data for this sample was acquired. All errors refer to the last significant digit. 2 SE(M) = 2 sigma error of the mean, _i = initial isotopic ratio using the age (Table III) and the trace element concentrations (Table IV) of the sample.
40Ar/39Ar analyses were conducted on biotite and feldspar phenocrysts at the GEOMAR Geochronology Laboratory. The crystals were handpicked from crushed and sieved splits. Feldspar phenocrysts were etched in diluted hydrofluoric acid. All separates were cleaned using an ultrasonic disintegrator.
Minerals were irradiated in aluminium trays with a cadmium lining at the 5MW reactor of the Helmholtz-Zentrum Geesthacht, Centre of Materials and Coastal Research (GKSS). The neutron flux was monitored using Taylor Creek Rhyolite sanidine (TCR-2: 27.87 ± 0.04 Ma, Lanphere & Dalrymple Reference Lanphere and Dalrymple2000). 40Ar/39Ar laser step-heating analyses were carried out with a 20W SpectraPhysics Argon-Ion laser and an MAP 216 series noble gas mass spectrometer. Argon isotope ratios were corrected for mass discrimination, background and blank values, J-value gradients, and interfering neutron reactions on Ca and K.
Step-heating results are plotted in age spectra (apparent age and error vs cumulative 39Ar). Statistical plateaus are defined as more than three consecutive steps comprising > 50% of the 39Ar released, with ages overlapping within 2σ errors.
36Ar/39Ar ratios (biotite, K-feldspar) and 36Ar/37Ar ratios (plagioclase), both corrected for neutron reactions on Ca and normalized to J = 0.01, are monitored to assess the variable degree of alteration of the samples (Baksi Reference Baksi2007) and heating steps with excessively high alteration indices are excluded from plateau age calculations. Plateau ages represent the inverse-variance weighted mean of the (accepted) plateau steps ages and errors (2σ). Statistical robustness of plateaus and plateau ages are tested by the MSWD (mean square weighted deviates) and probability of fit (which should be > 0.05 at 2σ/95% confidence levels) (Baksi Reference Baksi2007 and references therein).
Results
Petrography and classification
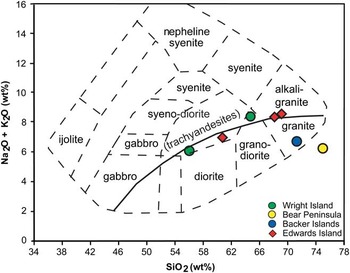
All sampled plutonic rocks are coarse-grained, (equi-) granular, holocrystalline, leucocratic granitoids. They range from medium-K syeno-diorites and high-K granodiorites on Wright Island to subalkaline (medium-K) granites on Bear Peninsula and Backer Islands (Fig. 4). Major constituents are quartz, alkali feldspar and zoned plagioclase. Other common mineral phases are hornblende, apatite, titanomagnetite, and biotite, while muscovite occurs rarely. Amphibole is restricted to the granites. The porphyritic dyke sample PS69/LI-1 from Edwards Island is a trachyandesite (micro-syenodiorite) with a glomerophyric texture. Large feldspar phenocrysts (up to 5 mm) occur in a fine-grained matrix, which mainly consists of plagioclase, hornblende, and titanomagnetite. The other rocks sampled on Edwards Island are evolved, holocrystalline alkali-granitic rocks. Major mineral phases are quartz, sanidine, plagioclase and biotite. Hornblende, muscovite, nepheline, apatite, and titanomagnetite are minor components.
Classification of the samples from Walgreen Coast and Pine Island Bay. The solid line marks the subdivision between alkalic and subalkalic rocks. All samples show evolved subalkalic or slightly alkalic compositions. The porphyritic dyke rock sampled on Edwards Island falls into the field for trachyandesites. All analyses have been normalized to a volatile free total of 100%.

The samples from Wright Island and Bear Peninsula do not show any signs of alteration, whereas the granitic rocks from Backer and Edwards islands show minor alteration of feldspars to secondary calcite and chlorite. The trachyandesite from Edwards Island is slightly altered (minor calcite replacement of some phenocrysts).
Ar-Ar laser method dating
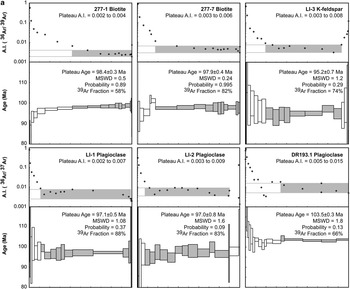
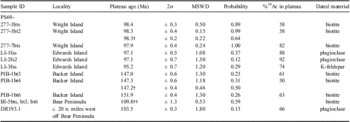
40Ar/39Ar step-heating results are summarized in Table III, age, alteration index spectra are shown in Fig. 5, and full analytical data are given in Table S1 (http://dx.doi.org/10.1017/S0954102012000259).
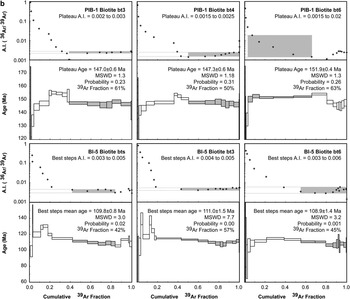
Age spectra and alteration indices (A.I.) from 40Ar/39Ar laser step-heating experiments. Plateau steps and corresponding range of alteration index values are accentuated by grey shading. Error bars are ± 2σ.

continued

Results of step-heating 40Ar/39Ar analyses.

†Weighted mean of plateau ages.
††Weighted mean of “best step” averages.
Two biotite step-heating analyses from Wright Island granodiorite sample 277-1 yield plateau ages of 98.4 ± 0.3 Ma and 98.3 ± 0.4 Ma. 36Ar/39Ar alteration indices are reasonably low in the high temperature plateau sections (0.002–0.007), but up to three orders of magnitude higher in the low temperature heating steps (excluded from plateau). Plateau age results are identical within error, thus a weighted mean age of 98.3 ± 0.2 Ma (2σ, MSWD = 0.22, probability = 0.64) was calculated for sample 277-1.
Biotite step-heating of Wright Island syeno-diorite sample 277-7 yields a slightly younger plateau age of 97.9 ± 0.4 Ma. Plateau step alteration indices indicate degassing from little-altered sites (36Ar/39Ar = 0.003–0.006). Small low temperature fractions (< 18% 39Ar) yield higher alteration indices (0.01–10) and lower apparent ages due to a loss of radiogenic 40Ar during alteration.
Plagioclase feldspar step-heating of Edwards Island trachyandesite dyke LI-1 yields a plateau age of 97.1 ± 0.5 Ma. 36Ar/37Ar ratios are reasonably low in the high temperature plateau section (0.002–0.007), but gradually higher in the lower temperature heating steps (0.01–1.7) indicating partial alteration (steps 1–7, excluded from plateau).
Plagioclase from Edwards Island alkali-granitic rock sample LI-2 yields similar results. Alteration is low in the plateau steps (36Ar/37Ar = 0.003–0.009), which yield a plateau age of 97.1 ± 0.7 Ma. Lower temperature steps degassed more altered sites (36Ar/37Ar = 0.02–2.4), and thus are rejected from the plateau. K-feldspar (anorthoclase?) step-heating of Edwards Island alkali-granite sample LI-3 yields a plateau age of 95.2 ± 0.7 Ma (36Ar/39Ar = 0.003–0.008). Both the lowest and highest temperature steps show significantly higher alteration (36Ar/39Ar = 0.01–2.2) and are rejected from the plateau age calculation.
Six step-heating analyses were carried out on biotite from Backer Islands granite sample PIB-1, three of which yielded disturbed spectra without significant (> 50% 39Ar) plateaus. Two analyses yield high temperature plateaus at 147.0 ± 0.6 Ma (PIB-1bt3) and 147.3 ± 0.6 Ma (PIB-1bt4) with acceptable alteration indices in the plateau steps (0.002–0.003). Significant alteration in the low temperature spectrum result in apparent ages significantly lower (due to radiogenic 40Ar loss?) and apparent ages significantly higher (due to recoil 39Ar loss?) than the plateau ages.
Analysis PIB-1bt6 yields a low temperature plateau at 151.9 ± 0.4 Ma, but alteration indices up to 0.02 clearly show that this plateau includes degassing from altered sites. Seven high temperature steps with low alteration indices (0.002–0.003) yield apparent ages around 147 Ma again. This indicates that the low temperature plateau is in fact a pseudo-plateau possibly derived from a “balanced” loss of radiogenic 40Ar and recoiled 39Ar. The biotite 40Ar/39Ar age of granite PIB-1 is determined as 147.2 ± 0.4 Ma (MSWD = 0.46, probability = 0.5) from the weighted mean of the bt3 and bt4 plateau age results.
Three step-heating analyses of biotite from Bear Peninsula granite sample BI-5 (bts, bt3 & bt6) yield disturbed spectra. None of the analyses shows a significant plateau (> 50% 39Ar). All show effects of significant alteration, such as high 37Ar/39Ar ratios > 0.02 indicating the presence of alteration products (chlorite, epidote) in the biotite crystals (Baksi Reference Baksi2007), and high 36Ar/39Ar ratios indicating substantial uptake of 36Ar, probable loss of radiogenic 40Ar during alteration, and possible recoil loss of 39Ar during irradiation. The least altered high temperature degassing steps show acceptable alteration indices ranging from 0.003–0.006, comprise only 42% (bts), 57% (bt3), and 45% (bt6) of the 39Ar released, and yield mean ages identical within 2σ uncertainties/95% confidence levels (109.8 ± 0.8 Ma, 111.0 ± 1.5 Ma, 108.9 ± 1.4 Ma). High MSWD (≥ 3) and low probability (P << 0.05) indicate excess scatter and presence of geological error. The weighted mean of these three “best steps averages” is 109.8 ± 1.3 Ma (MSWD = 0.53, probability = 0.59) and considered our best estimate for the biotite 40Ar/39Ar age of Bear Peninsula granite BI-5.
Plagioclase step-heating of granite sample DR193.1, dredged c. 20 nautical miles west of Bear Peninsula, yields a high temperature plateau at 103.5 ± 0.3 Ma. 36Ar/37Ar ratios of the low temperature heating steps (0.01–1.0) and plateau steps (0.005–0.02) indicate partial alteration of the plagioclase crystals. The sample may have experienced minor loss of radiogenic 40Ar, and its age estimate may therefore be a few percent too low.
The biotite and plagioclase 40Ar/39Ar ages of the Pine Island Bay granites and diorites (277-1, 277-7, PIB-1, BI-5, DR193.1) approximate the time that passed since cooling below closure temperatures (c. 300–200°C; McDougall & Harrison Reference McDougall and Harrison1999, Cassata et al. Reference Cassata, Renne and Shuster2009), and may post-date the time of emplacement and crystallization by several million years. We note, however, that there is a reasonable match between our 40Ar/39Ar ages and the published U-Pb ages (see Discussion), indicating that the 40Ar/39Ar ages approximate to intrusion ages and are not just a spread of cooling ages. In case of the more rapidly cooled Pine Island Bay trachyandesitic and granitoid dykes (LI-1, LI-2, LI-3), the plagioclase and K-feldspar 40Ar/39Ar ages closely reflect the time of cooling and emplacement.
Geochemistry
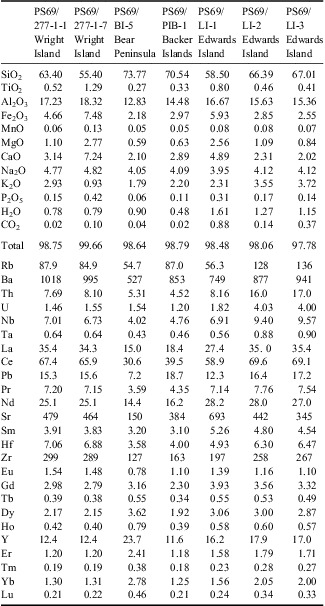
Major and trace element data of all studied samples (except DR193-1) are given in Table IV. The samples from Backer Islands and Bear Peninsula are highly fractionated with SiO2 = 71–75 wt % and Fe2O3 = 2–3 wt %, whereas the Wright Island samples show more intermediate compositions with SiO2 = 56–64 wt % and Fe2O3 = 5–8 wt %. The granitic Edwards Island dykes show evolved compositions with SiO2 = 68.7 wt % and 68.6 wt %, the trachyandesitic dyke has SiO2 = 59.6 wt % and MgO = 2.6 wt %. All samples are metaluminous.
Results of major and trace element analyses.

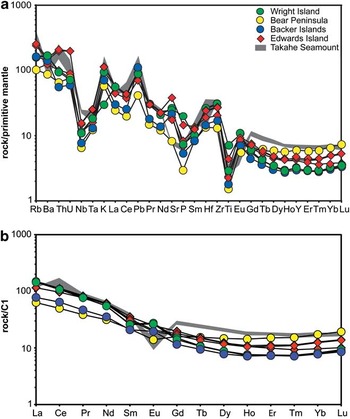
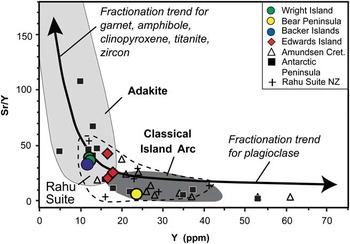
All analysed samples display multi-element patterns similar to I-type subduction-related rocks with the characteristic depletion in Nb and Ta and enrichment in fluid-mobile elements Rb, Ba, U, Pb, Sr and K (Fig. 6a). The high concentrations in incompatible elements and the pronounced depletion in Ti reflect the evolved nature of the rocks. Negative anomalies of Nb, Ta, and in part in Ti may be caused by residual rutile during melting. The decrease in Fe2O3 and TiO2 with increasing SiO2 in the samples, however, also indicates fractionation of Fe-Ti oxides. The negative P anomaly indicates fractionation of apatite. Their rare earth element patterns (Fig. 6b) reveal enrichment in light rare earth element (LREE) and relatively flat heavy rare earth element (HREE) patterns. The slight concave shape in the HREE patterns with relative depletion in Dy, Ho, Er, Tm relative to Yb, Lu, Tb and lighter REEs could reflect amphibole and/or apatite fractionation. A distinct negative Eu anomaly, as is commonly observed for evolved plutonic rocks from Marie Byrd Land and Ellsworth Land (e.g. Weaver et al. Reference Weaver, Adams, Pankhurst and Gibson1992) reflecting plagioclase fractionation, does not appear in the multi-element patterns of the MBL samples analysed in this study. A lack of a significant negative Eu anomaly in arc rocks is considered to be a characteristic feature of adakites (Defant & Drummond Reference Defant and Drummond1990). Several further geochemical features of most of our samples may point to a weakly adakitic composition as, for example, high SiO2 (≥ 56 wt %) and Al2O3 (≥ 15 wt %), low < 3% MgO (Fig. 6), low Nb and Ta (Fig. 6a), and low HREE (e.g. Y and Yb, Figs 6 & 7). We note, however, that most of these features could also be caused by plagioclase accumulation which is common in arc magmas.
Multi-element diagram normalized to primitive mantle (after Hofmann Reference Hofmann1988) and rare earth element (REE) diagram normalized to chondrites (after McDonough & Sun Reference McDonough and Sun1995) for the Walgreen Coast and Pine Island Bay rocks. The 97 Ma granites of Takahe Seamount (Mortimer et al. Reference Mortimer, Hoernle, Hauff, Palin, Dunlop, Werner and Faure2006) are shown for reference. Note the distinct Eu anomaly for the A-type Takahe granites.

Our whole rock geochemical data are the first such published analyses from Pine Island Bay and add to the Walgreen Coast and Thurston Island datasets of Pankhurst et al. (Reference Pankhurst, Millar, Grunow and Storey1993, Reference Pankhurst, Weaver, Bradshaw, Storey and Ireland1998).
Discussion
Petrogenesis
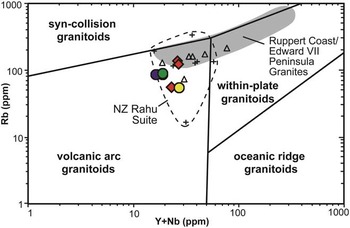
The range of rock types, along with major and trace element contents and ratios, support an origin for our analysed Pine Island Bay granitoids in a subduction-related setting (Fig. 8).
Y+Nb vs Rb tectonic discrimination diagram for granitoids after Pearce et al. (Reference Pearce, Harris and Tindle1984). The basement samples yielded on RV Polarstern ANT XXIII/4 cruise fall into the field for volcanic arc granitoids, consistent with a subduction setting for these rocks. Field for granites from Edward VII Peninsula and Ruppert Coast is based on published data from Weaver et al. Reference Weaver, Adams, Pankhurst and Gibson1992 and Pankhurst et al. Reference Pankhurst, Weaver, Bradshaw, Storey and Ireland1998. Symbols as in Fig. 7.

Except for the granite from Bear Peninsula, all of our samples show slightly elevated high Sr/Y ratios (Fig. 7). In this regard they are similar to the moderate Sr/Y 105–120 Ma Rahu Suite granites of New Zealand and also to sodic Cretaceous granites from the Antarctic Peninsula Batholith (Wareham et al. Reference Wareham, Millar and Vaughan1997). It is noteworthy that the entire MBL to Antarctic Peninsula part of the Cretaceous Gondwana margin lacks true adakitic and/or high Sr/Y suites such as those that dominate Zealandia's Median Batholith in the time interval 105–130 Ma (Tulloch & Kimbrough Reference Tulloch and Kimbrough2003).
Y vs Sr/Y discrimination diagram after Defant & Drummond (Reference Defant and Drummond1990) reveals a weak adakitic composition of most Walgreen coast and Pine Island Bay samples. Only the granite sampled on Bear Peninsula falls into the fields for “classical” arc compositions. Previously published data from Cretaceous granitoids from the Amundsen suite (Pankhurst et al. Reference Pankhurst, Millar, Grunow and Storey1993, Reference Pankhurst, Weaver, Bradshaw, Storey and Ireland1998), the Cretaceous New Zealand Rahu Suite (Tulloch & Kimbrough Reference Tulloch and Kimbrough2003) and Cretaceous sodic granites from the Antarctic Peninsula (Wareham et al. Reference Wareham, Millar and Vaughan1997) are shown for reference. Field for adakites and fractionation trends after Richards & Kerrick (Reference Richards and Kerrick2007).

The moderately enriched Sr-Nd-Pb isotopic composition of the 97 Ma trachyandesite dyke sample PS69/LI-1 from Edwards Island (Table II) could either reflect derivation from a metasomatized mantle wedge source (possibly by melts from subducted marine sediments), or contamination of mantle derived melts by continental crust during ascent and prolonged crustal residence. In either case no evidence is found for the presence of a high μ (μ = 238U/204Pb) (HIMU) component in the source of the melt, as reported for Late Cretaceous mafic dykes in MBL by Storey et al. (Reference Storey, Leat, Weaver, Pankhurst, Bradshaw and Kelley1999).
Age-composition patterns
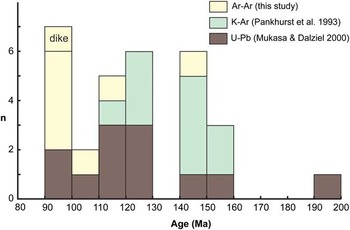
Our combined age and geochemical data indicate that Mesozoic continental arc magmatism occurred at least from c. 150 Ma until 95 Ma along the Walgreen Coast and in the Pine Island Bay area, consistent with previously published U-Pb and K–Ar ages of I-type granitoids (Fig. 9, Mukasa & Dalziel Reference Mukasa and Dalziel2000). Notably, there seems to be a peak in magmatic activity between c. 100 and 95 Ma, indicated by the closure temperatures of biotites from granitoids on Wright Island (98 Ma), U-Pb ages of granitoids from “McKenzie islands” (96 Ma) and Lindsey Island (94 Ma) (Mukasa & Dalziel Reference Mukasa and Dalziel2000), and the rapidly cooled dykes on Edwards Islands (95 and 97 Ma, respectively). Interestingly, this peak is within the age range of the Lassiter Coast Intrusive Suite in the southern Antarctic Peninsula (Flowerdew et al. Reference Flowerdew, Millar, Vaughan and Pankhurst2005). We cannot exclude, however, the possibility that this peak reflects a sampling and/or cooling bias of this poorly mapped and lightly sampled area.
Histogram comparing ages of Jurassic and Cretaceous I-type plutons in the Thurston Island-Pine Island Bay area. The youngest dated Mesozoic rock in the Pine Island Bay area (Fig. 2) is 94 Ma (U-Pb zircon by Mukasa & Dalziel Reference Mukasa and Dalziel2000).

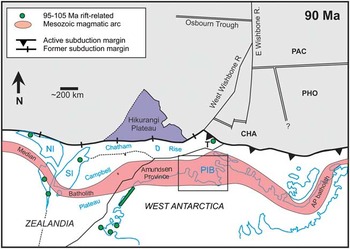
The persistence of I-type magmatism to c. 95 Ma differs significantly from the seemingly abrupt change from I-type to A-type magmatism at 107–101 Ma along the Ruppert Coast of western MBL (Storey et al. Reference Storey, Leat, Weaver, Pankhurst, Bradshaw and Kelley1999, Mukasa & Dalziel Reference Mukasa and Dalziel2000). It also differs from the situation in Zealandia where three pulses of I/A-type volcanism occurred at c. 101, c. 97 and c. 85 Ma with A-type character increasing with time (Tulloch et al. Reference Tulloch, Ramezani, Mortimer, Mortensen, van den Bogaard and Maas2009). Tulloch et al. (Reference Tulloch, Ramezani, Mortimer, Mortensen, van den Bogaard and Maas2009) interpreted the onset of the earliest A-type magmatism at 101 Ma to indicate the initial absence of a slab beneath Zealandia, and relate the decreasing degree of I-type geochemical characteristics in the younger suites to decreasing crustal contamination due to progressive crustal thinning. While no Cretaceous A-type igneous rocks have thus far been reported from sites east of Ruppert Coast, we note that the 97 Ma Takahe A-type granite reconstructs to a position close to the western tip of Thurston Island (Fig. 10) (Mortimer et al. Reference Mortimer, Hoernle, Hauff, Palin, Dunlop, Werner and Faure2006). In the Antarctic Peninsula Batholith, Leat et al. (Reference Leat, Scarrow and Millar1995) noted that the most intense period of intermediate composition I- and IS-type magmatism was 142–97 Ma. They alluded to the existence of some < 97 Ma alkaline igneous complexes but, unlike for Zealandia (Tulloch et al. Reference Tulloch, Ramezani, Mortimer, Mortensen, van den Bogaard and Maas2009), these have not been interpreted as having any major regional tectonic significance for Gondwana margin tectonics.
Reconstruction of Zealandia and West Antarctica at 90 Ma, combining features from Eagles et al. (Reference Eagles, Gohl and Larter2004), and Mortimer et al. (Reference Mortimer, Hoernle, Hauff, Palin, Dunlop, Werner and Faure2006). Note the wide zone of the magmatic arc in eastern Marie Byrd Land (MBL), possibly due to crustal extension after the Hikurangi Plateau-Chatham Rise collision and cessation of the subduction. The rectangle indicates the map area of Fig. 2 (NI = North Island of New Zealand, SI = South Island, T = Takahe Seamount, PIB = Pine Island Bay, PAC = Pacific Plate, PHO = Phoenix Plate, CHA = Charcot Plate).

Cretaceous geodynamics
The subduction-related I-type granitoids of Pine Island Bay are c. 500 km south of the present-day continent-ocean margin. No arc-trench gaps of this size exist today (Jarrard Reference Jarrard1986). Between 100–200 km of this distance can be accounted for by post-subduction stretching of West Antarctica crust (Eagles et al. Reference Eagles, Gohl and Larter2004). Arc-trench gaps of c. 300 km are observed in many modern day continental arcs (Jarrard Reference Jarrard1986), and flat-slab subduction models have been proposed for the early Cretaceous Gondwana margin (Tulloch & Kimbrough Reference Tulloch and Kimbrough2003).
Metamorphic core complexes and A-type granites developed in Zealandia and western MBL in the interval 100–85 Ma (Siddoway et al. Reference Siddoway, Baldwin, Fitzgerald, Fanning and Luyedndyk2004, Tulloch et al. Reference Tulloch, Ramezani, Mortimer, Mortensen, van den Bogaard and Maas2009 and references therein). According to Eagles et al. (Reference Eagles, Gohl and Larter2004), a first phase of extension in the Zealandia/MBL region can be related to the establishment of a proto-Pacific-Antarctic plate boundary in the Bounty Trough and Great South Basin east and south-east of New Zealand South Island, resulting in considerable thinning of the continental lithosphere (Grobys et al. Reference Grobys, Gohl and Uenzelmann-Neben2009 and references therein). This rift-phase led to the separation of the Chatham Rise from eastern MBL just after 90 Ma (Eagles et al. Reference Eagles, Gohl and Larter2004). At c. 84 Ma the locus of rifting shifted to the boundary between the south-east margin of Campbell Plateau and the MBL margin, followed by sea floor spreading along the Pacific–Antarctic Ridge and the ultimate separation of Zealandia from Antarctica (Eagles et al. Reference Eagles, Gohl and Larter2004). Evidence for crustal extension on the eastern MBL side can be found on the broad continental shelf of the Amundsen Sea embayment where geophysical data reveal a 22–24 km thin crust, and dominant magnetic lineaments are interpreted as rift-related mafic intrusions, parallel to the Pacific-Antarctic spreading axis (Gohl et al. Reference Gohl, Teterin, Eagles, Netzeband, Grobys, Parsiegla, Schlüter, Leinweber, Larter, Uenzelmann-Neben and Udintsev2007, Gohl in press). It is possible that continental rifting, which is associated with the West Antarctic Rift System, not only played a role in Ellsworth Land and its continental margin (Müller et al. Reference Müller, Gohl, Cande, Goncharov and Golynsky2007) but also affected the eastern MBL and Amundsen Sea embayment region (Jordan et al. Reference Jordan, Ferraccioli, Vaughan, Holt, Corr, Blankenship and Diehl2010, Reference GohlGohl in press).
The role of the Hikurangi Plateau in all this remains uncertain. The time of collision of the plateau with the Gondwana margin cannot be independently established but can only be inferred to be in the range of 105–65 Ma from continental geology (Mortimer et al. Reference Mortimer, Hoernle, Hauff, Palin, Dunlop, Werner and Faure2006). This leads to circular arguments about cause and effect. The presence of alkalic HIMU-type volcanism on the Hikurangi Plateau and on the South Island of New Zealand beginning between 100 and 95 m.y. ago, however, suggests that the Hikurangi Plateau had already collided or was close to Zealandia by this time (Hoernle et al. Reference Hoernle, Hauff, van den Bogaard, Werner, Mortimer, Geldmacher, Garbe-Schönberg and Davy2010). Many aspects of the geology of the Gondwana margin (cessation of subduction, inception of rifting, slab windows) can equally be explained by subduction of a spreading ridge (Bradshaw Reference Bradshaw1989, Tulloch et al. Reference Tulloch, Ramezani, Mortimer, Mortensen, van den Bogaard and Maas2009).
The present-day continental margin of the Amundsen Sea embayment and off the Walgreen Coast is not the old Gondwana subduction zone, but a Cretaceous rift margin, facing the currently active Pacific–Antarctic Ridge (Eagles et al. Reference Eagles, Gohl and Larter2004, Gohl et al. Reference Gohl, Teterin, Eagles, Netzeband, Grobys, Parsiegla, Schlüter, Leinweber, Larter, Uenzelmann-Neben and Udintsev2007, Gohl in press). The extrapolation of oceanic crustal age from observed spreading anomaly 34y (83 Ma) in the south-eastern Amundsen Sea towards the continent-ocean boundary of easternmost MBL results in an oldest estimated oceanic age of c. 90 Ma (Eagles et al. Reference Eagles, Gohl and Larter2004). This means that the eastern MBL region experienced a short rift phase of < 5–7 m.y., before the subduction arc of the hinterland was converted to a Late Cretaceous passive margin.
Acknowledgements
We are grateful to Captain Pahl, the ship and helicopter crews, and shipboard scientific party for their excellent support during RV Polarstern cruise ANT-XXIII/4. S. Hauff and J. Sticklus are thanked for technical assistance, and W. Borchert for creating Figs 1 & 2. Robert D. Larter kindly provided the dredge sample DR193.1. Discussions with Maxim Portnyagin, Jan Grobys, Graeme Eagles, Andreas Veit, and Christian Timm helped significantly to develop this paper. Comments on earlier versions of the manuscript by Phil Leat, Christine Siddoway, Alan Vaughan and an anonymous reviewer are appreciated. The German Research Foundation (DFG, grants HO1833/15-1 to -3 to KH and FH) and the New Zealand Ministry of Science and Innovation funded this research.
Supplemental material
A supplemental table will be found at http://dx.doi.org/10.1017/S0954102012000259.