I. INTRODUCTION
Since the discovery of colossal magnetoresistance (CMR) in perovskite manganese oxides Re1−x A x MnO3 (where Re is a trivalent rare-earth element such as La, Pr, and Nd and A is a divalent metal element such as Ca, Sr, Ba, or Pb), much theoretical and experimental work has been done to investigate the physical mechanism of the CMR effect because of their interesting physical properties and technological importance. Reference Salamon and Jaime1 The doped manganites are known to exhibit a number of unusual and interesting electronic properties amongst which the temperature-dependent metal–insulator (MI) transition is probably the most dramatic ones. It is established that the spin structure and electronic properties of Re1−x A x MnO3 are correlated within the framework of the double-exchange mechanism. Reference Zener2,Reference Anderson and Hasegawa3 The double exchange alone could not explain the CMR effects in Re1−x A x MnO3 and proposed that a strong electron–phonon coupling, e.g., via Jahn–Teller effects, should be effective. Reference Millis, Littlewood and Shraiman4
In the recent past, monovalent alkali metal doped Re1−x B x MnO3 (B = Na, K, Ag, etc.) has also attracted the researchers. Reference Roy, Guo, Venkatesh and Ali5,Reference Shannon6 As the valence state alkali metal ions is +1, the substitution of these ions affects the ratio of Mn3+ (t3 2geg 1) and Mn4+ (t3 2geg 0) ions, which finally also influences the double exchange mechanism and can give rise to different interplays amongst charge, spin, and lattice degrees of freedom. The metal ions such as La and Ag are close in ionic radius (R La 3+ = 1.18 Å, R Ag + = 1.13 Å), and the La1–x Ag x MnO3 system is of considerable interest.
Raman spectroscopy provided essential information about the lattice and JT distortion and orbital ordering in the manganites that occurs at variable doping levels.
Reference Abrashev, Litvinchuk, Iliev, Meng, Popov, Ivanov, Chakalov and Thomsen7
It is also used to elucidate the spin–phonon and electron–phonon interaction present in the system. The ideal perovskite ABO3 of cubic structure space group Pm3m presents 15 normal modes of vibration. On the other hand, doping at La (A) or at Mn (B) site essentially causes a change in the structure which is due to either the mismatch of the ionic radii of the ions in the unit cell or the J–T effect associated with the Mn3+ ions. The result is orthorhombic (Pnma) and rhombohedral
 $\left( {R\bar 3c} \right)$
structures with Raman active phonon modes.
For higher doping in manganites, the strong electron–phonon coupling localizes the conduction band electrons as polarons. The polaronic effect is reduced as the temperature is decreased through the Curie temperature T C, permitting the formation of a metallic state. Reference Millis, Shraiman and Mueller8 For doped manganites, it is pointed out that the electron–phonon interactions are substantial and the existence of insulating states competing with the Double exchange induced ferromagnetic (FM) metal is important. Besides the FM metallic phase, the antiferromagnetic (AF) charge-ordered insulating state is necessary to explain the CMR effect. Reference Sen, Alvarez and Dagotto9 The AF superexchange J AF coupling plays a crucial role in the magnitude of the CMR effect. The J AF is needed to stabilize the charge ordered AF state that competes with the FM metal. The origin of the CMR effect relies on a nanometer-scale short-range order above T C. To obtain CMR effects, clusters of just a few lattice spacing in size appear sufficient. Reference Yu, Dong, Şen, Alvarez and Dagotto10
The monovalent (Na, K, and Ag) doped manganites illustrate the metallic behavior below temperature T MI. Above this temperature, it behaves like a semiconductor. For La1−x Ag x MnO3, the MI transition temperature T MI increases with the Ag concentration x (0 < x ≤ 0.5). The T MI is 272 K for x = 0.05 and 299 K for x = 0.1, respectively. Reference Ye, Song, Dai, Wang, Wang, Zhang, Du, Sun and Fang11 The structural and electronic properties of the perovskite crystal clearly have an important effect on magnetoresistance and in particular on the Curie temperature. It has been observed that the interactions between the charge carriers and vibrations of the crystal lattice (phonons) also play a fundamental role in changing the resistance as the temperature falls toward the Curie temperature.
Earlier, Kumar and Majumdar solved the disordered Holstein-double exchange model to study the effect of disorder at strong electron–phonon coupling and noticed that even weak disorder enormously enhances the resistivity at T = 0 K, simultaneously suppressing the density of states at the Fermi level. Furthermore, the presence of weak disorder suppresses the temperature-dependent increase of ρ and leads to a regime with dρ/dT < 0, which is attributed to the disorder induced tendency toward polaron formation. Reference Kumar and Majumdar12 Later on, it is demonstrated that the extrinsic disorder controls the interplay of lattice polaron effects and spin fluctuations and leads to widely varying regimes in transport explicitly for optimally doped manganites. Reference Kumar and Majumdar13
The polaron behaves like heavy particles and can be mobile with metallic conduction at low temperatures and form a polaronic Fermi liquid. Reference Alexandrov, Zhao, Keller, Lorenz, Wang and Chu14 The resistivity data of La1−x Ca x MnO3 below 100 K are consistently retraced by a polaron mechanism. The behavior of resistivity at low temperature in a FM metallic state of manganites is consistent with small-polaron coherent motion that involves a relaxation due to a low-lying optical phonon mode. Reference Zhao, Smolyaninova, Prellier and Keller15
At low temperatures, a dominant T 2 contribution in resistivity is generally observed and has been ascribed to electron–electron scattering. In manganites, the resistivity is essentially temperature independent below 20 K and exhibits a strong T 2 dependence above 50 K. Reference Jaime, Lin, Salamon and Han16 Kubo and Ohata suggest two-magnon processes, predicting a leading T 4.5 dependence of the resistivity in the FM phase of manganites. Reference Kubo and Ohata17 The resistivity peak and the CMR of hole doped manganites La0.75Ca0.25MnO3 are a result of the current carrier density collapse with strong electron–phonon coupling. The FM transition in manganites is driven by an exchange interaction of polaronic carriers with localized spins. Reference Alexandrov and Bratkovsky18 In both hole and electron doped manganites, an additional contribution arising from the electron–electron contribution is a must to analyze the FM metallic resistivity behavior. Reference Varshney and Kaurav19–Reference Varshney, Choudhary and Shaikh24 Overall, the electron–phonon, electron–electron, and electron–magnon scattering must be an important cause of resistivity in the FM metallic state of doped manganites.
The present investigations are structured as follows. In Sec. II, we first formulate an interaction potential, which includes the long-range Coulomb, van der Waals (vdW) interaction, and the short-range repulsive interaction up to the second-neighbor ions within the Hafemeister and Flygare approach. This enables us to compute the Debye and Einstein temperatures of La1−x Ag x MnO3 (x = 0.05 and 0.1). We use the Bloch–Gruneisen (BG) method to estimate the independent contributions of acoustic and optical phonons and both. Details of the numerical analysis and its results are discussed in Sec. III.
The main findings on La1−x Ag x MnO3 (x = 0.05 and 0.1) manganites include:
-
(i) The computed Debye and Einstein temperatures from the interaction potential, which are consistent with the experimental results.
-
(ii) The optical phonon yields a relatively larger contribution to the resistivity compared to the contribution of acoustic phonon.
-
(iii) The classical electron–phonon model of resistivity, as the BG model partially describes the reported metallic resistivity behavior in the temperature range T < T MI for La1−x Ag x MnO3 (x = 0.05 and 0.1).
-
(iv) The quadratic temperature dependence of ρdiff. [= ρexp. − {ρ0 + ρe–ph}] is interpreted in terms of 3D electron–electron inelastic scattering.
-
(v) The T 4.5 dependence due to electron–magnon scattering is further required for a complete explanation.
-
(vi) The Mott–Ioffe–Regel criterion for metallic conductivity is valid, k F l ∼ 1 and εFτ ∼ 1.
The summary and our main conclusions are presented in Sec. IV.
II. METHOD OF COMPUTATION
Raman spectroscopy provides information about the electronic and lattice processes responsible for the physical behavior of the mixed valence manganites. Reference Iliev, Abrashev, Lee, Popov, Sun, Thomsen, Meng and Chu25 The ideal perovskite ABO3 of cubic structure presents around 15 normal modes of vibration. The lowest frequency (external mode) corresponds to a vibration of the A ions against the rigid BO6 octahedra. The intermediate frequency (bending mode) corresponds to a vibration where the B ion and two apical oxygens move against the other four oxygens of the octahedron. At the highest frequency (stretching mode), the B ion moves against the rigid oxygen octahedron. Reference Granado, Moreno, García, Sanjurjo, Rettori, Torriani, Oseroff, Neumeier, McClellan, Cheong and Tokura26 We can thus model the phonon spectrum consisting of an acoustic branch of Debye type and a separated optical peak with characteristic Einstein temperature.
The understanding of the dynamical properties of materials requires the formulation of an effective interionic potential. To begin with, we made the following assumptions: The change in force constants is small; the short-range interactions are effective up to the second-neighbor ions; and the atoms are held together by harmonic elastic forces without any internal strains within the crystal. We thus express the crystal energy for a particular lattice separation (r) as:
 $$U\left( r \right) = {U_{\rm{C}}}\left( r \right) + {U_{\rm{R}}}\left( r \right) + {U_{\rm{V}}}\left( r \right)\quad .$$
The first term is the Coulomb energy and follows:
 $${U_{\rm{C}}}\left( r \right) = - \sum\limits_{ij} {{{{Z_i}{Z_j}{e^2}} \over {{r_{ij}}}}} = - {{{\alpha _{\rm{m}}}{Z^2}{e^2}} \over r}\quad {\rm{,}}$$
where αm is the Madelung constant Reference Tosi27 and r ij is the separation distance between i and j ions.
The short-range overlap repulsive energy is the second term in Eq. (1) and
 $$U_{\rm{R}} \left( r \right) = nb\beta _{ij} \exp \left( {{{r_i + r_j - r_{ij} } \over \rho }} \right) + n\prime b\beta _{ii} \exp \left( {{{2r_i - kr_{ij} } \over \rho }} \right) + n\prime b\beta _{jj} \exp \left( {{{2r_j - kr_{ij} } \over \rho }} \right)\quad ,$$
follows Hafemeister and Flygare approach. Reference Hafemeister and Flygare28 The ionic radii are r i and r j , k is the structure factor, and n(n′) is the number of the nearest (next nearest) ions, respectively. Furthermore, the notations b and ρ denote the hardness and range parameters, respectively.
The Pauling coefficients, β ij , are defined in terms of valency [Z i (Z j )] and number of the outermost electrons [n i (n j )] in the anions (cations), respectively, as:
 $${\beta _{ij}} = 1 + \left( {{{{Z_i}} \mathord{\left/ {\vphantom {{{Z_i}} {{n_i}}}} \right. \kern-\nulldelimiterspace} {{n_i}}}} \right) + \left( {{{{Z_j}} \mathord{\left/ {\vphantom {{{Z_j}} {{n_j}}}} \right. \kern-\nulldelimiterspace} {{n_j}}}} \right)\quad .$$
The last term in Eq. (1) is the vdW energy, denoted as:
 $${U_{\rm{V}}}\left( r \right) = - \left( {\sum\limits{_{ij} {{{{c_{ij}}} \over {\mathop {{r_{ij}}}\nolimits^6 }} + \sum\limits_{ij} {{{{d_{ij}}} \over {\mathop {{r_{ij}}}\nolimits^8 }}} } } \right)\quad ,$$
 $$\quad \quad = - \left( {{C \over {{r^6}}} + {D \over {{r^8}}}} \right)\quad ,$$
due to dipole–dipole (d–d) and dipole–quadruple (d–q) interactions. The abbreviations C and D represent the overall vdW coefficients, due to the interactions mentioned in Eq. (1), defined as Reference Tosi27 :
 $$C = {c_{ij}}{S_6}\left( r \right) + {1 \over 2}\left( {{c_{ii}} + {c_{jj}}} \right){S_6}\left( 0 \right)\quad ,$$
and
 $$D = {d_{ij}}{S_8}\left( r \right) + {1 \over 2}\left( {{d_{ii}} + {d_{jj}}} \right){S_8}\left( 0 \right)\quad {\rm{,}}$$
where c ij and d ij are the vdW coefficients due to d–d and d–q interactions. We follow the variational method Reference Slater and Kirkwood29 to derive c ij and d ij as:
 $${c_{ij}} = {3 \over 2}{{e\hbar } \over {{{\sqrt m }_{\rm{e}}}}}{\alpha _i}{\alpha _j}{\left[ {{{\left( {{{{\alpha _i}} \mathord{\left/ {\vphantom {{{\alpha _i}} {{N_i}}}} \right. \kern-\nulldelimiterspace} {{N_i}}}} \right)}^{{1 \mathord{\left/ {\vphantom {1 {}}} \right. \kern-\nulldelimiterspace} {}}2}} + \left( {{{{\alpha _j}} \mathord{\left/ {\vphantom {{{\alpha _j}} {{N_j}}}} \right. \kern-\nulldelimiterspace} {{N_j}}}} \right)} \right]^{ - 1}}\quad ,$$
and
 $$d_{ij} = {{27} \over 8}{{\hbar ^2 } \over m}\alpha _i \alpha _j \left[ {\left( {{{\alpha _i } \mathord{\left/ {\vphantom {{\alpha _i } {N_i }}} \right. \kern-\nulldelimiterspace} {N_i }}} \right)^{{1 \mathord{\left/ {\vphantom {1 2}} \right. \kern-\nulldelimiterspace} 2}} + \left( {{{\alpha _j } \mathord{\left/ {\vphantom {{\alpha _j } {N_j }}} \right. \kern-\nulldelimiterspace} {N_j }}} \right)^{{1 \mathord{\left/ {\vphantom {1 2}} \right. \kern-\nulldelimiterspace} 2}} } \right]^2 \left[ {\left( {{{\alpha _i } \mathord{\left/ {\vphantom {{\alpha _i } {N_i }}} \right. \kern-\nulldelimiterspace} {N_i }}} \right) + {{20} \over 3}\left( {{{\alpha _i \alpha _j } \mathord{\left/ {\vphantom {{\alpha _i \alpha _j } {N_i N_j }}} \right. \kern-\nulldelimiterspace} {N_i N_j }}} \right)^{1/2} + \left( {{{\alpha _j } \mathord{\left/ {\vphantom {{\alpha _j } {N_j }}} \right. \kern-\nulldelimiterspace} {N_j }}} \right)} \right]^{ - 1} \quad .$$
Here, m e is the electron mass, α i is the electronic polarizability, and N i denotes the effective number of electrons of the ith ion. The values of the overall vdW coefficients are obtained using Eqs. (7) and (8) and weighted in terms of appropriate lattice sums [S 6(0), S 6(r), S 8(0), and S 8(r)]. Reference Tosi27 The individual vdW coefficients c ij and d ij are obtained with certainty and accuracy as the excitation energies are ignored in Eqs. (9) and (10). Reference Varshney, Kaurav, Kinge and Singh30
Herein, the above description we shall seek the interionic interaction in between a pair of ions such as Mn–O and La/Ag–O. It is clear from the above descriptions that the present effective interionic potential contains only two free parameters (b and ρ), which are determined from the equilibrium conditions Reference Varshney, Joshi, Varshney and Shriya31–Reference Varshney, Joshi, Varshney and Shriya34 :
 $${\left( {{{{\rm{d}}U} \over {{\rm{d}}r}}} \right)_{r = {r_0}}} = 0\quad ,$$
and bulk modulus
 $${B_{\rm{T}}} = {1 \over {9k{r_0}}}{\left( {{{{{\rm{d}}^2}U} \over {{\rm{d}}{r^2}}}} \right)_{r = {r_0}}}\quad .$$
The model parameters obtained from Eqs. (11) and (12) have been used to compute the second order elastic constants (SOECs) (C 11, C 12, and C 44) as Reference Varshney, Joshi, Varshney and Shriya35,Reference Varshney, Shriya and Varshney36 :
 $${C_{11}} = {{{e^2}} \over {4\mathop {{r_0}}\nolimits^4 }}\left[ { - 5.112\mathop {{Z_m}}\nolimits^2 + {A_1} + {{\left( {{A_2} + {B_2}} \right)} \over 2}} \right]\quad ,$$
 $${C_{12}} = {{{e^2}} \over {\mathop {{r_0}}\nolimits^4 }}\left[ {0.226\mathop {{Z_m}}\nolimits^2 - {B_1} + {{\left( {{A_2} - 5{B_2}} \right)} \over 2}} \right]\quad ,$$
 $${C_{44}} = {{{e^2}} \over {4\mathop {{r_0}}\nolimits^4 }}\left[ {2.556\mathop {{Z_m}}\nolimits^2 + {B_1} + {{\left( {{A_2} + 3{B_2}} \right)} \over 4}} \right]\quad ,$$
where (A 1, B 1) and (A 2, B 2) are the short-range parameters for the nearest and the next nearest neighbors, respectively. These parameters are defined as Reference Varshney and Attia37 :
 $${A_1} = {{\mathop {4{r_0}}\nolimits^3 } \over {{e^2}}}{\left[ {{{{{\rm{d}}^2}} \over {{\rm{d}}{r^2}}}{V_{ij}}\left( r \right)} \right]_{r = {r_0}}}\quad ,$$
 $${A_2} = {{4{{\left( {{r_0}\sqrt 2 } \right)}^3}} \over {{e^2}}}{\left[ {{{{{\rm{d}}^2}} \over {{\rm{d}}{r^2}}}{V_{ii}}\left( r \right) + {{{{\rm{d}}^2}} \over {{\rm{d}}{r^2}}}{V_{jj}}\left( r \right)} \right]_{r = {r_0}\sqrt 2 }}\quad ,$$
 $${B_1} = {{\mathop {4{r_0}}\nolimits^3 } \over {{e^2}}}{\left[ {{{\rm{d}} \over {{\rm{d}}r}}{V_{ij}}\left( r \right)} \right]_{r = {r_0}}}\quad ,$$
 $${B_2} = {{4{{\left( {{r_0}\sqrt 2 } \right)}^2}} \over {{e^2}}}{\left[ {{{\rm{d}} \over {{\rm{d}}r}}{V_{ii}}\left( r \right) + {{\rm{d}} \over {{\rm{d}}r}}{V_{jj}}\left( r \right)} \right]_{r = {r_0}\sqrt 2 }}\quad ,$$
where V ij (r) is the short-range potentials between the ions, which follow Reference Varshney and Shriya38 :
 $${V_{ij}}\left( r \right) = b{\beta _{ij}}\exp \left( {{{{r_i} + {r_j} - {r_{ij}}} \over \rho }} \right) + {c_{ij}}\mathop {{r_{ij}}}\nolimits^{ - 6} + {d_{ij}}\mathop {{r_{ij}}}\nolimits^{ - 8} \quad .$$
The elastic force constant κ is derived at the equilibrium interionic distance r 0 following Reference Varshney, Choudhary and Shaikh24 :
 $$\kappa = {{{r_0}} \over 2}{\left[ {{\pi ^2}\left( {{C_{11}} - {C_{12}}} \right)\left( {{C_{11}} + {C_{12}} + 2{C_{44}}} \right)\left( {{C_{44}}} \right)} \right]^{{1 \over 3}}}\quad .$$
Thus, we have estimated the elastic force constants in terms of the model Hamiltonian for a pair such as Mn–O and La/Ag–O and have the total elastic force constants of the Ag doped LaMnO3. This continuum model thus takes care of the clear physical binding in doped manganites. We stress that the simpler models based on this potential can describe those cohesive properties of such solids that depend on vdW interactions. However, the true potential must recognize the correct charge distribution and the relative orientations of the interacting atoms in manganites, which is a complicated task.
We shall now estimate the acoustic Debye branch characterized by the Debye temperature θD and an optical peak defined by the Einstein temperature θE. The Debye frequency is characterized as a cut-off frequency at the Brillouin zone boundary. It can be expressed in terms of the effective value of ionic mass and elastic force constant for crystal lattices with two different kinds of atoms such as Mn–O and La/Ag–O, which we deal with. The acoustic-mode and optical-mode frequencies are estimated in an ionic model using a value of effective ion charge Ze = −2e. Reference Varshney and Shriya38
For the sake of simplicity, we have chosen an acoustic mass M = (2M + + M −) [Mn(O) which is symbolized by M +(M −)], κ* = 2κ for each directional oscillation mode to get the acoustic phonon frequency as Reference Varshney, Shaikh and Mansuri22–Reference Varshney, Choudhary and Shaikh24 :
 $${\omega _{\rm{D}}} = \sqrt {{{2\kappa * } \over M}} \quad .$$
In this regard, for a pairwise potential, the phonon is optic in origin and the frequency is determined by the reduced mass of the pair as μ−1 = M(A)−1 + M(B)−1, where A is the anion (La/Ag, Mn) and B is the cation (O).
 $$\mathop {{\omega _{{\rm{LO}}}}}\nolimits^{\rm{2}} = {{\kappa + \alpha } \over \mu }\quad ,$$
 $$\mathop {{\omega _{{\rm{TO}}}}}\nolimits^{\rm{2}} = {{\kappa - \alpha } \over \mu }\quad ,$$
where α is the force constant as
 $$\alpha = {{8\pi } \over 3}{{{{\left( {Ze} \right)}^2}} \over \Omega }\quad .$$
ωLO (ωTO) symbolized for the longitudinal (transverse) optical phonon frequency and Ω for the volume of the unit cell.
It is known to us that in the metallic state, the electron–phonon, electron–electron, electron–magnon scattering, and polaronic effects are the major proponents of various conceptions in electrical transport. We shall begin with the description of the scattering of electron–phonon for the resistivity in the FM metallic state. To formulate a specific model, the temperature-dependent part of the metallic resistivity, following the Debye model, is Reference Varshney and Kaurav19–Reference Varshney, Choudhary and Shaikh24 :
 $$\rho \approx \left( {{3 \over {\hbar {e^2}\mathop {{v_{\rm{F}}}}\nolimits^2 }}} \right){{{k_{\rm{B}}}T} \over {M\mathop {{v_{\rm{s}}}}\nolimits^2 }}\int_0^{2{k_{\rm{F}}}} {{{\left| {F\left( q \right)} \right|}^2}} \left[ {{{x{q^3}{\rm{d}}q} \over {[{e^x} - 1][1 - {e^{ - x}}]}}} \right]\quad ,$$
with x = ħω/k B T. In the above, F(q) is the Fourier transform of the potential associated with one lattice site, v F is the Fermi velocity, and v s being the sound velocity. Eq. (26) in terms of acoustic phonon contribution determines the temperature dependence resistivity:
 $${\rho _{{\rm{ac}}}}\left( {T,{\theta _{\rm{D}}}} \right) = 4{A_{{\rm{ac}}}}T{\left( {{T \mathord{\left/ {\vphantom {T {{\theta _{\rm{D}}}}}} \right. \kern-\nulldelimiterspace} {{\theta _{\rm{D}}}}}} \right)^4}\int_0^{{{{\theta _{\rm{D}}}} \mathord{\left/ {\vphantom {{{\theta _{\rm{D}}}} T}} \right. \kern-\nulldelimiterspace} T}} {{x^5}{{\left( {{e^x} - 1} \right)}^{ - 1}}{{\left( {1 - {e^{ - x}}} \right)}^{ - 1}}{\rm{d}}x} \quad ,$$
where A ac is a constant of proportionality defined as Reference Varshney and Kaurav19–Reference Varshney, Choudhary and Shaikh24 :
 $${A_{{\rm{ac}}}} \cong {{3{\pi ^2}{e^2}{k_{\rm{B}}}} \over {\mathop {{k_{\rm{F}}}}\nolimits^2 \mathop {{v_{\rm{s}}}}\nolimits^2 L\hbar \mathop\!\! {{v_{\rm{F}}}}\nolimits^2 M}}\quad .$$
As the resistivity is additive, if the Matthiessen rule is obeyed, the resistivity is represented as a sum ρ(T) = ρ0 + ρe–ph(T), where ρ0 is the residual resistivity that does not depend on temperature as electrons also scatter off impurities, defects, and disordered regions. However, in case of the Einstein type of phonon spectrum (an optical mode), ρop(T) may be described as follows:
 $${\rho _{{\rm{op}}}}\left( {T,{\theta _{\rm{E}}}} \right) = {A_{{\rm{op}}}}\mathop {{\theta _{\rm{{\rm E}}}}}\nolimits^2\! {T^{ - 1}}{\left[ {{e^{{{{\theta _{\rm{E}}}} \mathord{\left/ {\vphantom {{{\theta _{\rm{E}}}} T}} \right. \kern-\nulldelimiterspace} T}}} - 1} \right]^{ - 1}}{\left[ {1 - {e^{{{{\theta _{\rm{E}}}} \mathord{\left/ {\vphantom {{{\theta _{\rm{E}}}} T}} \right. \kern-\nulldelimiterspace} T}}}} \right]^{ - 1}}\quad .$$
A op is defined analogously to Eq. (28).
We have thus conveniently modeled the phonon resistivity in the FM metallic state by combining both terms arising from acoustic and optical phonons
 $${\rho _{{\rm{e}}-{\rm{ph}}}}\left( T \right) = {\rho _{{\rm{ac}}}}\left( {T,{\theta _{\rm{D}}}} \right) + {\rho _{{\rm{op}}}}\left( {T,{\theta _{\rm{E}}}} \right)\quad .$$
The total resistivity follows:
 $${ \rho \left( {T,{\theta _{\rm{D}}},{\theta _{\rm{E}}}} \right) = {\rho _0} + {\rho _{{\rm{ac}}}}\left( {T,{\theta _{\rm{D}}}} \right) + {\rho _{{\rm{op}}}}\left( {T,{\theta _{\rm{E}}}} \right)\quad , = {\rho _0} + 4{A_{{\rm{ac}}}}{\left( {{T \mathord{\left/ {\vphantom {T {{\theta _{\rm{D}}}}}} \right. \kern-\nulldelimiterspace} {{\theta _{\rm{D}}}}}} \right)^4}T \times \int_0^{{{{\theta _{\rm{D}}}} \mathord{\left/ {\vphantom {{{\theta _{\rm{D}}}} T}} \right. \kern-\nulldelimiterspace} T}} {{x^5}{{\left( {{e^x} - 1} \right)}^{ - 1}}{{\left( {1 - {e^{ - x}}} \right)}^{ - 1}}{\rm{d}}x} \quad+ {A_{{\rm{op}}}}\mathop {{\theta _{\rm{{\rm E}}}}}\nolimits^2\! {T^{ - 1}}{\left[ {\exp \left( {{{{\theta _{\rm{E}}}} \mathord{\left/ {\vphantom {{{\theta _{\rm{E}}}} T}} \right. \kern-\nulldelimiterspace} T}} \right) - 1} \right]^{ - 1}}{\left[ {1 - \exp \left( {{{ - {\theta _{\rm{E}}}} \mathord{\left/ {\vphantom {{ - {\theta _{\rm{E}}}} T}} \right. \kern-\nulldelimiterspace} T}} \right)} \right]^{ - 1}}\quad . \cr}$$
The parent LaMnO3 at high temperatures is an insulator with a cubic structure and becomes tetragonal due to distortions at low temperatures. Doping at a La site by Ca, Sr, Ba, Na, K, and so forth leads to a decrease not only in the structural phase transition temperature but also in the overall behavior of resistivity. However, for optimized doped x ≅ 0.3, the material is still insulating (at about room temperature and higher) and the resistivity is much higher than the Mott limit. The substitution at the La site by divalent (monovalent) ions changes the valence of the Mn site as the outer Mn d-orbital shows two-fold degeneration and the result is Jahn–Teller (breathing type) distortion of the oxygen octahedra focused at each of the Mn occupied (unoccupied) sites. The energy required for the formation of a local lattice distortion is about 0.6 eV per site. Identifying a strong electron–phonon coupling and hence polaronic transport is essential in the doped materials. At high temperatures, the Jahn–Teller distortions are decorrelated, but do not disappear. Reference Millis39
On the other hand, the double exchange mechanism shows that the oxygen ion is closed shell and supports hopping. In a true sense, an electron jumps onto a Mn ion on the right simultaneously with an electron hopping onto the O ion from the Mn ion on the left. Henceforth, in the double hopping, both hopping electrons should have the same spin via the oxygen (O2−) ions. Following Hund's rule, the Mn3+ and Mn4+ ions should have the electron parallel spin moments for hopping. This mechanism connects the parallel alignment of Mn moments (ferromagnetism) with hopping of carriers (metallic conduction). Thus, an effective positive exchange coupling induced by the carriers was referred as double exchange. Reference Kubo and Ohata17
Actually, the lattice vibration of O ions essentially pushes the electrons toward vacant states in the Mn ion inducing a local distortion of the lattice. Such self-trapping of the charge carriers is substantially above the Curie temperature. However, below the Curie temperature, the self-trapping disappears because the bandwidth broadens and the electrons are much more mobile. It is inferred that at high temperature, the effective positive exchange coupling induced by the carriers does not solely contribute to the resistivity and that a strong electron–phonon interaction arising from the Jahn–Teller splitting of the outer Mn d level is essentially required. Reference Ederer, Lin and Millis40
III. DISCUSSION AND ANALYSIS OF RESULTS
Any discussion of the mixed-valent oxides necessitates the knowledge of the structural aspects, and this is particularly true of the calculations reviewed here. Also applying the available informations on the developed theory inevitably entails certain complications and one has to find suitable data that vary from technique to technique. The phonon scattering mechanism herein is discussed within the Debye framework and the hopping of charge carriers is treated in an isotropic double exchange model. The validity of the Debye approximation lies in the fact that the temperature region of interest lies well below the Debye temperature. The phonon contribution in the continuum approximation is usually expressed in terms of relaxation time and is related to various scattering processes. Various relaxation rates are proportional to the imaginary part of the phonon self-energy. Reference Varshney41
Special attention is paid in this approach to address the issue whether long range or short range interactions are at the origin of the transport properties of the monovalent Ag doped manganites. The effective interionic potential is thus constructed in an easily generalizable manner with realistic values of structural parameters, which actually control the resistivity behavior. The values of Debye and Einstein temperatures have been computed using the values of the two model parameters, namely, range (ρ), and hardness (b), for a pair such as La/Ag–O and Mn–O, which have been evaluated from the experimental values of equilibrium distance and bulk modulus. Reference Varshney and Mansuri42–Reference Shaikh and Varshney48
The values of the overall vdW coefficients C and D involved in Eqs. (7) and (8) have been evaluated from the well-known Slater–Kirkwood variational methods, Reference Slater and Kirkwood29 which are listed in Table I. We use the A site ionic radii (La/Ag) as 1.13 Å. Within the continuum model, we notice that the hardness parameter (b 1 and b 2) increases and the range parameter (ρ1 and ρ2) decreases with the increased Ag doping concentration (x) in La1−x Ag x MnO3. The model parameters and the SOECs are illustrated in Table II. The elastic force constant κ is derived at the equilibrium interionic distance r 0 following Eq. (21). The calculated values of κ are 5.695 × 10⁵ and 6.042 × 10⁵ gm s−2 for x = 0.05 and 0.1. Due to the lack of other theoretical calculations, the deduced value of model force constant could not be compared. Nevertheless, the evaluation of the elastic force constant gives a valuable guide to the behavior of vdW type forces in predicting the model phonon energies. Yet, the goal is not to determine the manner in which such interactions lead to the description of phonon frequencies but to discuss the electrical resistivity behavior.
vdW coefficients of La1−x Ag x MnO3 (x = 0.05 and 0.1) (c ij in units of 10−60 erg cm6 and d ij in units of 10−76 erg cm8).

The model parameters (b, ρ) and the SOECs for La1−x Ag x MnO3 (x = 0.05 and 0.1) samples.

Finally, we evaluate the values of acoustic and optical phonon frequency (ωD, ωLO, and ωTO) corresponding to Debye and Einstein temperatures. The computed values of ωD, ωLO, and ωTO are presented in Table III. We must mention that these computed values of ωD, ωLO, and ωTO for La1−x Ag x MnO3 with (x = 0.05 and 0.1) could not be compared due to the lack of the experimental data. However, the computed values of Debye and Einstein temperatures for La0.7Ba0.3MnO3 manganite following the model Hamiltonian approach yield consistent results with the available experimental results. Reference Abrashev, Litvinchuk, Iliev, Meng, Popov, Ivanov, Chakalov and Thomsen7,Reference Iliev, Abrashev, Lee, Popov, Sun, Thomsen, Meng and Chu25,Reference Granado, Moreno, García, Sanjurjo, Rettori, Torriani, Oseroff, Neumeier, McClellan, Cheong and Tokura26,Reference Hafemeister and Flygare28,Reference Mansuri, Varshney, Kaurav, Lu and Kuo43,Reference Varshney, Dodiya and Shaikh44,Reference Mansuri and Varshney47,Reference Shaikh and Varshney48
Parameters corresponding to the best fit to the experimental data of La1−x Ag x MnO3 (x = 0.05 and 0.1) samples by using BG model.

It is true that the two-orbital model based on Wannier functions predicts the electronic states such as charge ordering in manganites. It is pointed out by Marzari et al. that the Wannier function approach of the electronic problem is useful for the description of electron dynamics following the semiclassical theory as well as the magnetic interactions in solids. Reference Marzari and Vanderbilt49 In the present investigation, we do not intend to discuss the electron dynamics as well the magnetic interactions, but focused on determining the acoustic (optical) phonon frequency to estimate the electron–phonon contribution of resistivity in the FM metallic phase.
The developed effective interionic interaction potential takes care of the interactions in between a pair such as Mn–O and La/Ag–O. The interactions, thus, are attractive Coulomb, and vdW as well as short-range overlap repulsive interaction following Hafemeister and Flygare type potential. The advantage of using this potential is that it takes care of number of the nearest (next nearest) ions, the valency, and number of the outermost electrons in the anions (cations), respectively. Thus, it takes care of the structural parameters that yield an approximately correct description of the interactions between a pair such as Mn–O and La/Ag–O. Henceforth, we are able to estimate the acoustic (optical) phonon frequency consistent with the Raman measurements to estimate the electron–phonon contribution of resistivity.
We must refer to the work of Millis, who determines the elastic parameters using a mean field approximation with emphasis on Mn–O bond lengths and evaluated Mn–Mn and Mn–O force constants for the lattice distortions. Reference Millis39 On the other hand, in the present model, we have considered both Mn–O and La/Ag–O bond lengths to obtain the Mn–O, La/Ag–O, and total force constants for strong electron–phonon interaction. The formulated effective interionic interaction potential includes the long-range Coulomb, vdW interaction, and the short-range repulsive interaction up to the second-neighbor ions within the Hafemeister and Flygare approach. The interionic interaction between a pair such as Mn–O and La/Ag–O enables us to find the total force constant with consistent Debye and Einstein temperatures. Reference Varshney and Mansuri42–Reference Shaikh and Varshney48
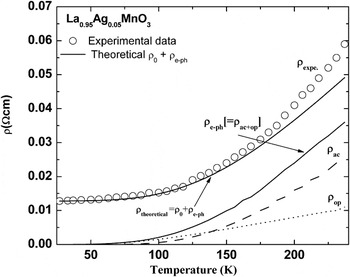
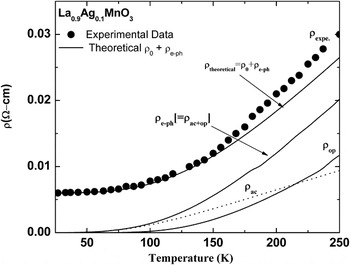
To analyze the transport mechanism of the Ag substituted manganites with x = 0.05 and 0.1 in the intermediate-temperature FM region below T p, we begin with the electron–phonon interaction to discuss the metallic behavior of ρ(T). Figures 1 and 2 illustrate the results of temperature dependence of resistivity with the electron–phonon interaction from Eq. (31). The contributions of acoustic and optical phonon toward resistivity are clubbed and the resultant resistivity is exponential at low temperatures and nearly linear at high temperatures until transition temperature. In the following calculations, we have used residual resistivity Reference Ye, Song, Dai, Wang, Wang, Zhang, Du, Sun and Fang11 ρ0 ≈ 0.021 and 0.006 Ω cm for x = 0.05 and 0.1. The coefficients A ac (A op) as functions of doping concentration are shown in Table III. It is noticed that the electron–phonon along with residual resistivity partially retraces the metallic resistivity behavior of La1−x Ag x MnO3 with (x = 0.05 and 0.1) manganites and other temperature-dependent mechanisms such as electron–electron, and electron–magnon scattering should be invoked.
Variation of ρe–ph with temperature for La0.95Ag0.05MnO3, the contribution of acoustic phonons ρac as well as of optical phonons ρop to the resistivity. The solid line represents best fit to the equation: ρ = ρ0 + ρe–ph (= ρac + ρop). Circles represent the experimental data. Reference Ye, Song, Dai, Wang, Wang, Zhang, Du, Sun and Fang11

Variation of ρe–ph with temperature for La0.9Ag0.1MnO3, the contribution of acoustic phonons ρac as well as of optical phonons ρop to the resistivity. The solid line represents best fit to the equation: ρ = ρ0 + ρe–ph (= ρac + ρop). The circles represent the experimental data. Reference Ye, Song, Dai, Wang, Wang, Zhang, Du, Sun and Fang11

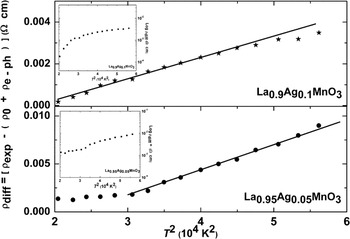
It is noticed from the plot that the estimated ρ is lower than the reported data from T ≅ 175 K for La1−x Ag x MnO3 with x = 0.05 and 0.1 to near the MI transition temperature (T MI). The difference between the measured ρ and calculated ρdiff. [= ρexp. − {ρ0 + ρe–ph (= ρac + ρop)}] is plotted in Fig. 3. A quadratic temperature dependence of ρdiff. is depicted at low temperature. The quadratic temperature contribution for resistivity is an indication of inelastic electron–electron scattering. The electron–electron interaction and inelastic scattering of electrons in doped manganites are important in the explanation of electrical resistivity. The justifying of electron–electron interaction in doped manganites lies in a fact that these have a resistivity of 10–40 mΩ cm, which is higher than the Mott's maximum metallic resistivity (≈10 mΩ cm). Reference Mansuri and Varshney47,Reference Shaikh and Varshney48
Variation of ρdiff. [= ρexp. − {ρ0 + ρe–ph (= ρac + ρop)}] with T 2 of La1−x Ag x MnO3 (x = 0.05 and 0.1).

The quadratic temperature dependence of ρdiff. is consistent with the earlier argument made. Reference Jaime, Lin, Salamon and Han16 The additional term due to electron–electron contribution was required in understanding the resistivity behavior, as extensive attempts to it the data with residual resistivity and phonon resistivity were unsuccessful. It is noteworthy to comment that in conventional metals, the electron–electron contribution to the resistivity can, at best, be seen only at very low temperatures, due to its small magnitude in comparison with the phonon contribution. The existence of quadratic temperature dependence of resistivity over a wide temperature interval permits one to believe that the electron–electron scattering is also significant in determining the resistivity in manganites.
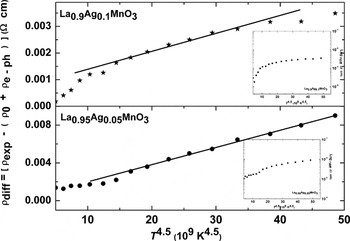
We again refer to Fig. 3, where a substantial deviation from the T 2-like behavior and a rapid rise in ρdiff. are observed in the intermediate temperature region (175 < T < T MI) [please see the inset of Fig. 3, where log ρdiff. is plotted as T 2 dependence]. We perform the similar set of exercises with the difference between the measured ρ and calculated ρdiff. [= ρexp. − {ρ0 + ρe–ph (= ρac + ρop)}] beyond 175 K (plotted in Fig. 4). A T 4.5 temperature dependence of ρdiff. is depicted in higher temperature [please see the inset of Fig. 4 where log ρdiff. is plotted as T 4.5 dependence]. The T 4.5 temperature contribution for resistivity is an indication of electron–magnon scattering. In the intermediate temperature region (175 < T < T MI), the manganites appear to be normal metallic ferromagnet with the resistivity dominated by spin-wave scattering.
Variation of ρdiff. [= ρexp. − {ρ0 + ρe–ph (= ρac + ρop)}] with T 4.5 of La1−x Ag x MnO3 (x = 0.05 and 0.1).

For hole doped manganites stressed that an additional T 4.5 contribution as a result of electron–magnon scattering process is essential. Reference Kubo and Ohata17 In the recent past, we have also noticed that the spin-wave scattering in the FM metallic phase is important in discussing the electrical resistivity behavior of La0.67Ca0.33MnO3. Reference Varshney and Kaurav19 We admit that in the higher temperature limit, the difference can be predicted linearly with T 4.5 in accord with the electron–magnon scattering in the double exchange process. The feature of T 4.5 temperature dependence of ρdiff. is consistent with the quantum theory of two-magnon scattering and is valid for half-metallic ferromagnets. Reference Kubo and Ohata17 Consequently, besides electron–phonon and electron–electron interactions, another possibility for the changes in carrier density arose due to the presence of spin waves in the metallic system and is caused by spin-wave scattering.
We now address the metallic behavior of doped manganites. If the high-frequency phonon modes are indeed strongly coupling with charge carriers, the effective mass of the carriers should be substantially enhanced. The Fermi energy and the corresponding density of states are conveniently obtained from the thermo-electric power results Reference Kamilov, Gamzatov, Aliev, Batdalov, Abdulvagidov, Mel’nikov, Gorbenko and Kaul50 using εF = −π2 k B 2 T/[3|e|S c diff(T)] and N(εF) = 3n 3D V/2εF (where n 3D is the three-dimensional charge carrier density which is obtained following n 3D d 3 = 1 and V is the unit cell volume). The density of states in turn yields the electronic specific heat coefficient using γ = (πk B)2 N(εF)/3 (see Table IV). It is noticed that the above values are consistent with the γ values in another hole doped divalent manganites Reference Ghivelder, Castillo, McN Alford, Tomka, Riedi, MacManus-Driscoll, Akther Hossain and Cohen51,Reference Varshney, Mansuri, Kaurav, Lung and Kuo52 and could not be compared due to the lack of experimental data on monovalent doped manganites. The effective mass of the carrier along the conducting Mn–O plane is deduced from electronic specific heat coefficient γ, using, m* = 3ħ 2πγd/k B 2.
The estimated electron parameters for La1−x Ag x MnO3 (x = 0.05 and 0.1) manganites.

The estimated electron parameters for La1−x Ag x MnO3 with x = 0.05 and 0.1 are the Fermi wave vector k F, the Fermi velocity v F, and the plasma frequency ωp and are given in Table IV. We stress that the effects induced by electron correlations and mass renormalizations by electron–electron interactions are crucial in magnetic systems such as doped manganites. Reference Dodiya and Varshney53–Reference Varshney and Dodiya57
It is known that in conventional metals, electron–phonon scattering is mathematically identical to conventional impurity scattering and leads to a resistivity proportional to (v F 2 l)−1 where l is the mean free path. The mean free path in this approximation is usually related to the Fermi velocity and is estimated as follows l = v F τ. We follow the Drude relation, τ−1 = ρ0ωp 2/4π, to obtain the scattering rate R s = τ −1. The estimated values of R s and l are given in Table IV. We must mention that the residual resistance obtained for nominally the same compositions may vary significantly for different groups of compounds. It remains unclear whether ρ0 only characterizes the sample's quality or if there is an intrinsic component in the residual resistivity. Reference Quijada, Cerne, Simpson, Drew, Ahn, Millis, Shreekala, Ramesh, Rajeswari and Venkatesan58 For the Sr doped manganites, the resistivity data in the crystalline film yield ρ0 as low as 10−5 Ω cm and are in the range of typical metallic conductors. Reference Urushibara, Moritomo, Arima, Asamitsu, Kido and Tokura59 The deduced values of the Fermi energy (εF) for La1−x Ag x MnO3 with x = 0.05 and 0.1 correspond to a narrow energy band. We notice that the Ag doped lanthanum manganites are good metals as the product εFτ ∼ 1.
The electron correlations in view of mass enhancement effect in narrow band materials are important in doped LaMnO3. We notice that enhanced electron mass m*/m e > 1 in La1−x Ag x MnO3 (see Table IV) leads to the reduced plasma frequency, and hence the reduced zero temperature elastic scattering rate in comparison to conventional metals. It is perhaps worth noticing that the scattering rate at low temperatures is of the order of 1015 s−1 in hole-doped manganites. Reference Kubo and Ohata17 Furthermore, the Mott–Ioffe–Regel criterion for metallic conductivity is valid, as the deduced mean free path is greater than the Mn–O bond length. The use of the BG expression in estimating the electron–phonon contributions is thus validated as the product k F l ∼ 1.
The monovalent Ag doped manganites thus illustrate a metallic behavior below metal–insulator transition temperature T MI. The T MI increases with the Ag doping concentration. With increased doping, the monovalent Ag doped manganites behave as good metals and are attributed to the fact that there are twice as many Mn4+ ions as there are Ag ions and each of these Mn4+ will contribute a hopping hole.
The effects of the grain-boundary-induced lattice disorder on the resistivity in Sm0.55Sr0.45MnO3 at temperatures near the metal–insulator transition are carefully investigated. Reference Egilmez, Chow, Jung, Fan, Mansour and Salman60 The low temperature resistivity data (T ≤ 75 K) of the SmSrMnO were successfully fitted using the relation ρ = ρ0 + ρ2 T 2 + ρ5 T 5 with ρ0 as the residual resistivity and ρ2 and ρ5 are the electron–electron and the electron–phonon scattering coefficients, respectively. It is further noticed that in this temperature range, the disorder does not affect the temperature dependence of ρ; however, it causes an increase in the coefficients ρ0, ρ2, and ρ5 by two orders of magnitude.
In contrast to electron–phonon scattering as the source of resistivity in FM metallic state, the angle-resolved photoemission spectroscopy data for the bilayer manganite La1.2Sr1.8Mn2O7 identify a coherent polaronic metallic ground state below metal–insulator transition. Reference Mannella, Yang, Tanaka, Zhou, Zheng, Mitchell, Zaanen, Devereaux, Nagaosa, Hussain and Shen61 The FM metallic state is a polaronic metal with a strong anisotropic character of the electronic excitations, strikingly similar to the pseudogap phases in heavily underdoped cuprate high temperature superconductors as Bi 2212. A strong mass enhancement and a small renormalization factor are found to account for the metallic properties. Reference Mannella, Yang, Zhou, Zheng, Mitchell, Zaanen, Devereaux, Nagaosa, Hussain and Shen62 The temperature dependence of resistivity in the metallic state is intimately related to the polaronic metallic ground state and the insulator-to-metallic state can be attributed to the polaron coherence condensation process acting in concert with the double exchange mechanism. We may comment that the present theory finds an enhanced mass of holes as carrier (m*/m e > 1) for La1−x Ag x MnO3 with x = 0.05 and 0.1 from the electronic specific heat coefficient to validate the Mott–Ioffe–Regel criterion. However, a detailed analysis is further required to understand the polaronic metallic state in the FM phase and the condensation process analogous to underdoped cuprate high temperature superconductors. We shall address this issue in near future.
Given that La1−x Ag x MnO3 and related compounds are successfully used as magnetoresistive materials, a careful and complete study of their magnetic, transport, and structural properties is essentially required for technological applications. These magnetic materials witness a transition from a high temperature FM insulating phase to either a lower temperature FM metallic phase or AF insulating phase. The transition seen is associated with a large drop in electrical resistivity under the application of a magnetic field and leads to a large CMR. A careful study reveals that the Zener double exchange model, a strong electron–phonon interaction and polaron transport, is successful in explaining the electrical resistivity in the insulating and metallic phases of these manganites. Reference Graziosi, Gambardella, Prezioso, Riminucci, Bergenti, Homonnay, Schmidt, Pullini and Busquets-Mataix63
A minimum in the resistivity under the application of magnetic field is also important in manganites. The low temperature resistivity minimum is seen in noble-metal alloys with magnetic impurity and is explained in terms of Kondo effect (logarithmic dependence of resistivity on temperature). It arises from the exchange interaction between itinerant conduction electrons and localized spin impurities along with electron–electron interaction predicted the resistivity minima in La2/3Ca1/3MnO3. The upturn of resistivity below minimum resistivity could be due to factors like the Kondo effect or the electron–electron interaction. The expression used for a successful fit includes resistivity due to the domain boundaries, electron–electron interaction, spin-disorder scattering, Kondo term, and electron–phonon scattering is: ρ(T) = 1/[ρ0 + ρe T 1/2] + ρspinlnT + ρe–ph T 5. Reference Chen, Xu, Su, Cao and Zhang64
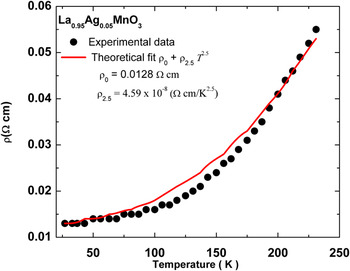
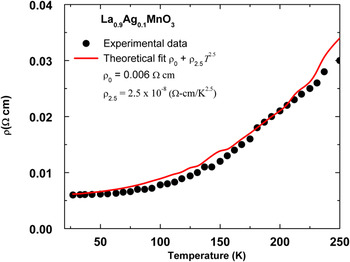
The magnetoresistivity in manganites at low temperatures needs a careful understanding of electrical resistivity. Schiffer and researchers argued that the resistivity in doped manganites follows using the relation ρ = ρ0 + ρ2.5 T 2.5. Reference Schiffer, Ramirez, Bao and Cheong65 Here, ρ0 is the residual and other temperature-independent scattering mechanisms. The term ρ2.5 T 2.5 is an empirical fit to the data, which represents a combination of electron–electron, electron–phonon, and electron–magnon scattering. Figures 5 and 6 illustrate the results of temperature dependence of resistivity in La1−x Ag x MnO3 (x = 0.05 and 0.1) manganites using ρ = ρ0 + ρ2.5 T 2.5. The best-fit parameters are ρ0 = 0.0128 (0.006) Ω cm and ρ2.5 = 4.59 (2.5) × 10−8 Ω cm/K2.5 for La0.95Ag0.05MnO3 (La0.90Ag0.10MnO3).
Variation of resistivity (ρ) with temperature for La0.95Ag0.05MnO3. The solid line represents best fit to the equation: ρ = ρ0 + ρ2.5. The circles represent the experimental data. Reference Ye, Song, Dai, Wang, Wang, Zhang, Du, Sun and Fang11

Variation of resistivity (ρ) with temperature for La0.9Ag0.1MnO3. The solid line represents best fit to the equation: ρ = ρ0 + ρ2.5. The circles represent the experimental data. Reference Ye, Song, Dai, Wang, Wang, Zhang, Du, Sun and Fang11

We note that empirical T 2.5 dependence, although retraces the curve, but, the data are not fitted adequately. Deduced values of ρ2.5 are consistent with earlier findings on La0.85Te0.15Mn1−x Cu x O3 (0 ≤ x ≤ 0.20) in the intermediate-temperature FM metallic region below the Curie temperature. Reference Ang, Sun, Yang, Zhu and Song66 It is further argued that rather taking independent temperature dependencies of various scattering mechanisms as electron–electron scattering process (ρee T 2), electron–magnon scattering process in the FM metallic phase (ρspin wave T 4.5) as ρ = ρ0 + ρe–e T 2.5 + ρspin wave T 4.5, it is better to represent resistivity in terms of a combination of electron–electron, electron–phonon, and electron–magnon scattering with ρ2.5 T 2.5 form. Reference De Teresa, Ibarra, Blasco, García, Marquina, Algarabel, Arnold, Kamenev, Ritter and von Helmolt67
IV. CONCLUSION
Either double exchange mechanisms or small polarons have primarily described the physics of manganites. The behavior of electrical resistivity in doped manganites explicitly the monovalent doped ion needs more clarification. The reported behavior of electrical resistivity in Ag doped manganites in the FM metallic phase is analyzed in the framework of the additional model of electron–phonon interaction using the model phonon spectrum consisting of two parts: An acoustic branch of Debye type and optical mode with characteristic Einstein temperature. Deduced values of Debye and Einstein temperatures from the pairwise potential with the long-range Coulomb, vdW interaction, and the short-range repulsive interaction up to the second-neighbor ions within the Hafemeister and Flygare approach are consistent with Raman spectroscopy measurements. For the sake of simplicity, a single (longitudinal and transverse) optical phonon mode has been considered, with a flat dispersion relation.
The high-energy optical phonon yields a large contribution to the resistivity and is attributed to a significant optical phonon hardening effect on carrier transport. From such a fitting, signatures of different types of interaction terms as electron–phonon, electron–electron, and electron–magnon are found to govern the transport mechanism in the low-temperature FM metallic phase (T < T MI). The temperature-dependent resistivity data in this region, where the local FM order is almost complete, have been successfully fitted with ρ = ρ0 + ρe–ph + ρe–e(T 2) + ρe–mag(T 4.5). We may comment that apart from the resistivity due to domain, grain-boundary and the electron–phonon scattering, the electron–electron and electron–magnon scattering are essential for a complete description of the metallic behavior of La1−x Ag x MnO3 with x = 0.05 and 0.1 manganites.
We have also attempted to fit the resistivity behavior using the empirical relation (= ρ0 + ρ2.5 T 2.5). The second-term ρ2.5 T 2.5 represents a combination of electron–electron, electron–phonon, and electron–magnon scattering. It is noted that empirical T 2.5 dependence, although retraces the curve, but the data are not fitted adequately. The mean free path is larger than the Mn–O bond length and the product of k F l ∼ 1 and εFτ ∼ 1 favors metallic conduction. Hence, it is appropriate to use the BG expression in estimating the electron–phonon contributions at T < T MI, and this is associated with the dynamic Jahn–Teller distortion, arising from the local lattice distortion due to the strong electron–phonon coupling. We finally conclude that below the Curie temperature, i.e., in the FM metallic phase two mechanisms are responsible for the resistivity: A temperature-independent scattering of the electrons (due to domain and grain boundaries, defects, etc.) and other temperature-dependent mechanisms (electron–electron, electron–phonon, and electron–magnon scattering).
ACKNOWLEDGMENT
Financial assistance from MPCST, Bhopal, India is gratefully acknowledged.