


UNCOVERING THE ORIGINS OF THE GENDER GAP IN POLITICAL AMBITION
For decades, one question has guided much of the research on gender and elections in the United States: Why do so few women occupy elective office? In an attempt to answer this question, gender politics scholars have employed a multifaceted and eclectic approach. They have surveyed and interviewed candidates and elected officials to assess levels of discrimination against women. They have combed fundraising receipts and vote totals to determine how women fare in the electoral arena. They have analyzed institutional barriers, such as the incumbency advantage and women's presence in the professions that lead to political careers, to uncover structural obstacles women face. Yet when the 113th Congress convened in January 2013, 82% of its members were men. This places the United States 95th worldwide in the percentage of women serving in the national legislature (Inter-Parliamentary Union 2013). Thus, despite women's gains in the educational and professional spheres that precede a career in politics, as well as evidence that points to broad public acceptance of female candidates, women remain significantly under-represented at all levels of elective office in the United States (for a review, see Lawless and Fox Reference Lawless and Fox2010; Palmer and Simon Reference Palmer and Simon2008).
This paradox has led scholars to identify the candidate emergence process as one the biggest obstacles to women's numeric representation (e.g.,Carroll Reference Carroll1994; Sanbonmatsu 2002). Indeed, data from the Citizen Political Ambition Studies—three national surveys of women and men who work in the professions from which most candidates for elective office emerge—reveal a striking gender gap in political ambition (Lawless and Fox Reference Lawless and Fox2012; Reference Lawless and Fox2010; Reference Lawless and Fox2005). Women are less likely than similarly situated men to consider running for office; less likely to run for office; less like to believe they are qualified to seek office; less likely to receive encouragement to run for office; and more likely to perceive a competitive, biased electoral environment (see also Fulton et al. Reference Fulton, Maestas, Maisel and Stone2006).
Although the existing work on candidate emergence identifies and explicates the contours of the gender gap in political ambition among well-established potential candidates, virtually no political science research examines its origins (but see Elder Reference Elder2004). We are very limited in the conclusions we can draw about the roots of the gap or the manner in which early life experiences shape it. This omission in the literature is critical because a general interest in, or openness toward, running for office early in life can set the stage for a political candidacy decades later. Young people's career goals, after all, tend to be excellent predictors of the occupations they ultimately attain (Ashby and Schoon Reference Ashby and Schoon2010; Mello Reference Mello2008; Trice and McClellan Reference Trice and McClellan1993). Many gendered attitudes about running for office, then, may result from deeply embedded socialized norms that are conveyed long before women and men find themselves in the candidate eligibility pool. Yet we simply do not know when young women and men's political ambition diverges, the extent to which it does so, or the factors that contribute to it. If the seeds of political ambition are planted at an early age, then gaining a complete understanding of the gender gap in ambition and prospects for women's representation demands that we pinpoint and explicate its origins.
This article provides the first investigation to do just that. Based on survey responses from a national random sample of nearly 4,000 high school (ages 13 to 17) and college (ages 18 to 25) students, we uncover a substantial gender gap in political ambition. This is striking evidence that the gap is, in fact, present well before women and men enter the professions from which most candidates emerge. We then employ political socialization—which we gauge through a myriad of socializing agents and early life experiences—as a lens through which to explain the individual-level differences we uncover. Our analysis reveals that parental encouragement, politicized educational and peer experiences, participation in competitive activities, and a sense of self-confidence influence young people's interest in running for office. But on each of these dimensions, women, particularly once they are in college, are at a disadvantage. By identifying when and why gender differences in interest in running for office materialize, we begin to uncover the origins of the gender gap in political ambition. Taken together, our results suggest that concerns about substantive and symbolic representation will likely persist.Footnote 1
STUDYING POLITICAL AMBITION EARLY IN LIFE: THE RESEARCH DESIGN
For the last forty years, scholars have provided compelling evidence of the transmission of political attitudes and activism through key agents of political socialization, such as family, education, peer associations, and media (for a review, see Jennings Reference Jennings, Dalton and Klingemann2007; Sapiro Reference Sapiro2004; Stoker and Bass Reference Stoker, Bass, Shapiro and Jacobs2011). Studies that investigate the manner in which socializing agents among youth populations affects political behavior, however, do not examine political ambition. Our canvass of the major data sets available—from a variety of disciplines and archived through both ICPSR and Roper—uncovered no existing questions about young people's interest in running for office as a career goal or aspiration. So, even though the extant research can shed light on the relationship between early socialization and many types of political attitudes and behavior, it cannot speak to political ambition or the role gender plays in its formation.Footnote 2
Whereas the literature pertaining to early socialization does not consider political ambition, the candidate emergence literature is limited in uncovering the origins of the gender gap for at least two reasons of its own. First, it focuses on samples of adults who are already established professionally. In most cases, respondents are actual candidates and office holders, all of whom, by definition, exhibited political ambition when they entered their first political contest (e.g., Canon Reference Canon1993; Gaddie Reference Gaddie2004; Maestas et al. Reference Maestas, Fulton, Maisel and Stone2006). But even the research that analyzes potential candidates relies exclusively on adults’ retrospective assessments of their early life experiences (Lawless and Fox Reference Lawless and Fox2010; Reference Lawless and Fox2005; see also Stone and Maisel Reference Stone and Maisel2003). Scholars of political psychology and attitude formation, however, warn about the substantive and methodological problems involved in relying on survey questions that ask people to reflect on previous time periods. Analyses of panel data show, for example, that recollections about political beliefs “correspond poorly to attitudes as originally expressed” (Markus Reference Markus1986, 41–2). Further, well-documented errors in the relationship between memory and self—such as absent-mindedness, misattribution, and bias—can frequently lead to versions of past life experiences that do not accurately reflect reality (Schacter Reference Schacter1999; see also Schacter, Chiao, and Mitchell Reference Schacter, Chiao, Mitchell, LeDoux, Debiece and Moss2003).
Second, even if we are cautious when interpreting reflections of previous experiences, the age distribution of women and men in the candidate eligibility pool limits the light the data can shed on when the gender gap in ambition emerges. The average age of the potential candidates in the Citizen Political Ambition Studies is 50 years old. So, although the 2011 survey reveals a gender gap in ambition among respondents under the age of 35 (Lawless and Fox Reference Lawless and Fox2012), and the 2001 survey uncovers a gender gap in ambition that is largest among those under the age of 40 (Lawless and Fox Reference Lawless and Fox2005), these cohort analyses are based on small samples. Moreover, hardly any of the respondents are younger than 30.
To investigate the relationship between early life experiences and the gender gap in political ambition, it is critical to survey respondents at a time that is more proximate to the original formation of attitudes about running for office. Thus, we conducted the first national survey of high school and college students’ political ambition. From September 27 to October 16, 2012, we surveyed a national random sample of 1,121 male and 1,042 female high school students (ages 13 to 17) and 1,020 male and 1,097 female college students (ages 18 to 25).Footnote 3 The survey allowed for an in-depth examination of whether a gender gap in political ambition exists among young people, as well as the factors that might contribute to or sustain it. More specifically, we designed the survey so that we could operationalize the effects of political socialization on political ambition.
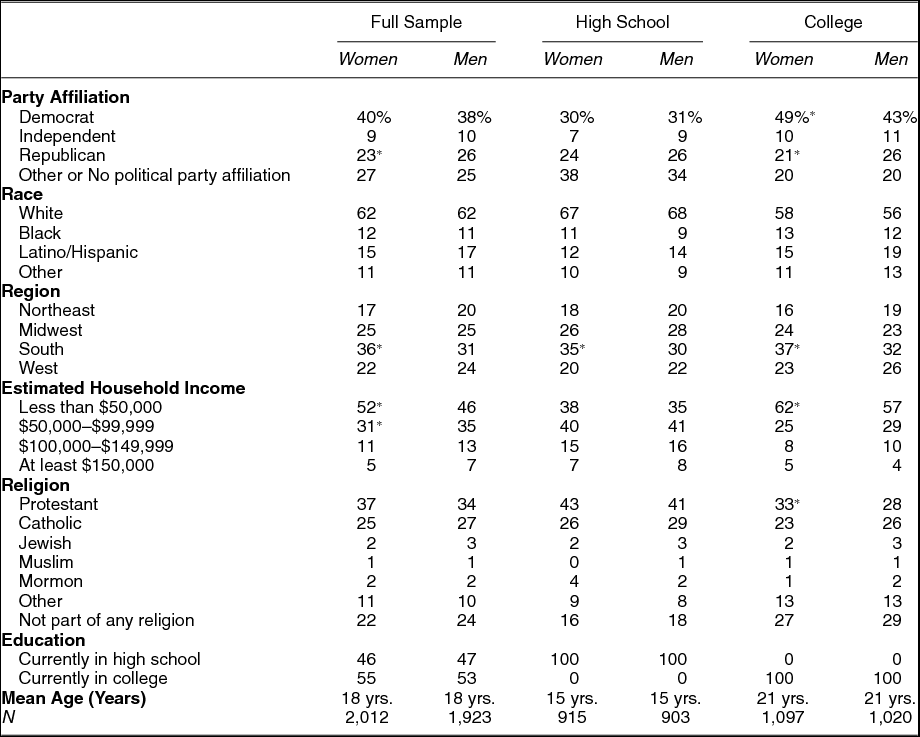
Important for our purposes, the male and female respondents were very similar in terms of race, religion, household income, region, and age (see Appendix A). As expected, women were slightly more likely than men to identify as Democrats, whereas men were more likely than women to identify as Republicans. But the few statistically significant gender differences within the sample were substantively small (and our multivariate analyses control for them). Accordingly, any gender gap in political ambition that we uncover does not result from sociodemographic differences between male and female respondents.Footnote 4
ESTABLISHING THE GENDER GAP IN EARLY POLITICAL AMBITION
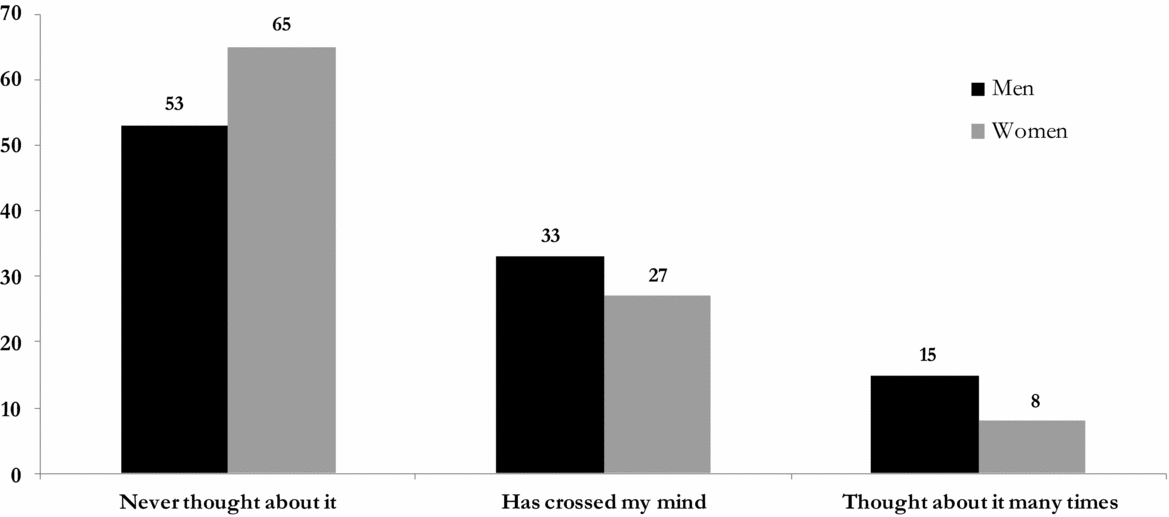
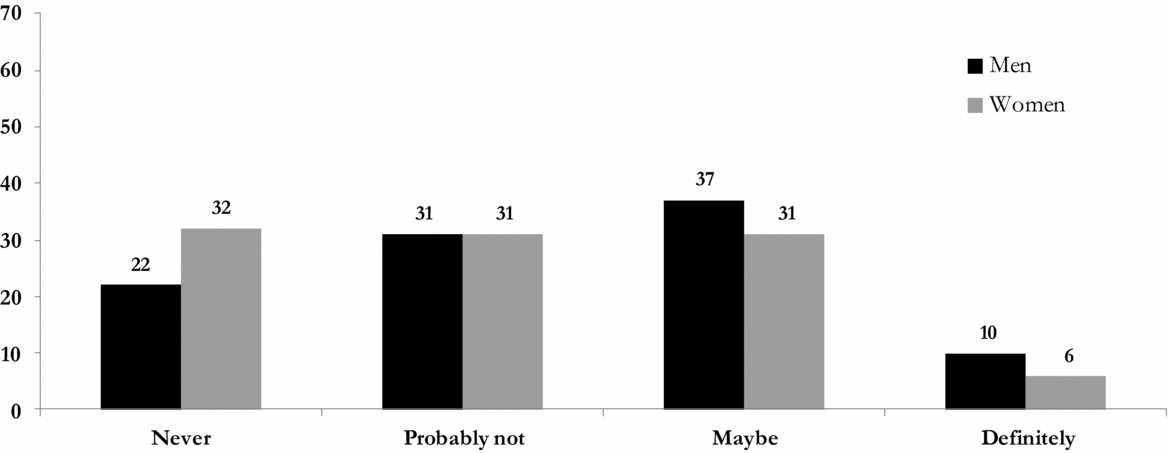
Similar to most adults, the majority of young people do not envision running for office. Among those who do, however, there is a substantial gender gap. Young women and men are not equally politically ambitious. We asked our respondents whether they ever thought that, someday, when they were older, they might want to run for any political office. Forty-one percent stated that the idea of running for an elective position had at least “crossed their mind.” The data presented in Figure 1A, however, reveal that men were almost twice as likely as women to have thought about running for office “many times,” whereas women were roughly 20% more likely than men never to have considered it. Put somewhat differently, 35% of women, compared to 48% of men, considered running for office. When we turn to the question of young people's plans to run for office in the future, the gender differences are just as stark. Men were two-thirds more likely than women to report that they “definitely” plan to run for office at some point in the future. Women, on the other hand, were 45% more likely than men to assert that they would never run (see Figure 1B).
The Gender Gap in Political Ambition: Have you ever thought that, someday, when you're older you might want to run for political office?
Interest in Running for Office in the Future: Even if you've never thought about it, how likely would you be to run for political office at some point in the future?
These gender differences are notable, but the notion of running for office may seem very far off in the minds of high school and college students. Accordingly, we also asked respondents a series of questions about jobs they would most like to hold in the future. And here, too, our results reveal gender differences in political ambition.
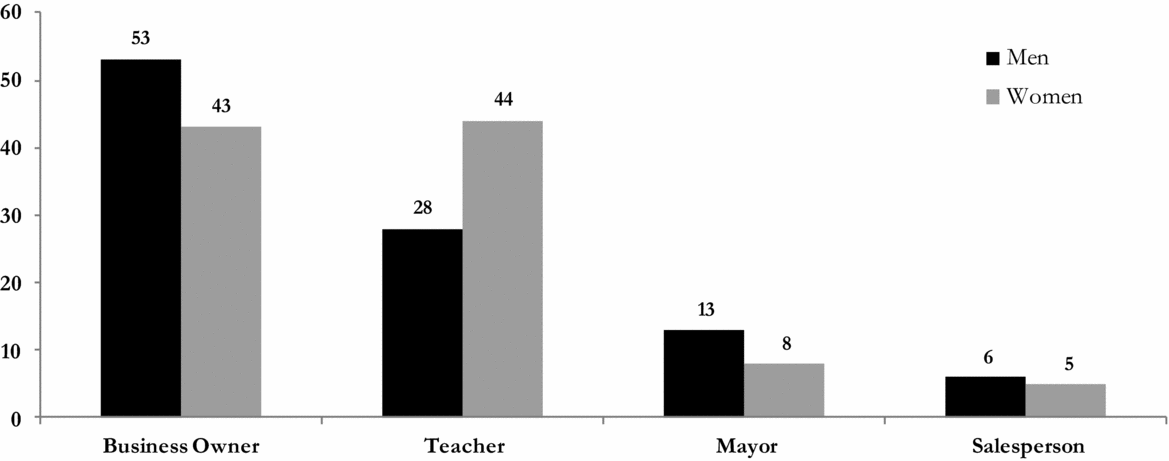
In a first scenario, we presented respondents with four career options—business owner, teacher, mayor of a city or town, and salesperson—and asked them which they would most like to be, assuming that each paid the same amount of money. Although both women and men ranked owning a business and being a teacher as more desirable than serving as a mayor, men were almost two-thirds more likely than women to select mayor as their preferred job (see Figure 2A). When we asked respondents to indicate which of the four positions they would least like to hold, a substantial gender gap emerged as well: 43% of women, compared to 31% of men, reported that mayor was their least preferred profession (this was the top answer for women).
A Mayoral Career: If the following jobs paid the same amount of money, which would you most like to be?
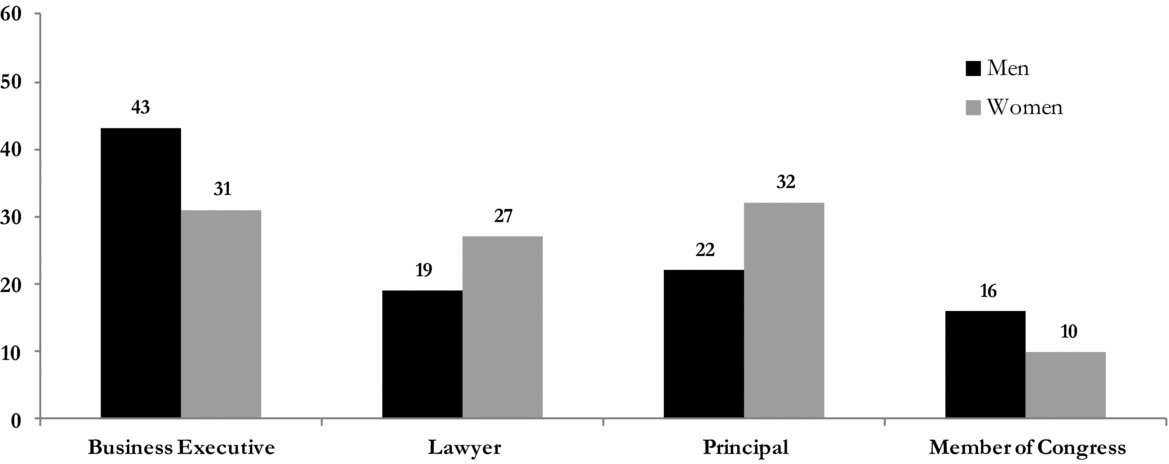
We then asked respondents to indicate which of the following four higher echelon jobs they found most appealing: business executive, lawyer, school principal, or member of Congress. Once again, women were significantly more likely than men to eschew the possibility of a political career. The data presented in Figure 2B reveal that men were 60% more likely than women to select a position as a member of Congress. On the other hand, 43% of women, compared to 33% of men, reported that serving in Congress was the least desirable professional option.
A Congressional Career: If the following jobs paid the same amount of money, which would you most like to be?
As a third way to gauge political ambition, we provided respondents with a list of 24 jobs and asked them to check off all they could imagine themselves holding in the future. We uncovered gender gaps in receptivity toward the three political positions about which we asked, as well as a series of other careers that can be classified as either historically male or historically female. For all three public offices—president, member of Congress, and mayor—men were at least one-third more likely than women to be open to the position. Men were also more likely than women to be attracted to a career in business and science, whereas women were more likely than men to express interest in being a teacher, nurse, or secretary. In fact, nearly twice as many female respondents were open to being a secretary as were open to serving in Congress.
These gender gaps in political ambition are striking not only because female and male respondents were similarly situated demographically, but also because they were equally likely to have participated in political activities. From voting, to attending a protest or rally, to blogging or emailing about a cause, to posting about or following a politician on a social networking site, we uncovered comparable rates of activism. They also held similar attitudes about politics and politicians; female respondents were no more likely than male respondents to hold politicians in low regard, for example.
Thus, if attitudes toward politicians and levels of political activity situate young people to think about running for office, then female respondents are as well-positioned as their male counterparts. Yet these data make clear that young women and men are not equally likely to consider running for office a desirable future endeavor. Our findings establish a consistent and considerable gender gap in political ambition that predates women and men's entry into the professions that tend to lead to political careers.
THE GENDER GAP IN POLITICAL AMBITION AMONG YOUNG CITIZENS: THEORY AND LITERATURE
Where does the gender gap in political ambition originate? Political socialization—which we define to include experiences that either directly or indirectly shape political attitudes and behavior in childhood and early adulthood—offers a compelling theoretical framework through which to understand the genesis of the gender gap in political ambition among young citizens. We argue that the multifaceted lens through which individuals come to see the world politically affects not only the propensity to express interest in running for office, but also accounts for gender differences therein. We draw on scholarship and empirical evidence from literatures on candidate emergence, political socialization, and political participation to derive five expectations to explain the origins of the gender gap in political ambition and the specific early life experiences that contribute to and sustain it.
Family Socialization
Family experiences early in life have lasting power to shape adults’ political attitudes and behavior. Political party affiliation, for instance, is often handed down from parent to child (Jennings, Stoker, and Bowers Reference Jennings, Stoker and Bowers2009; Fiorina Reference Fiorina1981). Notions of good citizenship and political activism and interest can also be traced back to political passion and activity in the childhood home (Jennings and Markus Reference Jennings and Markus1984; Jennings and Stoker Reference Jennings and Stoker2012; Verba, Schlozman, and Burns Reference Verba, Schlozman, Burns and Zuckerman2005). And recent studies suggest that adolescents who discuss politics with their parents develop higher levels of political knowledge and demonstrate a greater propensity to vote, attend community meetings, and engage the political system through signing petitions, participating in boycotts, or contributing money (Andolina et al. Reference Andolina, Jenkins, Zukin and Keeter2003; Jennings Reference Jennings2002; McIntosh, Hart, and Youniss Reference McIntosh, Hart and Youniss2007). It follows, therefore, that high school and college students who live(d) in politicized homes might be more interested in running for office later in life than those who live(d) in less politicized family environments.Footnote 5
Certainly, socialization in the family unit can shape both young men and women's political interest and ambition. But women may be less likely than men to experience a politicized upbringing. A survey of lawyers, business leaders, educators, and political activists found that women were nearly 20% less likely than men to remember speaking about politics with their fathers; and they were 15% less likely than men to report that their parents had encouraged them to run for office (Lawless and Fox Reference Lawless and Fox2010, 66). Perhaps as a result of these family experiences, 15% of men, compared to only 9% of women, reported that they first considered running for office before they graduated from high school (difference significant at p < .05). Although these findings succumb to the aforementioned methodological limitations involved in relying on adults’ retrospective accounts of their childhoods, they reflect patterns of socialization that promote men's greater suitability to enter the political sphere.
Political Context
Beyond the primary socializing agent of family, other contextual factors also affect young people's political behavior. Indeed, similar to the manner in which social networks influence adults’ political behavior and attitudes (Ahn, Huckfeldt, and Ryan Reference Ahn, Huckfeldt and Ryan2010; Huckfeldt and Mendez Reference Huckfeldt and Mendez2008; Ryan Reference Ryan2011), school experiences, peer associations, and media habits can affect young citizens’ political attitudes. In terms of educational experiences, politicized classroom programs in high schools can increase students’ intentions to vote (Billig, Root, and Jesse Reference Billig, Root and Jesse2005; see also Campbell Reference Campbell2008) and their sense of political efficacy (Pasek et al. Reference Pasek, Feldman, Romer and Jamieson2008). College students majoring in social sciences that facilitate the development of civic skills are also more likely to participate politically (Hillygus Reference Hillygus2005). Outside the classroom, adolescent participation and leadership roles in extracurricular activities, community clubs, and organizations increase the propensity to participate civically and politically as an adult (Glanville Reference Glanville1999; Hart et al. Reference Hart, Donnelly, Youniss and Atkins2007; Kirlin Reference Kirlin2003). Volunteering for politicized clubs and groups, as well as associating with the people in such groups, are also strongly linked to political interest later in life (McFarland and Thomas Reference McFarland and Thomas2006). Finally, media—particularly internet and web-based technologies—can teach civic skills, bolster future civic engagement and efficacy, and increase youth political interest and voter turnout (Iyengar and Jackman Reference Iyengar and Jackman2004; Montgomery, Gottlieb-Robles, and Larson Reference Montgomery, Gottlieb-Robles and Larson2004). Thus, we expect young women and men who navigate politicized environments at school, with their friends, and through the media to be more politically ambitious than those with educational and peer contexts that are less politically charged.
Like family, these contextual factors should affect both young women and men's ambition. But gender differences in exposure to these agents of political socialization might result in an advantage for men. Historically, male college students have been more likely than their female counterparts to major in political science and government (APSA 2010). These gender differences are relevant because exposure to, and the influence of, faculty and peers in college can affect political beliefs (Dey Reference Dey1996). Similarly, research regarding internet habits reveals that young men spend more time than young women reading news and absorbing political information (Fuller Reference Fuller2004). Coupled with gender segregation in many social networks (McClurg, Wade, and Wright-Phillips Reference McClurg, Wade and Wright-Phillips2013), the educational, peer, and media contexts in which young women and men operate may provide men with more exposure to experiences that spur interest in running for office.
Competitive Experiences
There is broad acceptance of the notion that anyone who ultimately decides to seek high-level office is competitive and driven. High school and college students’ experiences with competition—from student government elections to mock trial and debate competitions to leadership activities to sports—may foster the competitive drive that facilitates openness to entering the electoral arena in the future. A growing body of research finds, for example, that athletic participation carries longstanding positive economic and psychological benefits. Former high school athletes receive higher wages and better benefits later in life than do their nonathlete counterparts (Ewing Reference Ewing2007; see also Barron et al. Reference Barron, Ewing and Waddell2000; Stevenson Reference Stevenson2010). Athletic participation also often enhances discipline, confidence, self-esteem, motivation, and a competitive spirit (Erkut et al. Reference Erkut, Fields, Sing, Marx, Ross Leadbeater and Way1996; Lechner Reference Lechner2009), all of which are relevant for political success.Footnote 6 Student government elections operate similarly; participating in a campaign, even in high school or college, can demystify the political process and prepare young adults to embrace competition (see Lawless and Fox Reference Lawless and Fox2010). Hence, we expect a positive relationship between indicators of competitive behavior early in life and an openness toward running for office later in life.
Although women and men can benefit from the competitive environments provided by athletics and competitive experiences at school, female high school and college students may be less likely than men to take advantage of them. When comparing professional performance in competitive and noncompetitive environments among adults, investigators find that men are more likely than women to seek out competitive environments and to exude confidence when competing (Gneezy, Niederle, and Rustichini Reference Gneezy, Niederle and Rustichini2003; Niederle and Vesterlund Reference Niederle and Vesterlund2007). Moreover, although public support for gender equality in athletic opportunities is high (Sigelman and Wilcox Reference Sigelman and Wilcox2001) and women's participation has substantially increased, Title IX has not eliminated unequal access to sports.Footnote 7 Young women, therefore, may be at an overall disadvantage in terms of the socialized benefits they can accrue from these activities.
Self-Confidence
The extent to which individuals are confident about and perceive that they possess politically relevant skills and traits shapes their assessments of whether they are qualified to run for office (Fox and Lawless Reference Fox and Lawless2011). Evidence suggests, however, that whereas men are socialized to be confident, assertive, and self-promoting, cultural attitudes toward women as political leaders continue to leave an imprint suggesting to women—if even only subtly—that it is often inappropriate or undesirable to possess these characteristics (Enloe Reference Enloe2004; Flammang Reference Flammang1997). In fact, men and women perceive women to be less knowledgeable than men about politics, regardless of their actual levels of political knowledge (Mendez and Osborn Reference Mendez and Osborn2010). Women's tendency to diminish and undervalue their professional skills and achievements is in place by the time of adolescence. Male and female students in mathematics and language arts, for example, have vastly different perceptions of their own skills; male students overestimate their skills and female students underestimate theirs relative to objective indicators of competence (Pajares Reference Pajares2002; Wigfield, Eccles, and Pintrich Reference Wigfield, Eccles, Pintrich, Berliner and Calfee1996).
Gender differences also exist in the confidence women and men exhibit regarding their credentials and backgrounds. Social psychologists find that, in general, men are more likely than women to express confidence in skills they do not possess and overconfidence in skills they do (Kling et al. Reference Kling, Hyde, Showers and Buswell1999). Men tend to overestimate their intelligence, while women tend to underestimate theirs (Beloff Reference Beloff1992; Furnham and Rawles Reference Furnham and Rawles1995). And men often fail to incorporate criticism into their self-evaluations, whereas women tend to be strongly influenced by negative appraisals of their capabilities (Roberts Reference Roberts1991). Although high school and college students may not have fully formed opinions about their qualifications to run for office, the literature suggests that men will be more likely than women to express the confidence that, someday, they will be qualified.
Gender Roles and Identity
Traditional family dynamics and role orientations—in which women are the primary caretakers of the family and exist in the private domain, but men are the primary breadwinners and occupy public roles—persist in a substantial number of households (Marks, Bun, and McHale Reference Marks, Bun and McHale2009). When women do enter the workforce, analyses of the labor market confirm occupational gender segregation with the persistent grouping of “women’s” and “men’s” careers (Hegewisch et al. Reference Hegewisch, Liepmann, Hayes and Hartmann2010). Holding political office has always been considered a “men’s” career, so we expect that young women who have been socialized to hold attitudes that embody traditional gender roles and orientations may be less likely to exhibit political ambition than those with more egalitarian views about family dynamics and career options.
Whereas traditional gender role orientations might stunt young women's political ambition, exposure to female role models might promote it. Female role models from high schools to doctoral programs, for example, can help facilitate women's success (Marx and Roman Reference Marx and Romin2002; Nixon and Robinson Reference Nixon and Robinson1999). In terms of politics, Atkeson (Reference Atkeson2003) finds that women who live in states with successful, visible female candidates are more likely to be politically engaged. Women's levels of political proselytizing (Hansen Reference Hansen1997) and political interest (Burns, Schlozman, and Verba Reference Burns, Schlozman and Verba2001) also correlate with the presence of female elected officials. More directly, a cross-national examination found that the presence of female political leaders increased adolescent girls’ likelihood of planning to be politically active (Campbell and Wolbrecht Reference Campbell and Wolbrecht2006). Thus, we expect that young women who rely on female role models for career advice will be more likely than those who don't to express interest in running for office in the future.Footnote 8
Undoubtedly, these five research expectations are interrelated, and there are likely some complex causal relationships among them, as is often the case with political socialization research. Further, ours is a temporal argument that assumes that these central expectations predate the development of political ambition. This is not to say that respondents who are politically ambitious might not initiate more politicized family activities or seek out a more politicized context in their personal surroundings. But it is difficult to conceptualize how political ambition could develop without—let alone cause—experiences such as having political discussions in the household, engaging in competitive activities, or possessing a broad sense of self-confidence. Together, therefore, these explanations represent a series of early life experiences and socialized attitudes and behaviors that may influence political ambition. The gendered component of each suggests that they will also account for the bivariate level gender gap we uncovered in young people's interest in running for office.
EXPLAINING THE GENDER GAP IN POLITICAL AMBITION AMONG YOUNG CITIZENS: DATA AND ANALYSIS
To examine why some young women and men express interest in running for office in the future, while others do not, as well as to delve into the roots of the gender gap in political ambition, we developed eight regression equations. Table 1 reports ordered logistic regression coefficients for four equations that predict interest in running for office using a four-point scale. Respondents could have scored between a 1 (“absolutely no interest in a future candidacy”) and a 4 (“definitely plan to run in the future”). Although our expectations apply to both high school and college students, college students may be more likely to consider a candidacy; as people get older and accumulate more diverse experiences, they are more cognizant of opportunities they had not previously considered. Thus, the first two columns of Table 1 present models based on the pooled sample of high school and college students, but include an indicator variable for whether the respondent is in high school or college, as well as an interaction between sex and subsample. The third and fourth columns restrict the analysis by subsample, which allows us to examine with more nuance whether the same factors affect political ambition among high school and college students, as well as whether their relative substantive effects vary across subsample.
Political Socialization and Interest in Running for Office (Ordinal Logistic Regression Coefficients and Standard Errors)
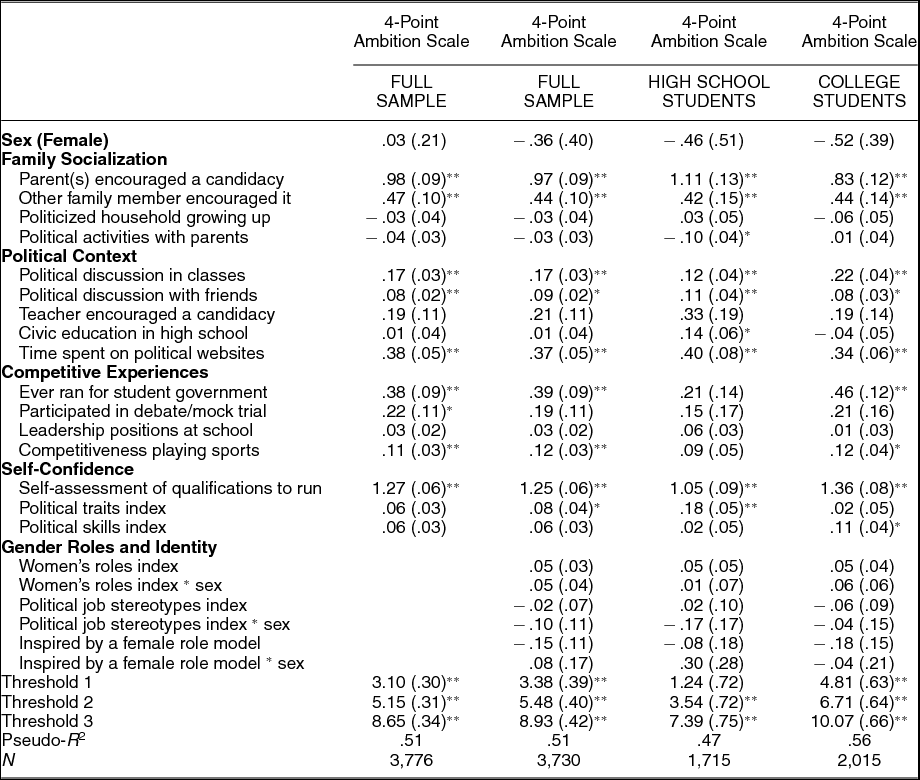
Notes: Models include controls for Black, Latino, Democrat, Republican, income, age, and political participation. Full Sample models also include controls for whether the respondent is in high school or college, and an interaction between subsample and respondent sex. Levels of significance: **p < .01; *p < .05.
The models operationalize the research expectations we identified with a series of original measures that tap into high school and college students’ experiences (see Appendix B for a description of the variable coding). Because we expect gender roles and identity to affect only female respondents’ interest in running for office, we interact the three gauges we use to measure this expectation with respondent sex. And to ensure that our results are not an artifact of the multiple interaction terms, we also perform the analyses without the gender roles and identity variables (see column 1). Each equation includes a series of demographic and political controls: race, age, region, household income, party identification, and political activity.
Because the majority of respondents are neither certain that they will run for office nor have dismissed the possibility outright, we also perform our analysis with a collapsed version of the four-point scale. Table 2 presents four logistic regression equations that predict political ambition with a dichotomous dependent variable that indicates whether the respondent is at least open to the idea of running for office in the future. As is the case with Table 1, we perform the analysis first on the full sample and then restrict the analysis to the high school and college subsamples.
Political Socialization and Interest in Running for Office (Binary Logistic Regression Coefficients and Standard Errors)
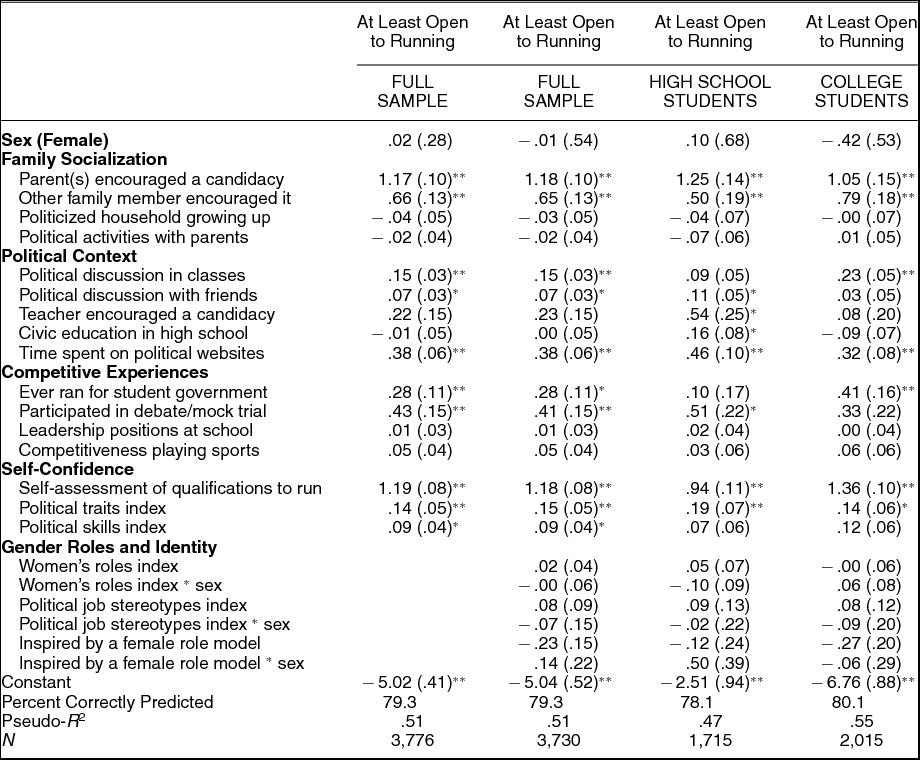
Notes: Models include controls for Black, Latino, Democrat, income, age, and political participation. Full Sample models also include controls for whether the respondent is in high school or college, and an interaction between subsample and respondent sex. Levels of significance: ** p < .01;* p < .05.
Most of the results that emerge from the regression analyses are consistent with our expectations.Footnote 9 Three broad findings merit discussion because they allow us to gain leverage over the factors that contribute to young citizens’ political ambition, as well as speak to the origins of the gender gap in interest in running for office in the future.
Identifying the Origins of Political Ambition
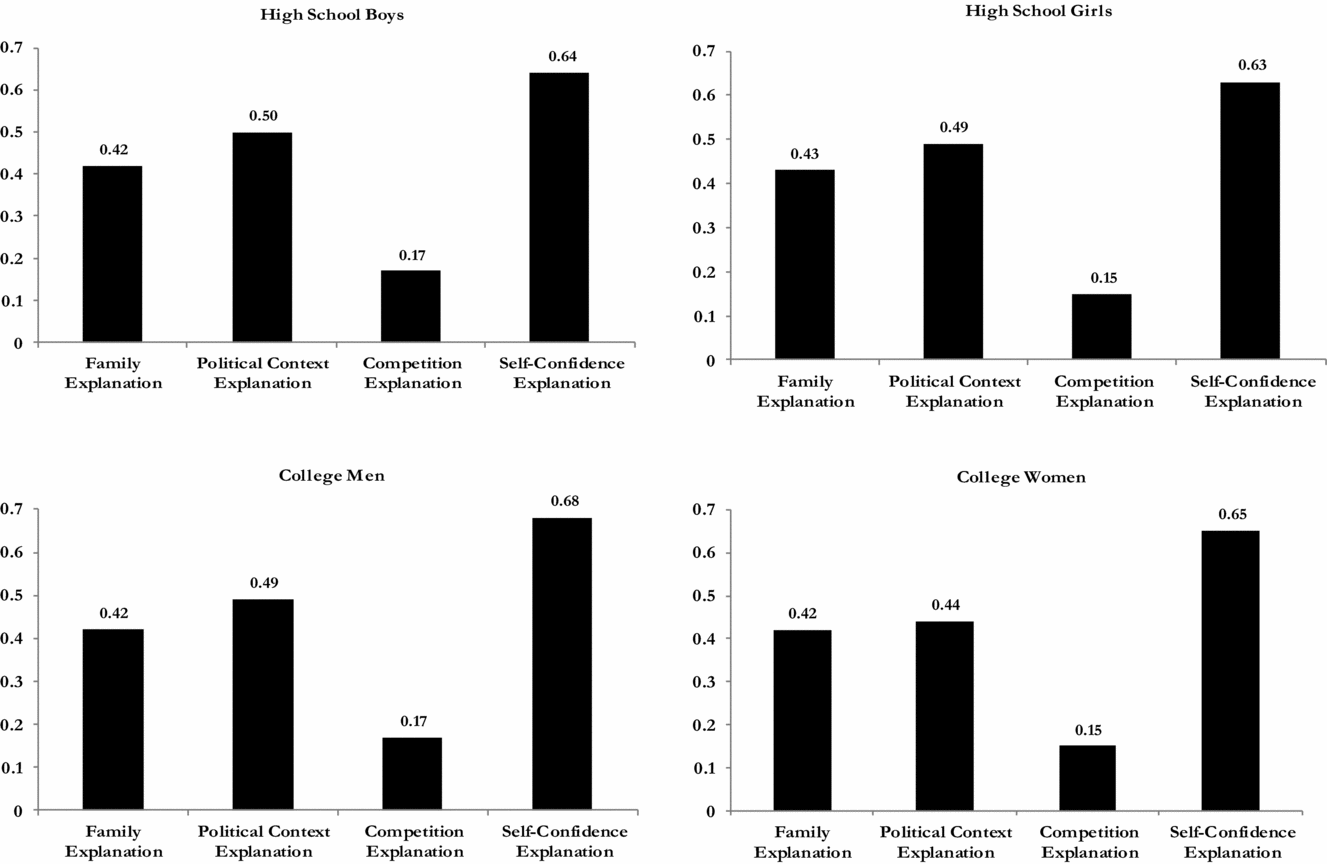
Our results demonstrate that political socialization provides a useful framework through which to analyze young people's political ambition and openness toward a future candidacy. Overall, regardless of whether we code ambition using the four-point scale or a dichotomous variable, family socialization, political context, competitive experiences, and self-confidence affect interest in running for office in the future.Footnote 10 And the same general explanations confer explanatory power even when we restrict the analyses to the high school and college subsamples. The Gender Roles and Identity expectation is the only one for which we do not uncover support.Footnote 11 Figure 3 presents the maximum change in probability conferred by each of the four significant expectations (based on the logistic regression results presented in Table 2, columns 3 and 4).Footnote 12
The Substantive Effect (Maximum Change in Probability) of Each Explanation on Political Ambition, by Sex and Sample
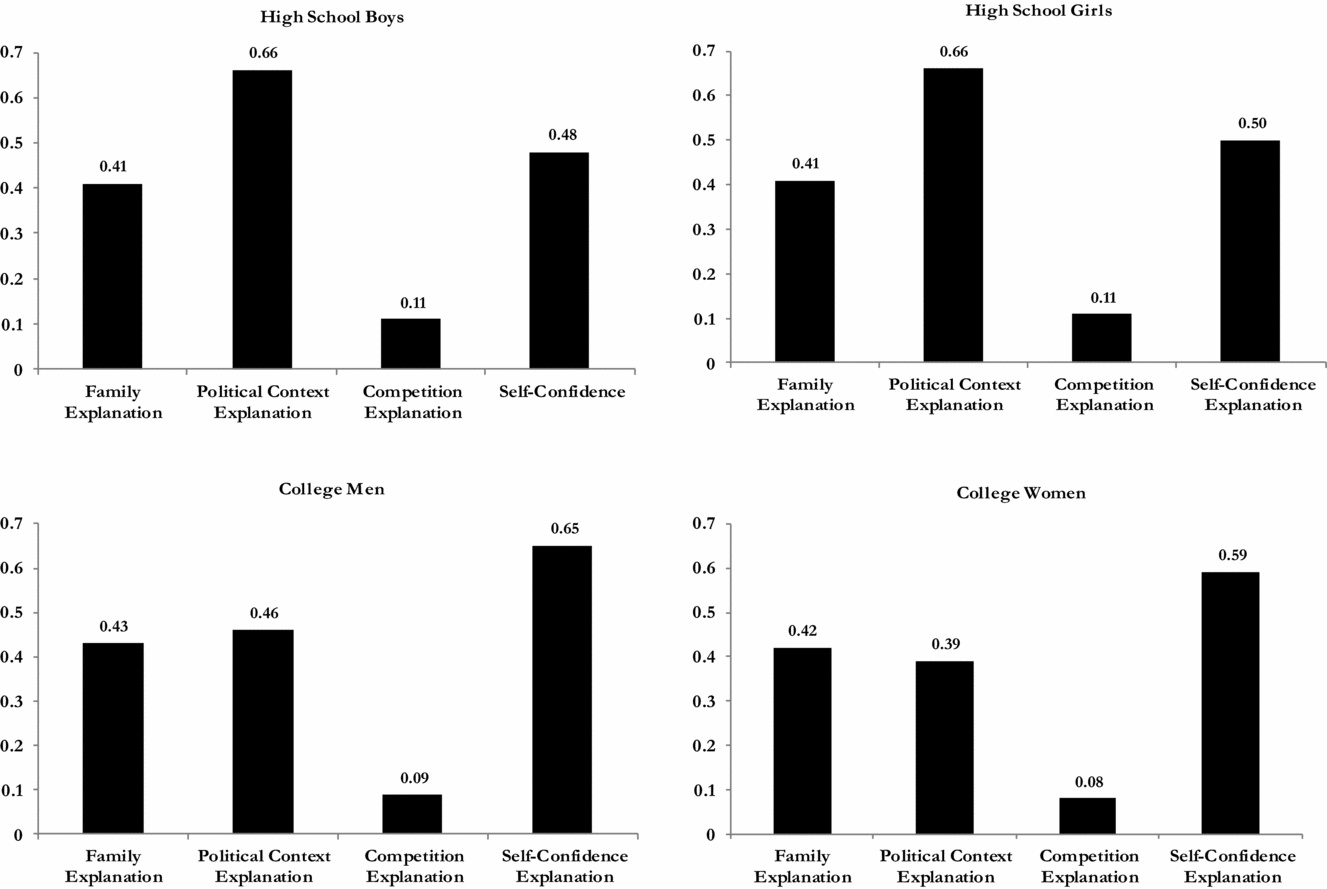
We calculated these probabilities by setting all continuous independent variables to their subsample means and dummy variables to their subsample modes for the three expectations not under consideration. Within each individual expectation, we assessed the maximum change in probability for all statistically significant variables. The Family Explanation probability, for example, is presented as the first bar in each quadrant of Figure 3. The bars reflect the fact that a respondent who was encouraged to run for office by at least one parent and one other family member is between 41 and 43 percentage points more likely than a respondent who received no such encouragement, all else equal, to be open to the idea of running for office later in life.Footnote 13
In addition to family, several other primary agents of political socialization correlate positively with interest in running for office in the future. Navigating a more politicized environment generates a similarly powerful impact. Consider the effect of media habits. On average, a college respondent who visits political websites every day is almost twice as likely as one who rarely or never consults such sites to be interested in running for office (0.46 compared to 0.25 predicted probability); high school students receive a nearly 30 percentage point boost. Further, high school respondents who frequently discuss politics with their friends are 13 percentage points more likely than those who do not to express ambition to run for office.
Beyond these classic agents of socialization, the regression results make clear that experiences with competition, as well as an overall sense of confidence in one's own abilities, are associated with heightened levels of political ambition. Running for student government, for instance, confers the same substantive effect for college students as does participating in mock trial or the debate team for high school students. In each case, the competitive experience raises a respondent's likelihood of being open to the idea of running for office by 10 percentage points. A sense of confidence exerts the largest relative effect on political ambition for the college subsample and the second largest effect for the high school subsample. More specifically, college-age respondents who contend that, at some point in the future, they will know enough to run for office are approximately 58 percentage points more likely than those who doubt their future knowledge to express interest in a candidacy. High school students receive a roughly 40 percentage point boost.
Whereas the importance of Family Socialization and Competitive Experiences tend to affect high school and college students’ ambition comparably, the data presented in Figure 3 demonstrate that Political Context is the most important explanation for high school students’ interest in running for office, but Self-Confidence is the largest relative predictor for college students. Across the board, however, young people's political ambition is related to and shaped by a variety of experiences, traits, and activities early in life. Our evidence suggests—not based on retrospective assessments, but rather, in real time—that these circumstances leave an important imprint, as they affect the educational, professional, and political decisions women and men will make later in life.
Accounting for the Gender Gap in Ambition
The socializing effects of early life experiences are important not only because they help us understand what types of young people are interested in running for office, but also because they account for the gender gap in high school and college students’ political ambition that we uncovered at the bivariate level. In no equation does the sex of the respondent achieve statistical significance.Footnote 14 And the same variables are significant when we analyze the subsamples of women and men separately (results not shown).
The statistically insignificant coefficients on sex, however, must be interpreted in light of the significant gender differences in the variables that affect political ambition. Once we account for gender differences in these factors, male and female respondents are not equally likely to express interest in running for office. More specifically, when we generate a baseline predicted probability for the “average” high school boy (based on the regression equation presented in Table 2, column 2), the typical respondent has a 0.23 predicted probability of being open to running for office later in life.Footnote 15 We calculated the probability by setting all explanatory and control variables to the means and modes for the male high school subsample. High school girls, on average, have a 0.20 predicted probability of expressing interest in running for office in the future. The small gender gap between high school boys and girls, therefore, is an artifact of male and female respondents not being similarly situated on key factors associated with political ambition.
Gender differences are more striking when we turn to the college students in the sample. Again, even though the coefficient on sex is statistically insignificant, embedded within the probabilities are gender differences in respondents’ family socialization, political environments, competitive experiences, and self-confidence. Setting these values to their subsample means and modes results in an average female college student with a 0.19 predicted probability of being open to running for office in the future. College men have an average predicted probability of 0.33, which means that they are approximately 74% more likely than college women to express political ambition (we analyze and discuss these differences in the next section).
Young women and men arrive at their ambition similarly, and they rely on the same factors when considering a future in politics. But women are not as likely as men to possess the ingredients associated with interest in running for office.
Identifying When the Gender Gap in Political Ambition Materializes
Our analysis allows us to assert with some degree of specificity when the gender gap in ambition fully materializes. The baseline probabilities described above highlight that gender differences in interest in running for office are more substantial among college than high school students. The data presented in Table 3 shed light on the underlying reasons for this finding; the gender differences in the central factors associated with interest in running for office are more pronounced among college than high school students.Footnote 16
Gender Differences in Politically Socializing Forces among High School and College Students
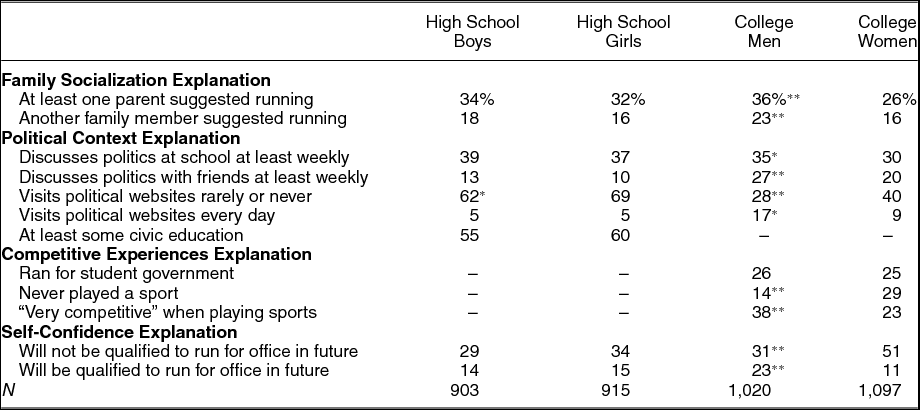
Notes: Number of cases varies slightly, as some respondents omitted answers to some questions. Dashes indicate that the variable was not a statistically significant predictor of political ambition for the subsample (based on the regression equations in Table 2, columns 3 and 4). Levels of significance:** p < .01;* p < .05.
Among high school students, we uncover only one significant gender difference: high school girls are significantly less likely than boys to visit political websites. While we do not want to minimize this difference, it is important to assess it relative to those we find among the college sample. On 10 of the 11 indicators displayed in Table 3, college women are significantly less likely than college men to benefit from the socializing forces, experiences, and characteristics that spur and reinforce political ambition. Compared to women, men in college are roughly one-third more likely to receive encouragement from their parents to run for office, discuss politics regularly with their friends, and consider themselves very competitive. They are almost twice as likely as college women to visit political websites on a regular basis. And more than twice as many men as women are confident that they will be qualified to run for office in the future.
When a college woman possesses the ingredients that contribute to political ambition, however, she is just as likely as her male counterpart to articulate interest in running for office. Consider a female college student who has received encouragement to run for office from her parents, discusses politics regularly with her friends, is competitive when playing sports, visits political websites often, and believes that she will be qualified to run for office in the future. Our models indicate that such a woman has a 0.89 predicted probability of being open to running for office in the future. A college man with comparable experiences has roughly the same likelihood of being politically ambitious (0.92 probability of being open to running for office).Footnote 17 Female college respondents, however, are significantly less likely than men to have these backgrounds.
Without panel data, we are limited in the extent to which we can explain the reason that the gender gap in political ambition is so much larger among college than high school students. We do know, however, that the family circumstances in which both subsamples were raised are comparable, and that the college students report levels of political activity in their homes growing up that match those reported by the respondents still in high school. Thus, the explanation likely lies beyond family socialization and in the personal and academic freedom that college students enjoy compared to their high school counterparts. A majority of college students move out of their parents’ homes to attend college (Sallie Mae 2012), and even when they don’t, their home circumstances often give them more independence. Further, whereas high school curricula generally offer little choice, college provides students with a wide array of academic options and electives. Essentially, when students get to college and “the shackles come off,” young women and men have much greater control over how they spend their time and to what interests they devote themselves.
When this happens, women and men's interests diverge. Recent analyses of gender differences in the selection of college majors reveal that women are more likely than men to major in psychology and sociology, whereas men are more likely to major in business, engineering, and science (Dickson Reference Dickson2010). Our data indicate that men are also more likely than women to immerse themselves in a political context—from course work, to extracurricular activities, to discussions with friends, to media habits. Male respondents were 10% more likely than female respondents to have taken at least one political science or government class, and they were almost twice as likely to join either the College Democrats or College Republicans (gender differences significant at p < .05). This may be a result of the fact that partisan conflict is more likely to promote learning among young men, but young women are more likely to gain information in environments marked by consensus (Wolak and McDevitt Reference Wolak and McDevitt2011). Further, men navigate toward experiences that foster competition; they were more likely than women to play varsity sports (38% of men, compared to 26% of women), as well as intramural sports (37% of men, versus 15% of women) in college (gender differences significant at p < .05). These differences can then fuel men's greater confidence to participate in electoral politics at some point in the future. Given that female respondents’ political ambition is roughly the same in high school as it is in college, the widening of the gender gap appears to be driven by college men coming to embrace politics and the prospects of entering public life. College provides students the opportunity to select the types of classes and activities with which they feel most comfortable—a choice they likely could not make for themselves in high school. Even if many of the seeds of these gender differences are planted in high school, the college atmosphere allows them to flourish.
Beyond having greater autonomy over their interests and activities, college students experience a winnowing of career interests, which coincides with a divergence in women and men's attitudes toward running for office. In an open-ended survey question that asked respondents to identify a specific career interest, twice as many high school students as college students left the question blank. When presented a list of more than 20 jobs to consider as possibilities for the future, college students were roughly 15% more likely than high school students to express interest in only one job. As they narrow their career interests, occupational gender segregation grows. The gender gap in interest in pursuing a career in historically male fields, like science and law enforcement, for instance, is much larger among college than high school students. Similarly, female college students are more likely than female high school students to indicate that they might become teachers and secretaries. The pattern for political positions is consistent with other historically male professions; college men are 50% more likely than college women to be interested in serving as mayor, more than twice as likely to be open to serving in Congress, and three times more likely to be willing to serve as president (gender differences significant at p < .01). No statistically significant differences emerge among high school students’ willingness to occupy these political positions.
Importantly, the choices women and men make about what interests and opportunities to pursue occur on college campuses that are still rife with dynamics that can reinforce traditional gender role orientations. Indeed, evidence of the gendered nature of college campuses has emerged in several disciplines. Researchers have found that the transition to university life diminishes women's self-concept more than it does men’s; the move from the small pond of high school to the larger pond of college may reduce young women's self-assessments of what they can achieve (Jackson Reference Jackson2003). The prospects of parenthood also play a larger role in college women's self-concepts than men's (Devos et al. Reference Devos, Blanco, Rico and Dunn2008). A study of U.S. university students, for instance, found that women and men position themselves differently for careers, parenthood, and marriage, and that these choices account, at least partially, for why women have less prestigious jobs than men upon graduation (Stone and McKee Reference Stone and McKee2000). In addition, academic literatures in education, sociology, and psychology highlight the gendered realities of alcohol consumption, date rape, sexual harassment, and Greek life at American universities, all of which can work to depress women's autonomy (e.g., Armstrong, Hamilton, and Sweeney Reference Armstrong, Hamilton and Sweeney2006; Gmelch Reference Gmelch1998; Stuber, Klugman, and Daniel Reference Stuber, Klugman and Daniel2011). There is little doubt that these dynamics reinforce different roles for women and men in college and play a fundamental role in the “choices” women and men make.
Although we face some data constraints in explaining fully what forces contribute to the differences between high school and college students’ political ambition, our results are vitally important because they allow us to pinpoint the phase of life at which gender differences in interest in running for office materialize.
CONCLUSION
Determining the origins of the gender gap in political ambition is perhaps one of the last critical pieces of the puzzle to understanding gender differences in candidate emergence. This article goes a long way toward shedding light on that puzzle by offering the first in-depth examination of how political socialization, and gendered patterns therein, influence young citizens’ ambition to run for office in the future. We uncover powerful effects of early life experiences; the primary agents of political socialization—family, school, peers, and media—play an integral part in fostering and reinforcing future interest in running for office. In this regard, ambition to run for office is shaped in much the same way by the forces of political socialization as are political interest, activism, ideology, and party affiliation. But beyond these traditional agents of socialization, participation in competitive activities and a general sense of self-confidence correlate with an openness to running for office.
The combined power of these socializing forces is of the utmost importance because they explain the gender gap in ambition. Women and men rely on the same factors when arriving at their sense of political ambition, but young women are less likely than young men to have these experiences on which to rely. This is especially true among college students, for whom the gender gap in political ambition is at least as large as that among professionals in the candidate eligibility pool. Our findings, therefore, speak to the origins of the gender gap and begin to identify the point in the life cycle when it materializes most fully.
Our results suggest that the gender gap in political ambition, as well as the consequences for women's numeric representation, will likely persist. It is critical to note, however, that this is not because young women have less of a sense of civic duty or different aspirations for the future than do men. In fact, when we asked the respondents about their priorities and life goals, we found few gender differences; young women and men were equally likely to want to get married, have children, earn a lot of money, and achieve career success. Male and female respondents were also equally likely to aspire to improve their communities.
Yet despite their similar life goals, women and men reported very different views when asked about the most effective way to bring about societal change. Thirty-five percent of female respondents, compared to 25% of male respondents, viewed working for a charity as the best way to bring about change. On the other hand, 26% of men, but only 17% of women, saw running for elective office as the best way to ameliorate the society in which they live (gender differences statistically significant at p < .01). Women and men both aspire to work to improve the world around them, but women are less likely than men to see political leadership as a means to that end. Our findings, in essence, highlight the importance of deepening our understanding of the manner in which young women and men in contemporary society are still socialized about politics, from where they receive messages about the acquisition of political power, and the characteristics that qualify individuals to seek it.
The results of our study also complement the broader literature pertaining to women's candidate emergence. If we conceptualize the study of women's candidacies as a multistage endeavor, then over the course of the last 15 years, political scientists have provided compelling evidence that gender dynamics are at play at every stage. From the outset, some research finds that the lack of high-profile women in politics limits women's political engagement (see Burns, Schlozman, and Verba Reference Burns, Schlozman and Verba2001; Campbell and Wolbrecht Reference Campbell and Wolbrecht2006). When we turn to the initial decision to run for office, gender differences also emerge. We demonstrate in previous work that female potential candidates are far less likely than their male counterparts to consider a candidacy or to emerge as actual candidates (Lawless and Fox Reference Lawless and Fox2010; Reference Lawless and Fox2005). Patterns of political recruitment regularly fuel the ambition of male candidates, but overlook that of female candidates (Crowder-Meyer Reference Crowder-Meyer2013; Niven Reference Niven1998; Sanbonmatsu Reference Sanbonmatsu2006).
When potential candidates opt to throw their hats into the ring or seek high office, gender dynamics continue to play an important role. Women are more likely than men to emerge as candidates in “women friendly” districts, so they face geographic restrictions that male candidates generally do not confront (Palmer and Simon Reference Palmer and Simon2008). Women are also treated more hospitably by the Democratic party, which means that their electoral fate is linked more to the vagaries of the political climate than men's (see Thomsen Reference Thomsen2012). Gender dynamics are apparent in the development of progressive ambition as well. That is, among state legislators, women and men have different perceptions about the desirability of serving in higher office (Fulton et al Reference Fulton, Maestas, Maisel and Stone2006). Women are also more likely than men to depart from Congress prematurely when they hit a “career ceiling” and can no longer affect the legislative agenda. And the women who depart voluntarily from Congress are less likely than similarly situated men to seek higher office (Lawless and Theriault Reference Lawless and Theriault2005).
At all phases of the candidate emergence process, then, gender interacts and intersects with political ambition. But whereas previous research on the gender gap in political ambition focuses on how the gap manifests itself, our findings indicate that, starting at a young age, men's political interest, discussion, and ambition are piqued in a way that women's are not. Future research may want to home in on the college experience and the manner in which newfound independence exacerbates the gender disparity in political ambition. Scholars may also want to explore further the structural remedies that could alter the situation. Our results, working in concert with findings from other studies, suggest that recruitment efforts targeted toward women and campaign schools and training programs for female candidates are the best short-term remedy to counter the deeply embedded patterns of traditional gender socialization that contribute to the gender gap in political ambition. Of course, given gendered patterns of political recruitment, these structural remedies are contingent on electoral gatekeepers’ deliberate and systematic efforts to change the status quo—efforts that have been fleeting throughout recent election cycles.
Ultimately, this study makes clear that we still have a long way to go before women and men will express equal interest in and comfort with the idea of running for office. Only by continuing to examine these gender differences in real time, as opposed to relying on retrospective assessments of events that occurred decades earlier, can we get at the source of the gender gap—a gender gap that carries important implications for democratic legitimacy and political representation.
Sample Demographics
Variable Description

APPENDIX C. The Gender Gap in Political Ambition among High School versus College Students
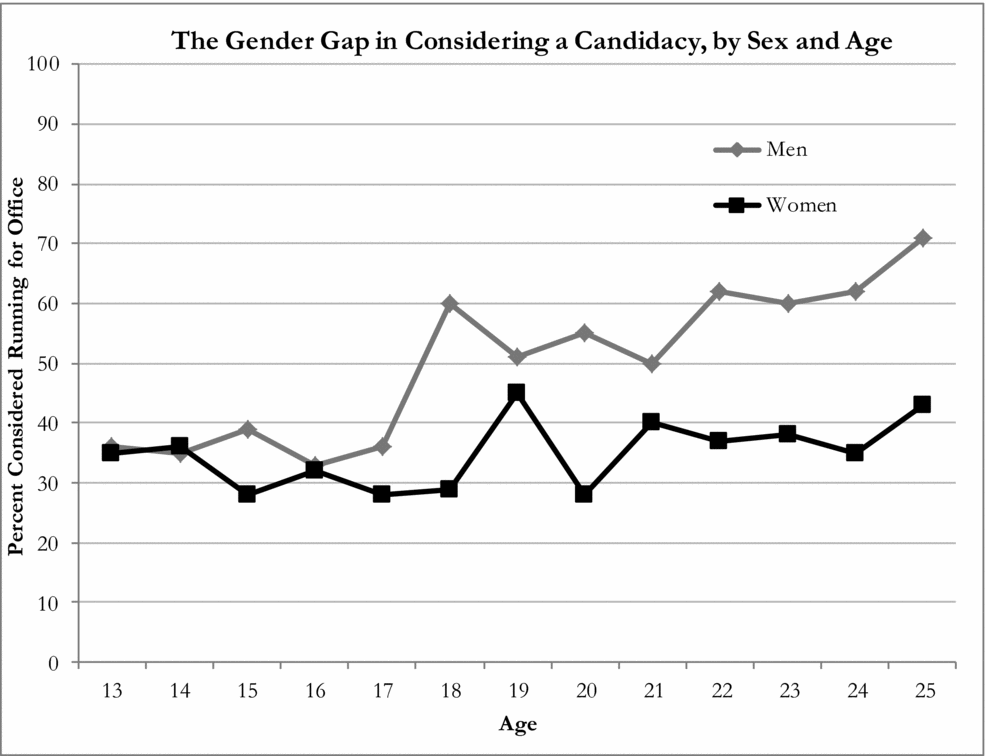
Our examination of the size of the gender gap by respondent age indicates that grouping the data by high school and college students is an appropriate way to conduct the analysis. There is very little variation during the high school years (all high school respondents were between the ages of 13 and 17). For three of the five ages in the high school sample, there is virtually no gender difference in considering a candidacy; for two of the years (ages 15 and 17), there are gender gaps. The data reveal, however, that there is no discernible pattern and that the changes in the size of the gap are not linear.
The gender gap is much more dramatic in college, and this seems to be the case from early in the college experience. Again, although there are some fluctuations in the size of the gap between the ages of 18 and 25, for six of the eight ages within the college subsample, the gender gap is at least 22 percentage points. And although it is smaller for 19 and 21 year olds, there is, once again, no systematic pattern to account for these differences.
The Substantive Effect (Maximum Change in Probability) of Each Explanation on Political Ambition, by Sex and Sample




Comments
No Comments have been published for this article.