Implications
Given the importance of CH4 as an anthropogenic greenhouse gas, the quantification of emissions is important to better understand and mitigate them. The present study investigated the relationships between milk fatty acids and enteric CH4 emissions in lactating dairy cows fed different types of forage. The wide range of forage species used in the present data set is expected to represent equally diverse feeding conditions present in dairy farms. Thus, the CH4 prediction models here proposed could be applicable to commercial conditions and aid in the effort to estimate CH4 emissions.
Introduction
In addition to its relevance in terms of environmental impact, CH4 resulting from digestive processes in ruminants represents important dietary energy losses (Kebreab et al., Reference Kebreab, Johnson, Archibeque, Pape and Wirth2008), which can vary depending on several dietary factors (Ramin and Huhtanen, Reference Ramin and Huhtanen2013). However, direct measurements of CH4 are difficult to perform under regular farm conditions, and therefore, the development of prediction equations to estimate CH4 output has garnered considerable interest over the course of more than one decade (Benchaar et al., Reference Benchaar, Rivest, Pomar and Chiquette1998; Vlaeminck and Fievez, Reference Vlaeminck and Fievez2005; Ramin and Huhtanen, Reference Ramin and Huhtanen2013).
Several factors are known to affect CH4 output, including dietary constituents such as carbohydrates, lipids and ionophores, all of which can potentially affect the predominant ruminal microbial population (Johnson and Johnson, Reference Johnson and Johnson1995; Sauer et al., Reference Sauer, Fellner, Kinsman, Kramer, Jackson, Lee and Chen1998; Weimer et al., Reference Weimer, Stevenson and Mertens2010). However, dry matter intake (DMI) is considered to be a major factor explaining CH4 emissions, and equations often include it as a predictor (Benchaar et al., Reference Benchaar, Rivest, Pomar and Chiquette1998; Ramin and Huhtanen, Reference Ramin and Huhtanen2013). Milk fatty acid (FA) profile can reflect changes in absorbed FA composition, which in turn is affected by ruminal metabolism of lipids, including lipolysis, biohydrogenation (BH) and microbial synthesis (Fievez et al., Reference Fievez, Colman, Castro-Montoya, Stefanov and Vlaeminck2012), and may thus predict important changes in the ruminal environment. Therefore, several studies have reported prediction models for CH4 output using milk FA profile. However, prediction equations are often obtained from experiments in which dietary components such as oils are evaluated (Chilliard et al., Reference Chilliard, Martin, Rouel and Doreau2009; Mohammed et al., Reference Mohammed, McGinn and Beauchemin2011), which may not be representative of commonly fed forage-based diets. Importantly, Chung et al. (Reference Chung, He, McGinn, McAllister and Beauchemin2011) reported that dietary inclusion of linseed as a source of polyunsaturated fatty acid (PUFA) was associated with decreased CH4 output in dairy cows when fed barley silage-, but not when fed grass hay-based diets, suggesting an important interaction with forage type, which may make prediction equations only relevant in certain scenarios. Others have reported the associations between CH4 and milk FA across experiments using different dietary fat sources with potential negative effects on ruminal microorganisms, such as PUFA and medium-chain fatty acid (MCFA), or across different forages (Castro-Montoya et al., 2011; Dijkstra et al., Reference Dijkstra, van Zijderveld, Apajalahti, Bannink, Gerrits, Newbold, Perdok and Berends2011; van Lingen et al., Reference van Lingen, Crompton, Hendriks, Reynolds and Dijkstra2014). It is therefore possible that these associations between CH4 and milk FA profile might not apply when diets do not include such dietary fat supplements. Moreover, Mohammed et al. (Reference Mohammed, McGinn and Beauchemin2011) evaluated a set of previously published models (Chilliard et al., Reference Chilliard, Martin, Rouel and Doreau2009; Dijkstra et al., Reference Dijkstra, van Zijderveld, Apajalahti, Bannink, Gerrits, Newbold, Perdok and Berends2011) and reported a mean overestimation of CH4 ranging from 19% to 61%, thus evidencing the difficulty in the application of some models to predict CH4 emissions.
Although the number of different FA present in milk has been estimated to be >400, routine separation of all these FA is technically demanding and most analyses only identify a small fraction of them (Jensen, Reference Jensen2002). Consequently, it is likely that different prediction models would result from the association of CH4 to other milk FA, which are not commonly identified.
The objective of the present study was to investigate the relationships between a wide range of milk FA and enteric CH4 emissions in lactating dairy cows using individual observations from cows fed different forage species.
Material and methods
Data set description
A total of 81 observations from three 3×3 Latin square design (32-day periods) experiments (Hassanat et al., Reference Hassanat, Gervais, Julien, Masse, Lettat, Chouinard, Petit and Benchaar2013 and Reference Hassanat, Gervais, Masse, Petit and Benchaar2014; Benchaar et al., Reference Benchaar, Hassanat, Gervais, Chouinard, Petit and Masse2014) using a total of 27 (n=9/experiment) lactating cows (96±27 days in milk; mean±SD) were used. All experiments were conducted at the Dairy and Swine Research and Development Centre, Sherbrooke, Quebec, Canada, and all animal procedures were approved by the local Animal Care Committee in agreement with the guidelines of the Canadian Council on Animal Care (Reference Castro-Montoya, Bhagwat, Peiren, De Campeneere, De Baets and Fievez1993).
Dietary forages included at 60% of ration dry matter (DM) were as follows: (1) 100% corn silage (n=18), (2) 100% alfalfa silage (n=18), (3) 100% barley silage (n=9), (4) 100% timothy silage (n=9), (5) 50 : 50 mix of corn and alfalfa silages (n=9), (6) 50 : 50 mix of barley and corn silages (n=9) and (7) 50 : 50 mix of timothy and alfalfa silages (n=9). All cows were housed in a tie-stall barn, had continuous access to water and were fed ad libitum in two equal servings at 0900 and 1930 h.
Experimental measurements
All feed analyses and experimental measurements were performed after a 2-week adaptation period to diet as previously described (Hassanat et al., Reference Hassanat, Gervais, Julien, Masse, Lettat, Chouinard, Petit and Benchaar2013 and Reference Hassanat, Gervais, Masse, Petit and Benchaar2014; Benchaar et al., Reference Benchaar, Hassanat, Gervais, Chouinard, Petit and Masse2014). Enteric CH4 output was measured for each cow during 3 consecutive days using individual respiration chambers as described by Hassanat et al. (Reference Hassanat, Gervais, Julien, Masse, Lettat, Chouinard, Petit and Benchaar2013). Cows were milked twice daily at 0700 and 1900 h in their respective stalls and milk was sampled from each cow at each milking and stored at −20°C without preservative until analyzed for FA composition. Milk lipids were extracted and methylated according to the study by Chouinard et al. (Reference Chouinard, Lévesque, Girard and Brisson1997). FAs were quantified in a gas chromatograph (7890 A GC; Agilent Technologies Canada, Inc., Mississauga, ON, Canada) equipped with a 100-m CP-Sil 88 capillary column (0.25-mm i.d., 0.20-μm film thickness; Agilent Technologies Canada Inc.) and a flame ionization detector. Co-eluting peaks were separated and identified using a set of three different temperature programs as described by Kramer et al. (Reference Kramer, Hernandez, Cruz-Hernandez, Kraft and Dugan2008) with modifications (Boivin et al., Reference Boivin, Gervais and Chouinard2013). Most FA peaks were identified and quantified using either a quantitative mixture or pure methyl ester standards (Larodan Fine Chemicals, Solna, Sweden; Sigma-Aldrich Canada Ltd, Oakville, ON, Canada; Matreya LLC, Pleasant Gap, PA, USA; Nu Chek Prep, Elysian, MN, USA). cis9, trans11, cis15-18:3 was identified using a qualitative standard obtained from Naturia, Inc. (Sherbrooke, QC, Canada). Given no quantitative standard was available, the peak response factor for cis9, 12, 15-18:3 was used to adjust the peak areas of this isomer. The 18:1 and 18:2 isomers for which standards were not commercially available were identified by order of elution according to the studies by Precht et al. (Reference Precht, Molkentin, McGuirre, Jensen and McGuire2001) and Kramer et al. (Reference Kramer, Hernandez, Cruz-Hernandez, Kraft and Dugan2008), and the response factors for cis9-18:1 and cis9, 12-18:2 were used to quantify these peaks, respectively. A partial chromatogram of this region is shown in Supplementary Figure S1.
Statistical analysis
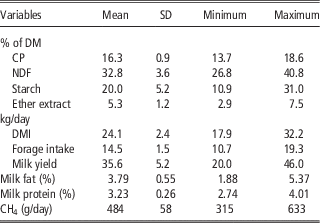
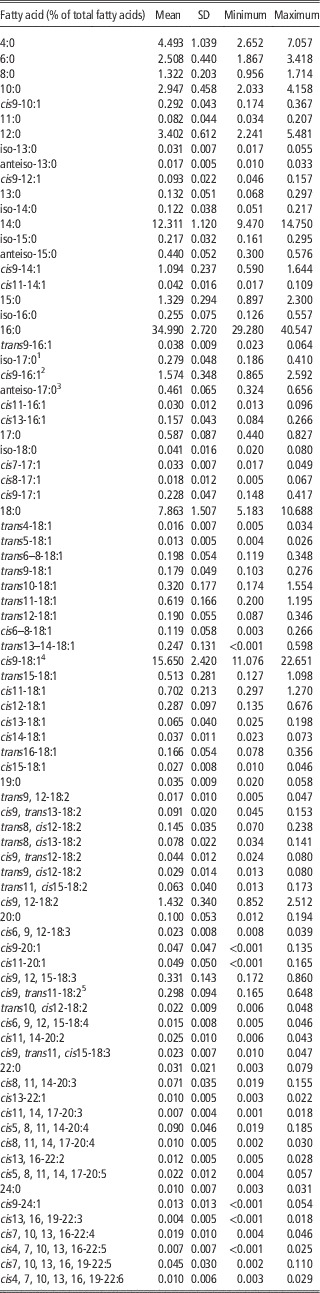
Test variables included the chemical composition (CP, NDF, starch and ether extract (EE); % of DM) of dietary treatments, daily DMI, daily milk yield (Table 1), and 83 individual milk FA and FA sums (Table 2). Associations between test variables and CH4 were analyzed using the CORR procedure of SAS (The SAS Institute, Inc., Cary, NC, USA). The GLMSELECT procedure was used to identify a set of candidate models using the Least Absolute Shrinkage and Selection Operator (LASSO; Tibshirani, Reference Tibshirani1996) and Least Angle Regression (LARS; Efron et al., Reference Efron, Johnstone, Hastie and Tibshirani2004) methods by the Schwarz Bayesian Criterion (SBC). Three sets of variables were used for model selection. The first set included individual milk FA, milk yield, DMI and dietary components, whereas the second set included the same variables in addition to FA sums. The last set included dietary components and milk FA, but not milk yield or DMI. For highly correlated test variables, the variable with the highest association with CH4 was kept in the data set (Supplementary Table S1). Selected models were initially evaluated in Prog REG in terms of multicollinearity (variance inflation factor >10), high influence and leverage observations by DFFITS (>
 $2\sqrt {p/n} $
; where p is the number of parameters estimated in the model and n the number of observations) and Cook’s distance (>4/n), and homoscedasticity by the normality of the residuals. Selected models were then fitted into separate random regressions using the MIXED procedure of SAS accounting for the random effects of cow, period and study. In addition to the random effects, each model included the selected test variables as fixed effects. Cow was the subject of the repeated statement, and the model included a random intercept. The VC and UN covariance structures provided best fit for the random and repeated statements, respectively. Denominator degrees of freedom were calculated by the Satterthwaite equation. The associations between observed CH4 output and the values predicted by each model were evaluated by linear regression. In addition, prediction bias was assessed by regressing residuals against predicted values (St-Pierre, Reference St-Pierre2003). For each model, predicted values were centered around their mean value and used as an independent variable as provided in the following equation:
 $$e_{i} =b_{0} {\plus}b_{{\rm 1}} \left( {X_{i} -{\rm }\bar{X}} \right){\plus} e\!\!{\vskip -1ptˇ}_{i} $$
Descriptive statistics of diet composition, production variables and CH4 output of a data set including 81 observations from 27 lactating Holstein dairy cows fed various forage sources

DM=dry matter; DMI=dry matter intake.
Descriptive statistics of milk fatty acids of a data set including 81 observations from 27 lactating Holstein dairy cows fed various forage sources

1 Co-elution with minor concentration of trans10-16:1.
2 Co-elution with minor concentration of trans13-16:1.
3 Co-elution with minor concentration of cis10-16:1.
4 Co-elution with minor concentration of cis10-18:1.
5 Co-elution with minor concentration of trans7, cis9-18:2.
where e
i
is the model estimated residual, b
0, b
1 the intercept and the slope, respectively, X
i
the i
th predicted value of CH4,
 $$\bar{X}$$
the mean of all predicted values and ě
i
the error term.
The intercept, at the mean value of the regressor, was used to asses overall model bias, whereas the slope was used to determine the linear bias. The significance of both measures of model bias was determined by their respective t tests. The maximum bias for each model was determined using equation (1) with the minimum and maximum model predicted values as inputs and judged relative to the standard error (St-Pierre, Reference St-Pierre2003). In addition, the root mean squared prediction error (RMSPE) estimated from the difference between observed and model predicted values was used to further evaluate candidate models. Decomposition of mean squared prediction error (MSPE) into ECT (error due to overall prediction bias), ER (error due to linear bias) and ED (error due to random variation) was performed according to the study by Bibby and Toutenburg (Reference Bibby and Toutenburg1977).
Results and discussion
The data set used in the present study comprised individual cow observations from three separate Latin square design experiments feeding a range of forages including corn, alfalfa, barley, or timothy silages or 50 : 50 mixes of corn and alfalfa, barley and corn, or timothy and alfalfa silages, reflecting a wide range of dietary conditions even though all forages were included at 60% of ration DM. The dietary concentrations of CP, NDF, starch and EE were (% of DM; mean±SD) 16.3±0.9%, 32.8±3.6%, 20.0±5.2% and 5.3±1.2%, respectively (Table 1). The small SD around the mean indicated most of the data were within a small range, despite the wide spread of values (i.e. minimum and maximum values).
Similarly, the data set also included a wide range of values for DMI, forage intake, milk yield, milk fat concentration, milk protein concentration and CH4 output, averaging 24.1±2.4 kg/day, 14.5±1.5 kg/day, 35.6±5.2 kg/day, 3.79±0.55%, 3.23±0.26% and 484±58 g/day, respectively. In addition, the concentration of 83 individual milk FA and several groups of FA, which were also evaluated as predictors of CH4, exhibited a great range of values, probably reflecting the differences in diet composition and individual cow variation (Table 2). In contrast to the current data set where dietary treatments included a range of forage types and no oil supplementation, previous studies that have evaluated the associations between similar types of test variables and CH4 comprised observations from experiments in which FA with potent effects on ruminal flora and fermentation (e.g. MCFA or PUFA) were used (Chilliard et al., Reference Chilliard, Martin, Rouel and Doreau2009; Dijkstra et al., Reference Dijkstra, van Zijderveld, Apajalahti, Bannink, Gerrits, Newbold, Perdok and Berends2011; Mohammed et al., Reference Mohammed, McGinn and Beauchemin2011; van Lingen et al., Reference van Lingen, Crompton, Hendriks, Reynolds and Dijkstra2014).
Associations between test variables and CH4 output
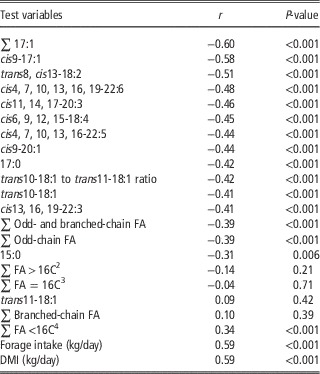
Previous studies reported stronger correlations between CH4 output and milk FA within subsets (i.e. within dietary treatments) compared with complete data sets (i.e. across treatments), suggesting an important effect of specific dietary nutrients on CH4 predictors (Chilliard et al., Reference Chilliard, Martin, Rouel and Doreau2009; Mohammed et al., Reference Mohammed, McGinn and Beauchemin2011). The approach of the current study aimed at describing the associations between milk FA and enteric CH4 across several dietary forages or forage combinations, thus expecting applicability in a wide range of dairy farms. The nature of the associations between CH4 and specific milk FA, or FA groups, are expected to reflect the characteristics of ruminal fermentation, as affected by dietary ingredients or nutrients. Similarly to the studies by Mohammed et al. (Reference Mohammed, McGinn and Beauchemin2011) and Castro-Montoya et al. (2011), we observed moderate negative associations between CH4 output and cis9-17:1, 17:0 and 15:0 in milk fat (Table 3). Compared with acetate production, which liberates hydrogen, ruminal synthesis of propionate uses hydrogen, thus reducing availability of hydrogen for CH4 synthesis (Moss et al., Reference Moss, Jouany and Newbold2000). Accordingly, as both 15:0 and 17:0 originate de novo from ruminal propionate (French et al., Reference French, Bertics and Armentano2012), and cis9-17:1 from mammary desaturation of 17:0 (Fievez et al., Reference Fievez, Vlaeminck, Dhanoa and Dewhurst2003), these FA are expected to be negatively correlated with CH4 output. In contrast to our observations, Dijkstra et al. (Reference Dijkstra, van Zijderveld, Apajalahti, Bannink, Gerrits, Newbold, Perdok and Berends2011) and van Lingen et al. (Reference van Lingen, Crompton, Hendriks, Reynolds and Dijkstra2014) found no significant association between CH4 and 15:0 or 17:0. In addition, when feeding cows with linseed supplemented diets, Chilliard et al. (Reference Chilliard, Martin, Rouel and Doreau2009) reported strong positive correlations between 15:0 and 17:0 milk FA and CH4.
Correlations between CH4 (g/day) and test variables (% of total fatty acid (FA) unless otherwise specified)Footnote 1 from a data set including 81 observations from 27 lactating Holstein dairy cows fed various forage sources

1 Correlations >0.4 or <−0.4, and those most biologically relevant are shown. A full list of correlations is shown in Supplementary Table S1.
2 From circulation (preformed).
3 Both from circulation and from de novo mammary synthesis.
4 From de novo mammary synthesis.
The predominant FA BH pathways can serve as indicators of the effects of diet on ruminal microbes (Lourenço et al., Reference Lourenço, Ramos-Morales and Wallace2010). Importantly, shifts in ruminal bacteria and BH intermediates (i.e. elevations in the concentration of milk trans10-18:1 at the expense of trans11-18:1) are caused by low ruminal pH (Qiu et al., Reference Qiu, Eastridge, Griswold and Firkins2004; Fuentes et al., Reference Fuentes, Calsamiglia, Cardozo and Vlaeminck2009), or by a direct toxic effect of PUFA on bacteria (Bauman and Griinari, Reference Bauman and Griinari2001; Maia et al., Reference Maia, Chaudhary, Figueres and Wallace2007). In agreement with previous studies (Chilliard et al., Reference Chilliard, Martin, Rouel and Doreau2009; Mohammed et al., Reference Mohammed, McGinn and Beauchemin2011), trans10-18:1 was negatively associated with CH4 in the present study, whereas trans11-18:1 was not correlated (Table 3). Interestingly, when this association was measured as the ratio of trans10-18:1 : trans11-18:1, there was no meaningful change in the correlation coefficient. Others have also reported the sum of trans10-18:1 and trans11-18:1 to be inversely associated with CH4 output (Dijkstra et al., Reference Dijkstra, van Zijderveld, Apajalahti, Bannink, Gerrits, Newbold, Perdok and Berends2011; van Lingen et al., Reference van Lingen, Crompton, Hendriks, Reynolds and Dijkstra2014), although this may preclude from evidencing the effect of shifts in ruminal BH pathways, when related to ruminal fermentation and CH4 formation.
The concentrations of several n-3 FA were negatively correlated with CH4 output, including cis4, 7, 10, 13, 16, 19-22:6, cis11, 14, 17-20:3, cis6, 9, 12, 15-18:4, cis4, 7, 10, 13, 16-22:5 and cis13, 16, 19-22:3 (Table 3). In addition, trans8, cis13-18:2, trans8, cis12-18:2 and cis9-20:1 were also negatively correlated with CH4 output. In general, dietary PUFA are expected to be negatively associated with CH4, as high concentrations of these FA reduce fiber digestibility and thus do not favor CH4 formation (Patra, Reference Patra2013). This could be the result of the inhibition of growth of more sensitive species of ruminal bacteria when exposed to PUFA (Maia et al., Reference Maia, Chaudhary, Figueres and Wallace2007). The forementioned milk long-chain n-3 FA could originate from post-absorptive elongation of 18:3 n-3 present in feeds, although this process is thought to be very inefficient in dairy cows (Hagemeister et al., Reference Hagemeister, Franzen, Barth and Precht1991).
Milk fat concentration of trans8, cis13-18:2 presented one of the strongest negative correlations with CH4 in the current data set. However, this FA is not routinely measured, and reports about its link with CH4 are non-existent to our knowledge. Possibly downstream in the same BH pathway, cis13-18:1 or trans8-18:1 could be indicators of ruminal BH of this FA. In line with this, we observed negative associations between both cis13-18:1 and trans6–8-18:1 with CH4 output (Supplementary Table S1), as have others (Chilliard et al., Reference Chilliard, Martin, Rouel and Doreau2009; Mohammed et al., Reference Mohammed, McGinn and Beauchemin2011; van Lingen et al., Reference van Lingen, Crompton, Hendriks, Reynolds and Dijkstra2014).
Only few milk FA were positively correlated with CH4, including 10:0, cis11-14:1, 12:0 and total de novo synthesized (r=0.34 to 0.38; Supplementary Table S1). In agreement, positive associations between CH4 and 10:0, 12:0 and FA <16C have been reported previously (Chilliard et al., Reference Chilliard, Martin, Rouel and Doreau2009; van Lingen et al., Reference van Lingen, Crompton, Hendriks, Reynolds and Dijkstra2014). On the contrary, cis11-14:1 is not commonly reported, and its association with CH4 is largely unknown. Castro-Montoya et al. (2011) reported that iso-14:0, iso-15:0 and iso-16:0 FA, which are more abundant in fibrolytic bacteria (Vlaeminck et al., Reference Vlaeminck, Fievez, Cabrita, Fonseca and Dewhurst2006) were positively related to estimated CH4 output. In the present study, only iso-16:0 was positively correlated to CH4 output, whereas iso-14:0 tended to be positively correlated (P=0.07; Supplementary Table S1). In addition, total branched-chain FA were not significantly correlated with CH4. Others have also reported positive associations between CH4 and iso-16:0 (Chilliard et al., Reference Chilliard, Martin, Rouel and Doreau2009; van Lingen et al., Reference van Lingen, Crompton, Hendriks, Reynolds and Dijkstra2014) and between CH4 and iso-14:0 (van Lingen et al., Reference van Lingen, Crompton, Hendriks, Reynolds and Dijkstra2014). CH4 output is known to increase with DMI, and in agreement with previous reports, both forage intake and DMI were the test variables more strongly and positively correlated to CH4 (Mohammed et al., Reference Mohammed, McGinn and Beauchemin2011; Ramin and Huhtanen, Reference Ramin and Huhtanen2013).
Regression analyses
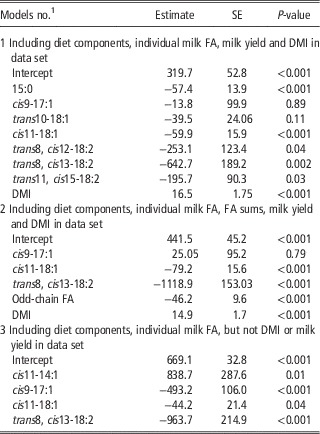
Using three sets of test variables, three candidate models were obtained by LASSO and LARS selection methods based on the SBC (Table 4). The first set included the concentrations of all individual milk FA, milk yield, and DMI, and the selected variables were 15:0, cis9-17:1, trans10-18:1, cis11-18:1,trans8, cis12-18:2, trans8, cis13-18:2, trans11, cis15-18:2 and DMI, where all variables except for DMI were negatively related to CH4 output. The second set included the concentrations of milk FA groups, in addition to those included in the first set, and selected variables were cis9-17:1, cis11-18:1, trans8,cis13-18:2, odd-chain FA and DMI, and similarly to model no. 1, only DMI was positively associated to CH4. The third data set included only the concentrations of individual milk FA, without DMI or milk yield, and predictor variables selected were cis11-14:1, cis9-17:1, cis11-18:1 and trans8, cis13-18:2, where all selected FA were negatively associated with CH4 except for cis11-14:1, which was positively related with CH4.
Selected candidate models for prediction of CH4 (g/day) output obtained by Least Absolute Shrinkage and Selection Operator and Least-Angle Regression methods based on the Schwarz Bayesian Criterion (SBC) from a data set including 81 observations from 27 lactating Holstein dairy cows fed various forage sources

FA=fatty acid; DMI=dry matter intake.
1 Regression estimates, standard errors and P-values from the mixed model including the random effects of cow, period and study. Root mean squared error, R 2 and SBC score obtained by Prog REG for models nos 1 to 3 were 27.2, 0.80 and 565.2, 29.3, 0.76 and 567.4, and 38.6, 0.58 and 608.8, respectively.
Milk fat concentrations of cis9-17:1,cis11-18:1 and trans8,cis13-18:2 were all negatively related to CH4 emissions and were common to all candidate models. A few of these predictors have been previously included in regression equations estimating CH4 output. Similarly to models nos 1 to 3 in the present study, cis9-17:1 was included in the best fit equation by Mohammed et al. (Reference Mohammed, McGinn and Beauchemin2011), and cis11-18:1 was included in that reported by Dijkstra et al. (Reference Dijkstra, van Zijderveld, Apajalahti, Bannink, Gerrits, Newbold, Perdok and Berends2011). To our knowledge, no previous studies have reported prediction models including trans8, cis13-18:2, and its selection in the current candidate models suggests an important role in the prediction of CH4, which should be further studied. Milk fat concentration of trans10-18:1 was selected in model no. 2, and given its known link to altered ruminal BH pathways as a result of low dietary fiber and excess PUFA (Rico and Harvatine, Reference Rico and Harvatine2013), this FA could be an important predictor of CH4. Previous equations have included the sum of trans10-18:1 and trans11-18:1 as a predictor of CH4 (Dijkstra et al., Reference Dijkstra, van Zijderveld, Apajalahti, Bannink, Gerrits, Newbold, Perdok and Berends2011; van Lingen et al., Reference van Lingen, Crompton, Hendriks, Reynolds and Dijkstra2014).
Previous studies have predicted CH4 output per kilogram of DMI (Dijkstra et al., Reference Dijkstra, van Zijderveld, Apajalahti, Bannink, Gerrits, Newbold, Perdok and Berends2011; van Lingen et al., Reference van Lingen, Crompton, Hendriks, Reynolds and Dijkstra2014), or using DMI or forage intake as predictors (Chilliard et al., Reference Chilliard, Martin, Rouel and Doreau2009; Mohammed et al., Reference Mohammed, McGinn and Beauchemin2011). Although DMI is a major determinant of CH4 emissions (Ramin and Huhtanen, Reference Ramin and Huhtanen2013), this parameter is difficult to assess in dairy farms, in particular individual DMI values, which are harder to determine compared with group level intakes. Therefore, model no. 3, which predicts CH4 without the use of DMI measurements could potentially be of higher practical value.
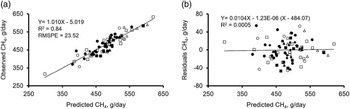
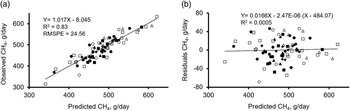
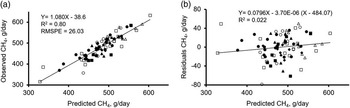
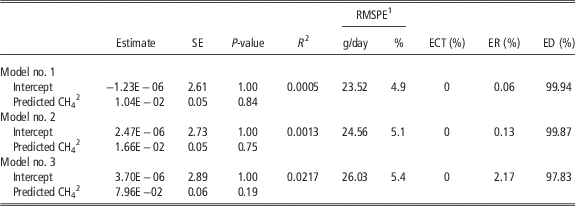
Based on the highest coefficients of determination, and lowest RMSE and SBC values for the three candidate models before correction for random effects (Table 4), the best fit was observed for model no. 1, followed by model no. 2 and then model no. 3. Using the observations from a single experiment, Chilliard et al. (Reference Chilliard, Martin, Rouel and Doreau2009) reported an R 2 of 0.95 for the best fit equation. In the present study, the R 2 after correction for cow, period and study effects in the mixed model were 0.84, 0.83 and 0.80, respectively (predicted v. observed values; Figures 1 to 3, panel a). Interestingly, R 2 values for the same models before correcting for cow, period and study effects were 0.80, 0.76 and 0.58, respectively (Table 4). This suggests that, particularly for model no. 3, a great portion of the variation was explained by these random effects. The origin of this variation is unknown. However, it could be related to the predominant microbial population of each animal, which would influence the ruminal fermentation processes. The R 2 of all three models are similar to those previously reported by Mohammed et al. (Reference Mohammed, McGinn and Beauchemin2011) from a single experiment, and higher than those reported by Dijkstra et al. (Reference Dijkstra, van Zijderveld, Apajalahti, Bannink, Gerrits, Newbold, Perdok and Berends2011) and van Lingen et al. (Reference van Lingen, Crompton, Hendriks, Reynolds and Dijkstra2014) using observations from multiple experiments. In agreement with the highest R 2 observed for model no. 1, RMSPE was the lowest for this model, indicating a smaller difference between observed and model predicted values compared with models nos 2 and 3. For all candidate models, the plots of the residual by predicted values (centered around the mean) were used as indicators of prediction bias (Figures 1 to 3, panel b; St-Pierre, Reference St-Pierre2003). Based on equation (1), the intercepts of these plots were not different from 0 (P=1.0; Table 5), indicating absence of overall prediction bias. Similarly, based on the slopes, the maximum linear bias was calculated to be <13 g/day across all models, but was not significant (P>0.19 for all slopes). The lack of prediction bias and high association between predicted and observed values suggest high performance and validity of the models here proposed to predict CH4 emissions in dairy cows. In addition, decomposition of the MSPE indicated that most of the error (>97% of total MSPE in all models) was associated to random variation and not to mean or regression bias. However, further validation against independent data sets is encouraged, in particular during early lactation, given that the increased adipose tissue mobilization expected during this period could potentially alter milk FA profile and thus the relationships here proposed.
Associations between observed and predicted CH4 output accounting for cow, period and study variation for model no. 1, obtained from a data set including 81 observations from 27 lactating Holstein dairy cows fed various forage sources. Forages were corn silage (□), alfalfa silage (●), barley silage (▲), timothy silage (■), corn–alfalfa silages mix (○), corn–barley silages mix (∆) and timothy–alfalfa silages mix (♦). (a) The association between model predicted and observed values. (b) the residual by predicted plot. The equation in (b) was obtained from the association between residuals and predicted CH4 centered around the mean of predicted values. The mean (−1.23E−06 g/day) and linear (0.0104) biases were not different from 0 (P>0.84). RMSPE=root mean squared prediction error.

Associations between observed and predicted CH4 output accounting for cow, period and study variation for model no. 2, obtained from a data set including 81 observations from 27 lactating Holstein dairy cows fed various forage sources. Forages were corn silage (□), alfalfa silage (●), barley silage (▲), timothy silage (■), corn–alfalfa silages mix (○), corn–barley silages mix (∆) and timothy–alfalfa silages mix (♦). (a) The association between model predicted and observed values. (b) The residual by predicted plot. The equation in (b) was obtained from the association between residuals and predicted CH4 centered around the mean of predicted values. The mean (−2.47E−06 g/day) and linear (0.0166) biases were not different from 0 (P>0.75). RMSPE=root mean squared prediction error.

Associations between observed and predicted CH4 output accounting for cow, period and study variation for model no. 3, obtained from a data set including 81 observations from 27 lactating Holstein dairy cows fed various forage sources. Forages were corn silage (□), alfalfa silage (●), barley silage (▲), timothy silage (■), corn–alfalfa silages mix (○), corn–barley silages mix (∆), timothy–alfalfa silages mix (♦). (a) The association between model predicted and observed values. (b) The residual by predicted plot. The equation in (b) was obtained from the association between residuals and predicted CH4 centered around the mean of predicted values. The mean (−3.7E−06 g/day) and linear (0.0796) biases were not different from 0 (P>0.19). RMSPE=root mean squared prediction error.

Regression estimates for the association between residuals and model predicted CH4 (g/day) values centered around the mean for all candidate models

Data set included 81 observations from 27 lactating Holstein dairy cows fed various forage sources.
1 Root mean squared prediction error (RMSPE) expressed as g/day and percentage of the observed mean. Mean squared prediction error was decomposed into ECT (error due to overall prediction bias), ER (error due to deviation of the regression slope) and ED (error due to random variation).
2 Regressor shifted to its mean value.
Conclusions
Using a data set from diets including a range of forage species, cis9-17:1, cis11-18:1 and trans8, cis13-18:2 were the most common FA across candidate models and were all negatively associated to CH4 output. Conversely, cis11-14:1, which was positively correlated with CH4, was selected only when DMI was not present in the data set. From a mechanistic point of view, the nature of the associations between these FA and CH4 is not well understood, and future research efforts should be made to elucidate them.
Across diets differing in forage source, milk FA were good predictors of CH4 output. In agreement with previous findings, DMI was a main determinant of CH4 production. However, considering the difficulty in measuring DMI under practical conditions, a model is proposed (model no. 3) as a practical tool to estimate on-farm CH4 output based on milk FA profile.
Acknowledgments
Gratitude is expressed to Micheline Gingras and Yolaine Lebeuf for assistance with milk FA analysis, likewise to Martin Leclerc at the Département de mathématiques et statistique at Université Laval for helpful statistical advice. This study was supported by a Dairy Research Cluster grant from Agriculture and Agri-Food Canada, Dairy Farmers of Canada and the Canadian Dairy Commission. Daniel E. Rico has been supported by a postdoctoral grant of the Fonds Germain-Brisson (Université Laval).
Supplementary Material
To view supplementary material for this article, please visit http://dx.doi.org/10.1017/S1751731115001949