The dynamics of milk production performance show how dairy cows respond to their surroundings (Ranzato et al., Reference Ranzato, Aernouts, Lora, Adriaens, Abdelkrim, Gote and Cozzi2024). The lactation curve is a graphical representation of milk production patterns throughout the lactation period. Such a curve characterises the milking potential of lactating animals and provides valuable insights to assist in designing appropriate management plans. This curve assists in estimating the missing values in animal records, providing an accurate understanding of biological traits and persistence (Ali et al., Reference Ali, Narang, Dubey and Kaur2023). Several mathematical functions have been used to study the lactation curve. Among the most well-known mathematical ways, Wood (Reference Wood1967) developed the gamma function. These mathematical functions are used to make accurate predictions on the dynamics of milk production and how the environment affects production (Yıldırır, Reference Yıldırır2024). The relationships between the components of the lactation curve are used by this function to explain it. Peak yield (PY) and persistency (PR) determine the shape of the lactation curve as they are related to overall milk production (Do et al., Reference Do, Bissonnette, Lacasse, Miglior, Sargolzaei, Zhao and Ibeagha-Awemu2017). The shape of the lactation curve differs according to parity (Jiang et al., Reference Jiang, Hickson, Woods, Morandeau, Burke, Correa-Luna, Donaghy and Lopez-Villalobos2020; Jingar et al., Reference Jingar, Mehla, Singh and Roy2014; Niozas et al., Reference Niozas, Tsousis, Malesios, Steinhöfel, Boscos, Bollwein and Kaske2019), breed, individual genetic variation, pregnancy, feed, calving season, calving year, dry period and herd management (Andersen et al., Reference Andersen, Østerås, Reksen, Toft and Gröhn2011; Omar et al., Reference Omar, Khan, Su, Dhakal, Hossain, Razu, Si, Pauciullo, Faruque and Zhang2024).
Some problems faced by lactating cows can greatly influence lactation curve components (LCC). These problems include mastitis, reproductive problems, metabolic disorders, lameness and other diseases (endemic, respiratory, etc.). Some studies examined the impacts of one or more of these disorders on LCC in early lactation (Hostens et al., Reference Hostens, Ehrlich, Van Ranst and Opsomer2012) or in different stages within the same lactation (Yamazaki et al., Reference Yamazaki, Takeda, Nishiura and Togashi2009). These disorders reduced the cows' performance; however, they did not result in culling from the herd. The LCC of Holstein cows that failed to sustain economically viable milk production and were already culled from the herd has not been previously studied. Although previous research has investigated the impact of disorders on LCC during early lactation, no study has conducted a comprehensive analysis of the extent to which specific culling reasons alter the entire lactation curve in a large, high-yielding herd.
We hypothesised that the LCC of retained cows is differentially affected by culling factors.
Therefore, this work aims to investigate the LCC in culled Holstein cows compared with those retained unculled in the same herd. This investigation offers innovative perspectives on the customisation of management strategies to decrease the incidence of involuntary culling. Understanding the impact of culling reasons on LCC can improve the capacity to create effective management strategies that reduce culling rates and economic losses, as culled cows are frequently high-yielders.
Materials and methods
The current study was approved by the Institutional Animal Care and Use Committee (CU-IACUC) at Cairo University, Egypt (No. CU II R F 1 24).
Data source
Data used in this study belonged to a large commercial dairy herd, located in the northern Egyptian governorate of Menoufia at 30.14°N, 30.33°E. The farm has a subtropical climate with humid summers and mild winters. Data were extracted from the herd recording program Dairy Comp 305 (Valley Ag Software, Tulare, CA). This study included 27,297 complete lactation records representing first to sixth parity cows calved from 2008 to 2019. The descriptive data used to sort the records included stayability class, parity and season and year of calving (Table 1).
Descriptive overview of culling causes and retention metrics in Holstein cows

Note: The total number include 27,297 complete lactation records of Holstein cows calved during 2008–2019 in a large herd in Egypt
* Reproductive disorders included repeat insemination, dystocia, metritis, pregnancy toxemia, uterus prolapse and uterus adhesion.
** Endemic diseases included lumpy skin disease (LSD), Bovine ephemeral fever (BEF), and Foot-and-mouth disease (FMD).
Herd management
Cows were housed in concrete-floored, shaded free-stall barns. The cows were given a total mixed ration (TMR) all year long. Rations were served three times a day and fresh water was available throughout the day. Artificial insemination was used. Three times every day, machines were used to milk cows at 8-h intervals. At the farm, a cooling system was installed. All cows were maintained in identical conditions and managed in the same way.
Estimation of lactation curve components (LCC)
The incomplete gamma function of Wood (Reference Wood1967) was used to describe the lactation curve based on the following model: Y n = a ⋅ nb ⋅ e−c⋅n
Where: Y n is the milk yield in week n, a is a constant that expresses the level of IMY, b represents the rate of increase to peak (RMIP), c is the rate of decline after peak (RMDP), n is the period (week) and e is the base of the natural logarithm and to estimate LCC as follows:
Peak time,
 \begin{equation*}{\text{PT }}\left( {{\text{no}}.{\text{ of weeks to attain peak yield}}} \right) = \frac{{\text{b}}}{{\text{c}}}\end{equation*}
PY
 \begin{equation*}{\text{PY }}\left( {{\text{daily milk yield at peak}},{\text{ kg}}} \right) = a{\left( {\frac{b}{c}} \right)^b}{e^{ - b}}\end{equation*}
PR,
 \begin{align*}& {\text{PR }}\left( {\text{the co}}{{\text{w}}{\text{'}}}\text{s ability to sustain a high level of} \right.\\
& \quad \left. \text{production after peak} = {\text{ }} - \left( {{\text{b}} + 1} \right) \right).\end{align*}
Data collection and culling criteria
Culling reasons were determined from veterinary records and farm management logs using standardised terminology. For example, Dairy Comp 305 records were used to ascertain insufficient milk yield, which was defined as milk production below 20 kg/day for two consecutive weeks. Reproductive disorders were diagnosed by veterinarians based on clinical signs such as repeated insemination or metritis. Unknown causes were indicated when no particular diagnosis was documented in the herd management system following veterinary assessment.
Statistical analysis
The XLSTAT version 2023.5. was used to analyse the effects of stayability class (retained/culled), parity order and season and year of calving on LCC based on the following model:
 \begin{equation*}{\text{Yijklm}} = { \mu } + {\text{ C}}i{\text{ }} + {\text{ P}}j{\text{ }} + {\text{ Y}}k + {\text{S}}l{\text{ }} + {\text{ e}}ijklm,\end{equation*}
where: Y ijklm = an observation of the trait, µ = the overall mean, Ci = the fixed effect of the ith stayability class, (i = 1, 2,., 9), 1 = retained,; 2 = culled due to low milk yield, 3 = culled due to reproductive disorders, 4 = culled due to udder problems, 5 = culled due to metabolic disorders, 6 = culled due to locomotive problems, 7 = culled due to endemic diseases, 8 = culled due to respiratory diseases and 9 = culled due to unknown reasons, P j = the fixed effect of the jth parity order (j = 1, 2,.and 6), 1 = 1st, 2 = 2nd, 3 = 3rd, 4 = 4th, 5 = 5th and 6 = 6th, Yk = the fixed effect of the kth period of calving, (k = 1, 2, 3), 1 = 2008–2011, 2 = 2012–2015 and 3 = 2016 – 2019, Sl = the fixed effect of the 1st season of calving (l = 1, 2, 3, 4), 1 = Winter (December–February), 2 = Spring (March–May), 3 = Summer (June–August) and 4 = Autumn (September–November) and eijklm = random residual effect. Duncan's analysis of the differences between the categories was performed with a 95% confidence interval..
Results
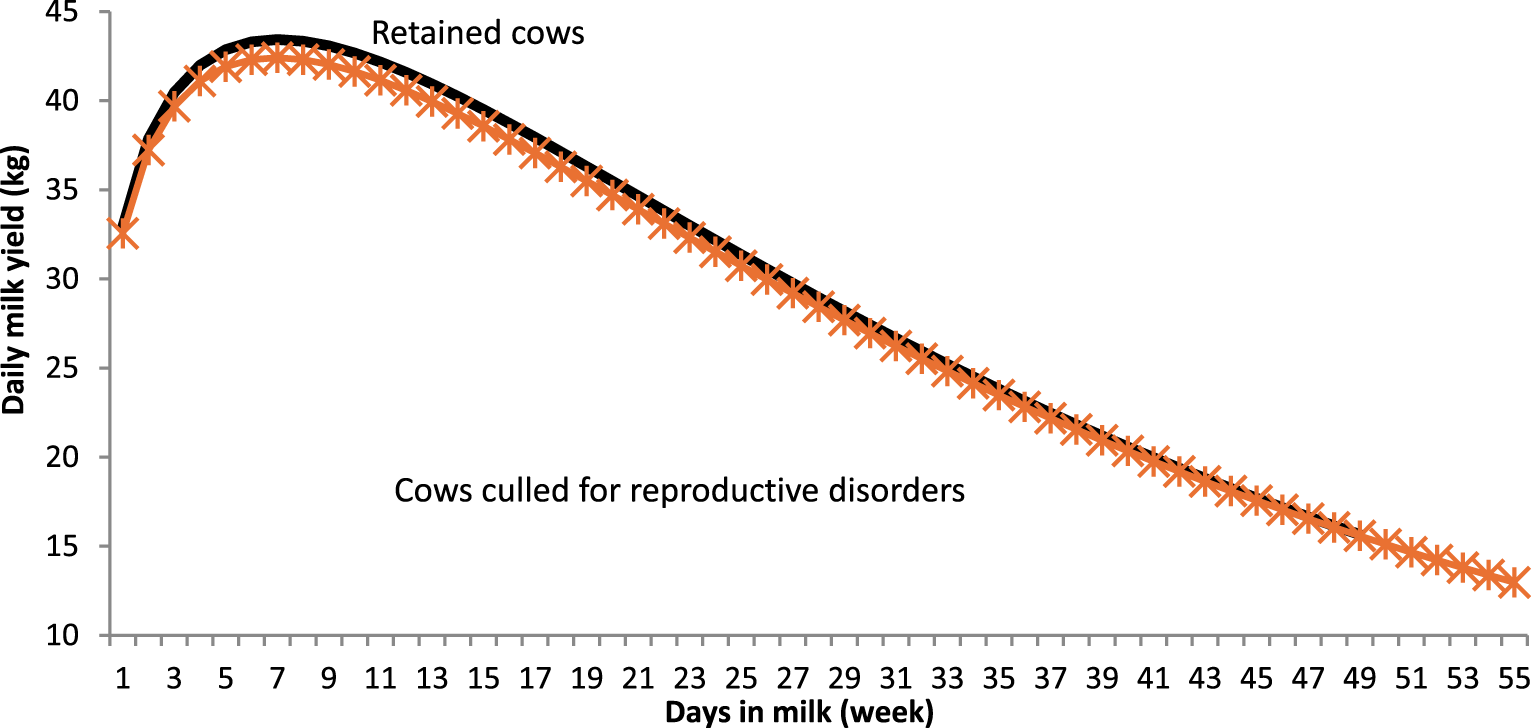
All LCC except RMDP showed significant differences (P < 0.0001) between retained and culled cows (Table 2). The effects of culling for reproductive disorders on the lactation curve are depicted in Fig. 1. Cows culled for reproductive disorders exhibited lactation curves that were highly comparable to those of retained cows. They provided days in milk (54.9 weeks) longer than retained ones (48.9 weeks). Table 2 shows that these cows recorded no significant differences in LCC compared to retained cows and cows in this class exhibited higher PT (7.2 weeks) and PR (71.1%) than those culled for other reasons.
Lactation curves in retained and culled cows for reproductive disorders.

Least square means of lactation curve components of Holstein cows as affected by stayability class (retained/culled)

Note: (IMY): the initial milk yield (kg), (RMIP): the rate of milk increase to the peak (kg/wk), (RMDP): the rate of milk decline after peak (kg/wk), DIM: days in milk (week), PY: peak yield (the highest daily milk, kg), PT: time to attain peak (week) and PR: persistency (%). Within each classification 'in the same column' means followed by different letters differ significantly (P < 0.05).
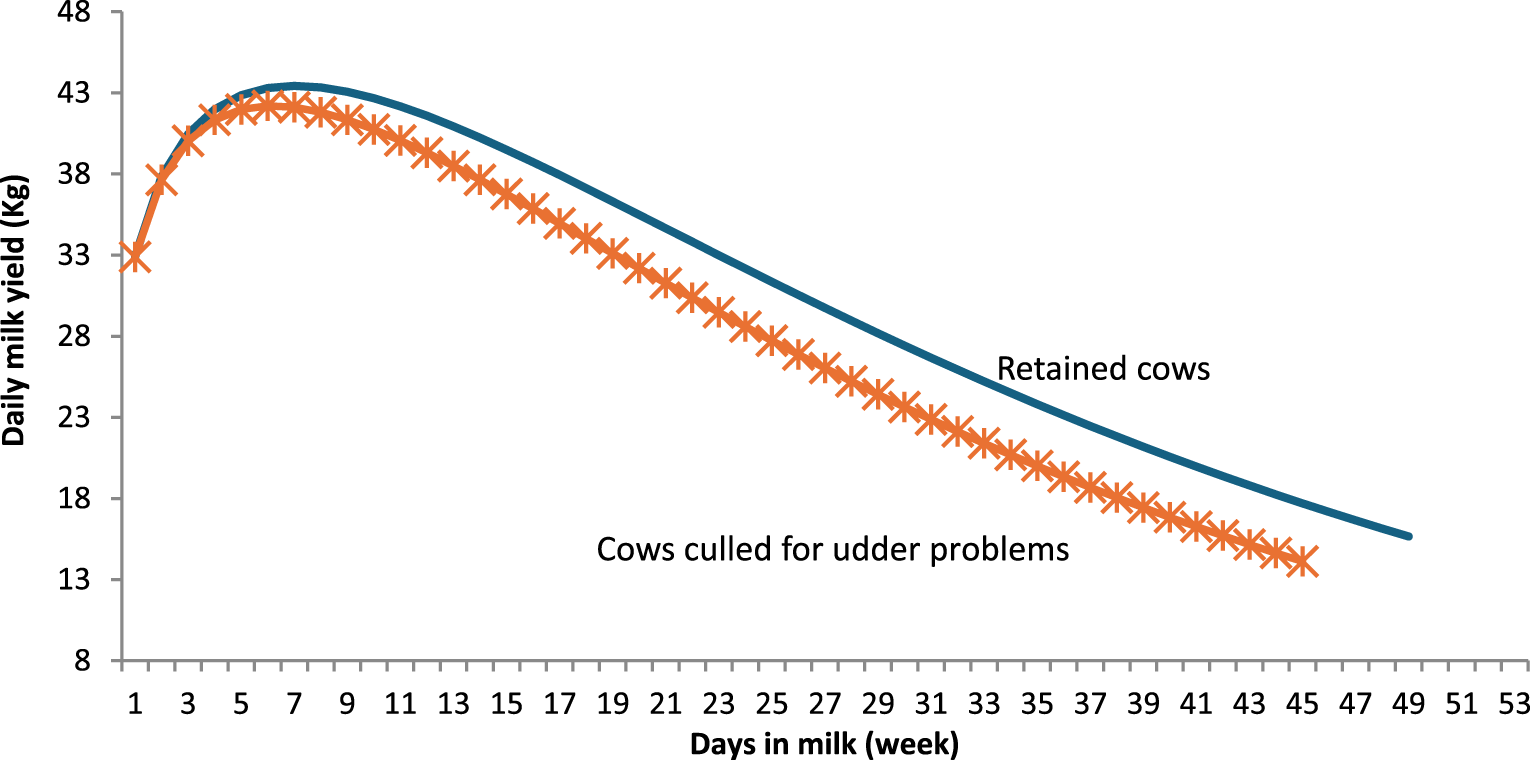
The effects of culling for udder problems on the lactation curve are depicted in Fig. 2. The beginning of the lactation curves of the two classes of cows (with udder problems and retained) were initially similar, then they diverged. This result is supported by the insignificant differences in the values of IMY between the two classes (Table 2). Cows of this class recorded higher values of RMDP and lower values of DIM, PY, PT and PR than the retained cows. Udder problems caused the highest RMDP and the lowest PR among all the involuntary culling reasons.
Lactation curves in retained and culled cows for udder problems.

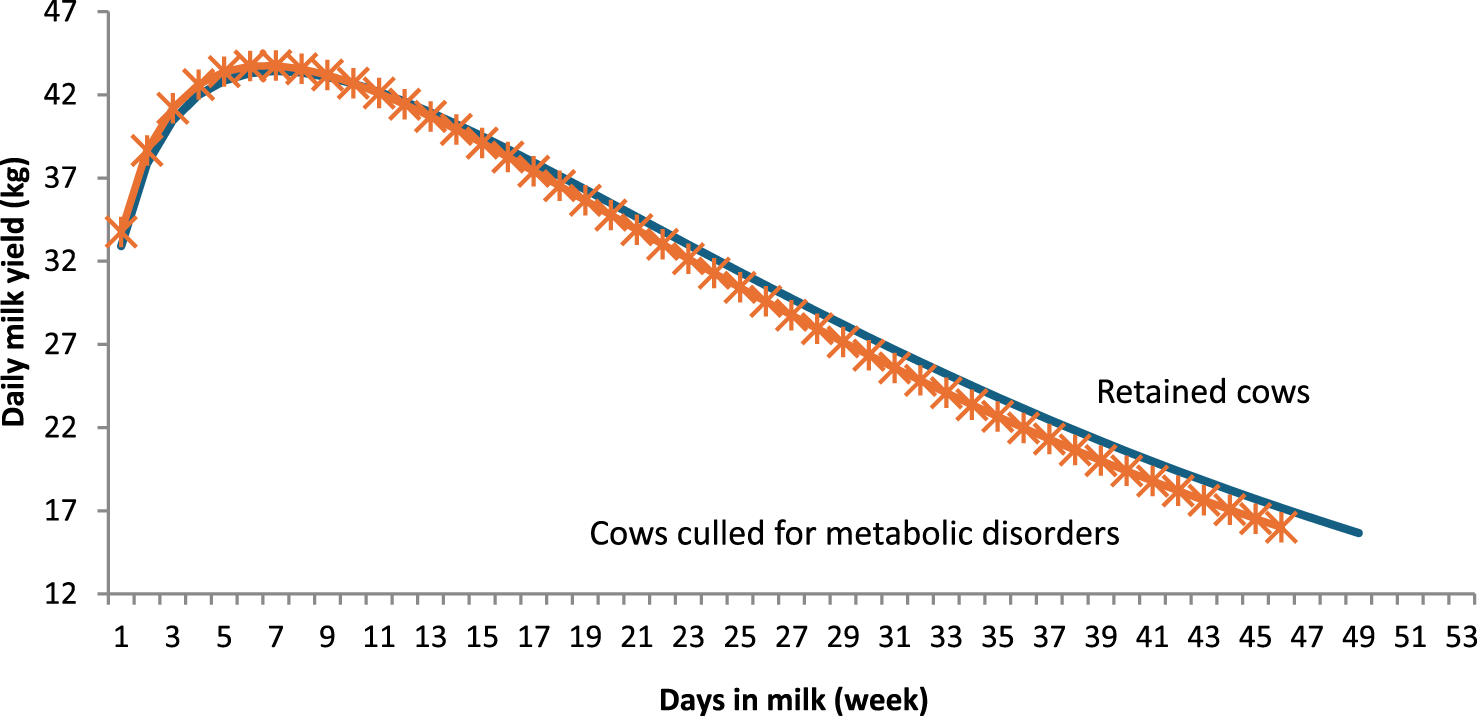
The effects of culling for metabolic disorders are depicted in Fig. 3 for cows culled due to metabolic disorders, the lactation curve from the beginning until the peak stage surpassed that of the retained cows. Their curve obviously dropped and terminated earlier than that of the retained ones. Moreover, they recorded higher values of IMY, RMDP and PY but lower values of PT and PR than the retained ones (Table 2). They also had greater IMY and PY than the other culled cows.
Lactation curves in retained and culled cows for metabolic disorders.

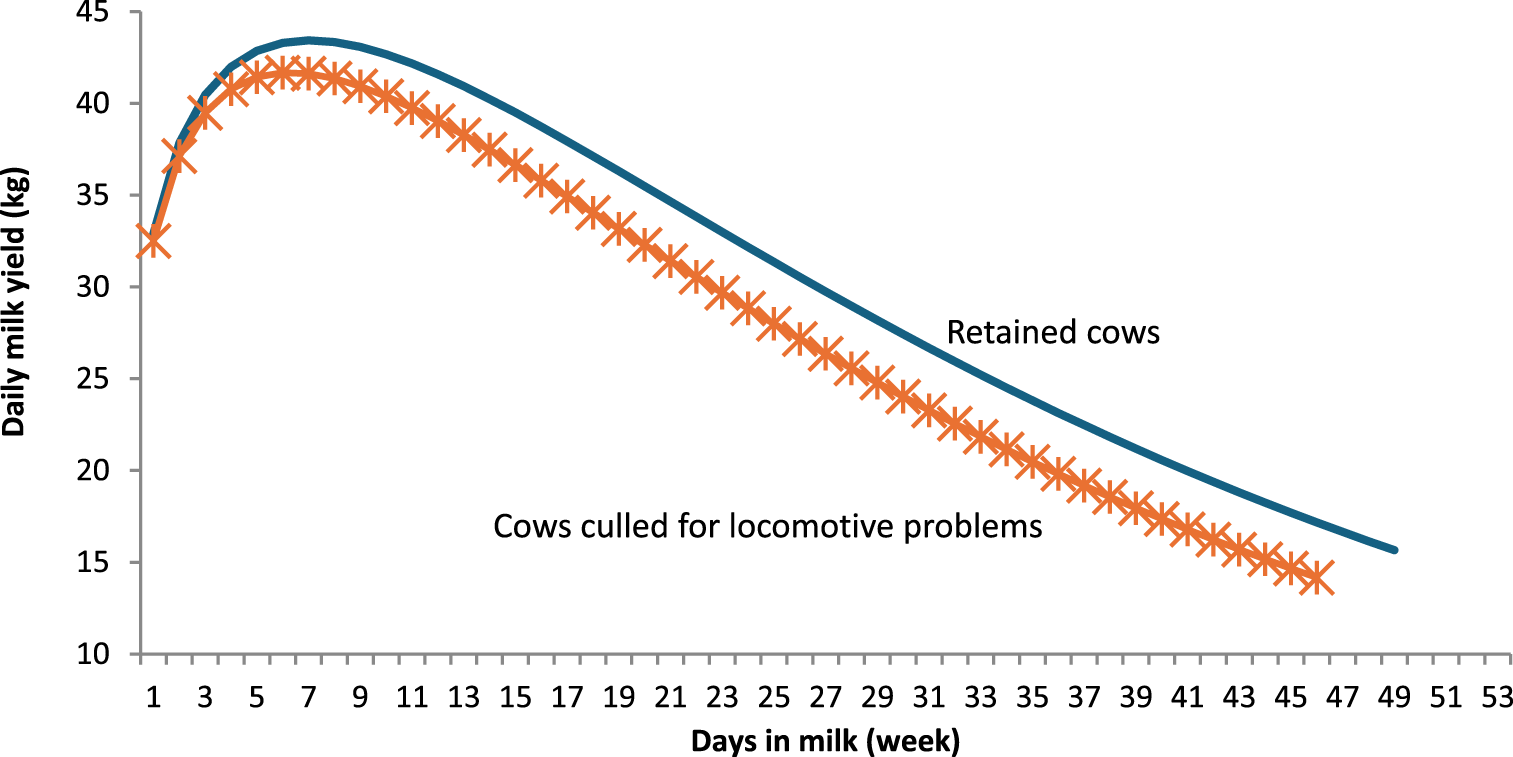
Figure 4 shows the lactation curve of cows culled due to locomotive problems. These cows started lactation similarly to the retained ones, but subsequently diverged drastically through the remaining stages.
Lactation curves in retained and culled cows for locomotive problems.

Also, the lactation length of these cows was shorter than that of the retained (unculled) ones. Besides, these cows were among the culled cows with high RMDP, early PT and low PR (Table 2).
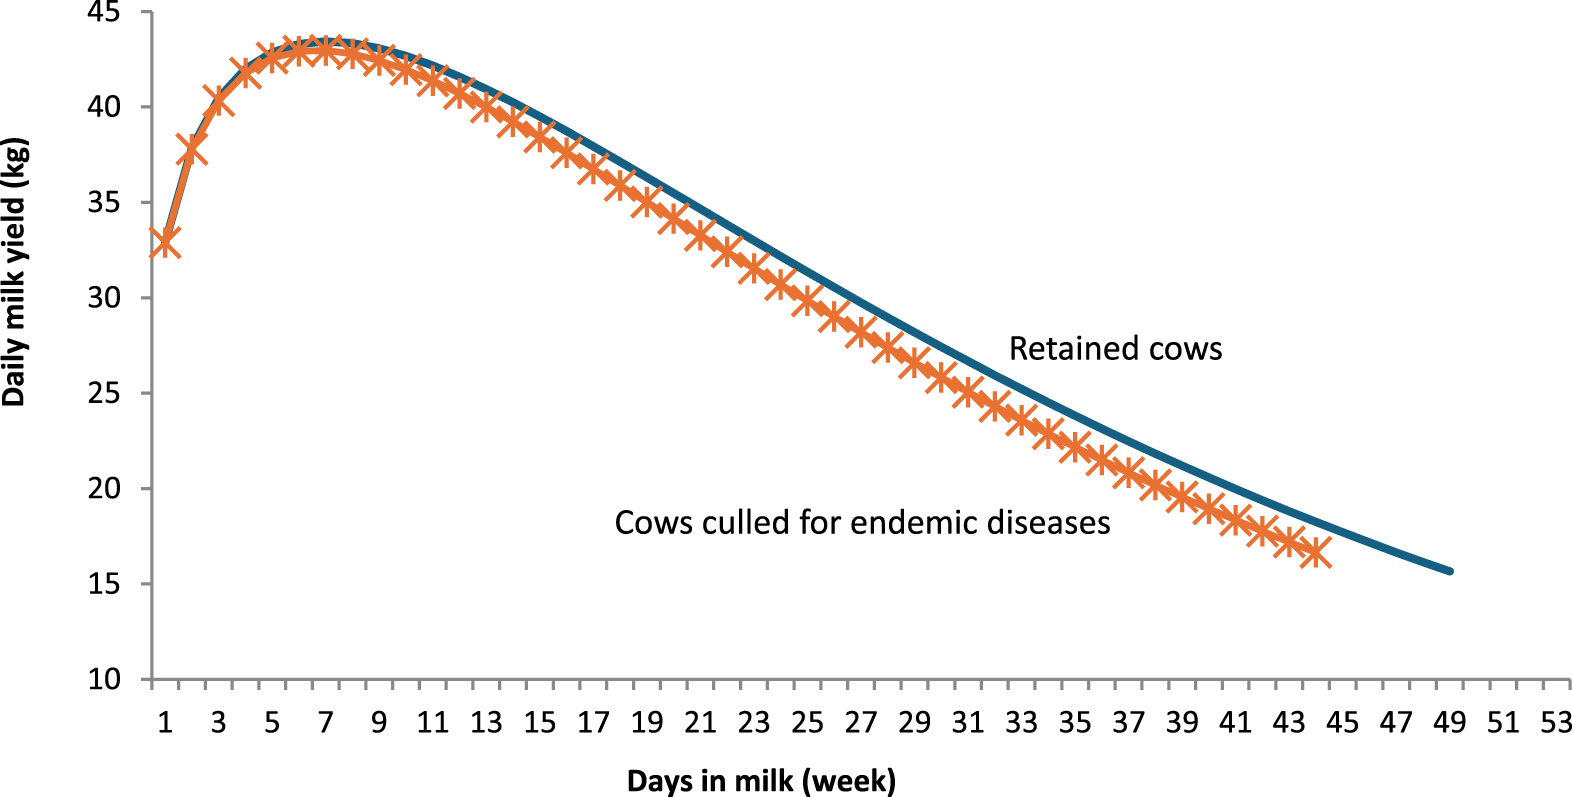
The effects of culling for endemic diseases are depicted in Fig. 5. Cows culled for endemic diseases exhibited a lactation curve with comparable beginning and peak stages to those of the retained ones. Then the curve dipped and stopped earlier than that of the retained cows. Furthermore, Table 2 showed that cows culled for endemic diseases did not differ significantly from retained cows in terms of IMY and PY. Besides, they had higher RMDP, earlier PT and lower PR than the retained cows.
Lactation curves in retained and culled cows for endemic diseases.

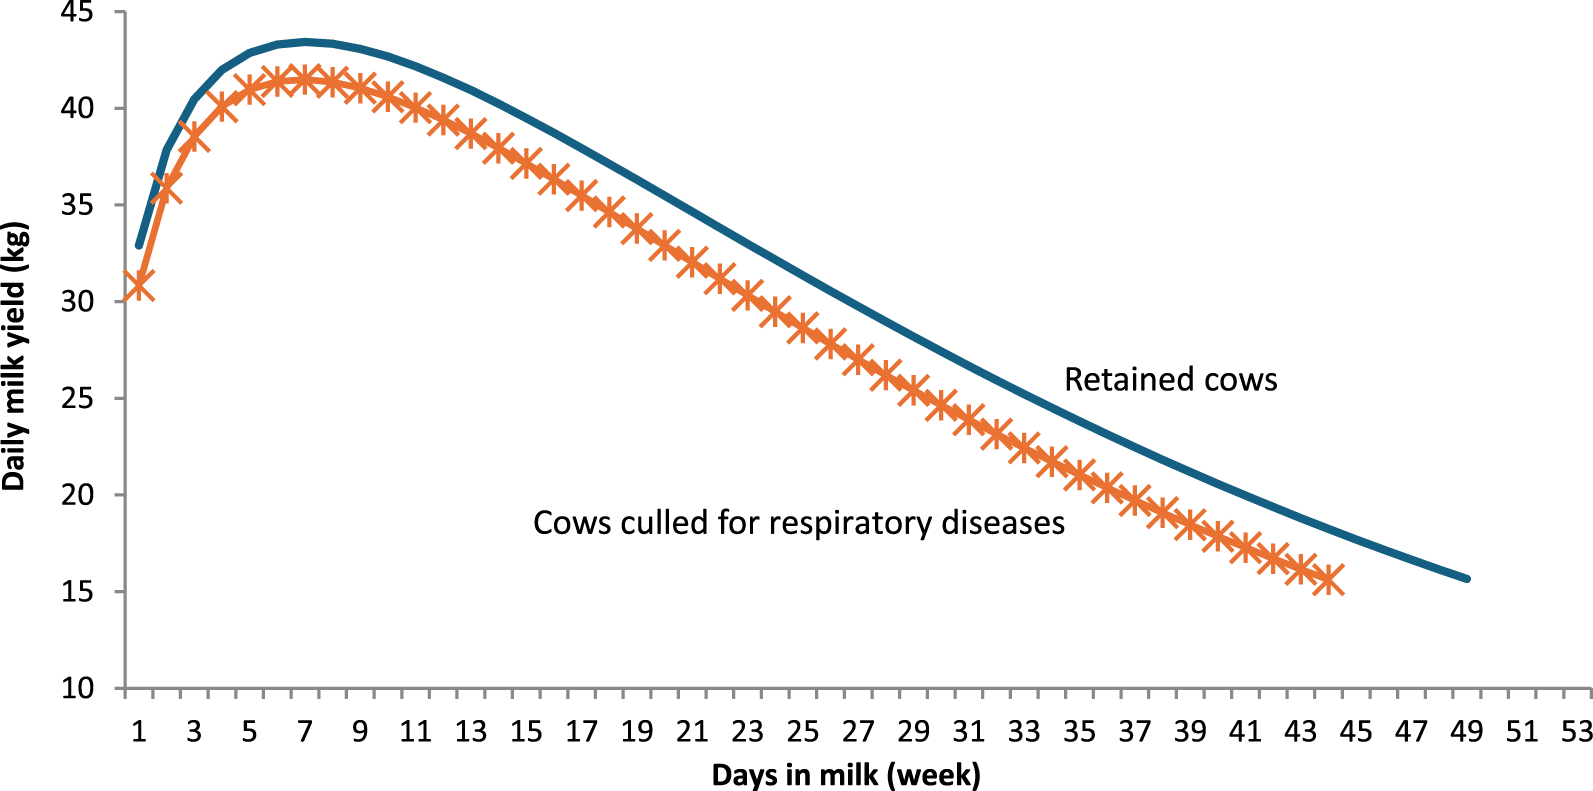
The effects of culling for respiratory diseases are depicted in Fig. 6. In contrast to all culled cows under this investigation, the lactation curve of the cows culled for respiratory diseases did not meet the lactation curve of retained cows at any point, as it was lower at all stages. They were comparable to the retained cows only in both PT and PY, as differences between them were not significant (Table 2).
Lactation curves in retained and culled cows for respiratory diseases.

Discussion
The overall means of the lactation curve components (LCC)
The mean of IMY in this study (33.2 kg) was higher than the 20.9–22.7 kg reported by Jiang et al. (Reference Jiang, Hickson, Woods, Morandeau, Burke, Correa-Luna, Donaghy and Lopez-Villalobos2020), Lee et al. (Reference Lee, Lee, Park and Seo2020) and Marumo et al. (Reference Marumo, Lusseau, Speakman, Mackie and Hambly2022). These findings are related to the intensive management and high genetic potential of the studied Holstein herd, which emphasises early lactation performance. Conversely, the meaning of RMDP, which was (0.038 kg) higher than 0.027, 0.003 and 0.004 kg measured by Duque et al. (Reference Duque, Casellas, Quijano, Casals and Such2018), Atashi et al. (Reference Atashi, Asaadi and Hostens2021) and Marumo et al. (Reference Marumo, Lusseau, Speakman, Mackie and Hambly2022), respectively. This may be attributed to the characteristics of the investigated herd, which included highly productive cows that achieved high average IMY. Since high-producing cows are the most susceptible to problems, about 66.6% of the cows in the herd had various problems that ended in involuntary culling. These problems caused an inability to slow the rate of milk drop after the peak. For the average of RMIP, it was comparable with the previously reported values. It fell between 0.20 and 0.26 kg, as reported by Lee et al. (Reference Lee, Lee, Park and Seo2020) and Atashi et al. (Reference Atashi, Asaadi and Hostens2021), respectively. It was equivalent to the 0.25 kg stated by Marumo et al. (Reference Marumo, Lusseau, Speakman, Mackie and Hambly2022). The average PY in the current study (42.1 kg) was high. It fell between 35.1 kg and 47.3 kg, estimated by Atashi et al. (Reference Atashi, Asaadi and Hostens2021) and Marumo et al. (Reference Marumo, Lusseau, Speakman, Mackie and Hambly2022), respectively and was comparable to 42.3 kg revealed by Lee et al. (Reference Lee, Lee, Park and Seo2020). PY predicts total milk yield and they were positively correlated. High PY scores by Holstein in different countries resulted from following similar recent management practices to take advantage of the high genetic efficiency of this breed. The average PT (6.8 weeks, which is equal to 47.6 days) was later than the 4.7 weeks reported by Duque et al. (Reference Duque, Casellas, Quijano, Casals and Such2018). It was comparable to 52.7 days found by Niozas et al. (Reference Niozas, Tsousis, Malesios, Steinhöfel, Boscos, Bollwein and Kaske2019). But it was earlier than 60.3 days, 69 days and 90.4 days recorded by Marumo et al. (Reference Marumo, Lusseau, Speakman, Mackie and Hambly2022), Lee et al. (Reference Lee, Lee, Park and Seo2020) and Atashi et al. (Reference Atashi, Asaadi and Hostens2021), respectively. Early PT in the current study falls within the context of the inverse relationship between PT and PR, as the mean of PR (67.2%) was not the best, although it fell between the commonly reported averages (63.1% and 75.9%) reported by Duque et al. (Reference Duque, Casellas, Quijano, Casals and Such2018) and Bahashwan and Alfadli (Reference Bahashwan and Alfadli2014). Most cows in the present study had challenges that hindered their ability to maintain high milk production. Variances in estimated LCC recorded in different studies may be attributed to parity, feed, pregnancy, diseases, herd management, environmental conditions and the drying period before calving (Andersen et al., Reference Andersen, Østerås, Reksen, Toft and Gröhn2011; Kramarenko, Reference Kramarenko2023).
Lactation curve components in retained and culled cows
Reproductive disorders
Cows culled due to reproductive disorders recorded longer days in milk than all investigated cows, including the retained ones. This is because high-yielding cows take longer to conceive, resulting in extended days open and, consequently, longer lactation periods. From the perspective of the dairy herd manager, this may achieve economic benefits from the high-yielding cows with reproductive disorders. However, this inevitably will reduce the number of lactations these cows should provide during their lifetimes. Here, we should ask if extra quantities of milk from extending the lactation period can compensate for the shortage of the number of lactations that the cows would give if they had no reproductive disorders. In terms of culled cows, those with reproductive problems were the most persistent and the last to reach peak production. This result agreed with Muir et al. (Reference Muir, Fatehi and Schaeffer2004), who reported a positive genetic correlation between PR and both calving interval (0.17) and dystocia (0.43) in dairy cattle in the first parity. Also, Atashi et al. (Reference Atashi, Asaadi and Hostens2021) reported that cows experiencing calving difficulties exhibited high PR in all parities except the second and fourth. They observed that the lower PY and the longer PT were recorded by these cows. Yamazaki et al. (Reference Yamazaki, Hagiya, Takeda, Yamaguchi, Osawa and Nagamine2014) reported that longer days open were accompanied by high PR in Holstein cows, reporting values of 0.28, 0.35 and 0.39 as genetic correlations between PR and days open in the first three lactations, respectively. This agreed with Zavadilová et al. (Reference Zavadilová, Němcová, Přibyl and Wolf2005), who stated that the length of days open could change the shape of the lactation curve and a higher slope was linked with fewer days open in Czech Holstein cows. These findings may be related to the inverse relationship between milk production and reproduction. Decreased negative energy balance issues result from the absence of pregnancy, which encourages the cows to continue maintaining high milk production.
Udder problems
Cows culled because of udder problems began a lactation curve with a high initial milk yield comparable to retained cows, then the udder faced issues that caused mastitis. This infection had a significant impact on the cow's performance during the rest of the lactation curve, resulting in a variation in shape relative to the retained cows. Mastitic cows were the least persistent cows in the current study. The association between mastitis and low PR agreed with (Moru et al., Reference Moru, Umoh, Maikai, Barje and Adeyinka2017). Mastitis increases the apoptosis of the mammary epithelial cells and thus PR and mastitis negatively influence each other, particularly after the peak (Capuco et al., Reference Capuco, Ellis, Hale, Long, Erdman, Zhao and Paape2003). Negative genetic correlations between somatic cell counts and PR in different dairy cows were stated by Yamazaki et al. (Reference Yamazaki, Hagiya, Takeda, Yamaguchi, Osawa and Nagamine2014) and Strapáková et al. (Reference Strapáková, Candrák and Strapák2016). As somatic cell counts are associated with mastitis, good management practices could minimise mastitis cases, which, in turn, reduce SCC (a marker of inflammation in the udder). One of these practices is to adhere to a dry cow therapy plan during the dry phase, which should last at least 40 days. The protocol includes administering long-acting antibiotics to treat and prevent future mastitis infections.
Metabolic disorders
Cows culled for metabolic disorders had higher IMY and PY than all the examined cows, including the retained ones. This implies that these cows were high-yielders, making them more susceptible to metabolic disorders that are related to the increased negative energy balance resulting from the efforts of the digestive system to provide the udder with the precursors for milk synthesis. As a result of this load, the cows became less persistent in maintaining high milk levels after the peak, as demonstrated by the findings of the present study. Additionally, Walsh et al. (Reference Walsh, Williams and Evans2011) and Torshizi et al. (Reference Torshizi, Mashhadi and Farhangfar2019) declared a negative phenotypic correlation between PY and PR. The present findings were supported by Harder et al. (Reference Harder, Bennewitz, Hinrichs and Kalm2006), who reported a negative genetic correlation between metabolic diseases and PR.
Locomotive problems
The cows that had locomotive problems started with comparable initial milk yield but failed to continue the lactation stages normally compared with the retained unculled cows. These problems negatively affect cows' welfare. They make them unable to perform their daily activities, mainly feeding and rumination. This reduces the energy directed to produce milk. Onyiro et al. (Reference Onyiro, Offer and Brotherstone2008) stated that cows with high body condition scores and productivity are more susceptible to locomotive problems, namely at older ages. Also, they added that cows raised under intensive systems (as is the case in this study) are more susceptible to locomotive problems than those raised under extensive systems. The low PR observed in the present study indicates that cows with these problems were unable to sustain peak milk yield. This agrees with Harder et al. (Reference Harder, Bennewitz, Hinrichs and Kalm2006), summarizing that PR was linked with fewer hoof and leg diseases. Locomotive problems are not heritable traits and the absence of leg problems is one of the indicators of good management. It is affected by humidity in stall barns and poor hygienic conditions surrounding cows. The more severe these conditions, the more likely cases of locomotive problems (Fahim et al., Reference Fahim, Ibrahim, Amin and Sadek2021).
Endemic diseases
Despite obligatory vaccination in Egypt against epidemic diseases, outbreaks still occur. This is attributed to the ineffective vaccine used against lumpy skin disease, which is derived from sheep and to the inadequate vaccine against foot-and-mouth disease, as the virus develops new strains. The culls of this class started the lactation with IMY and PY similar to the retained cows, but when the outbreak occurred, the infected cows were unable to sustain their high production and were unable to provide long lactation. Without a doubt, this reduces milk production. According to Abutarbush et al. (Reference Abutarbush, Ababneh, Al Zoubi, Al Sheyab, Al Zoubi, Alekish and Al Gharabat2015), lumpy skin disease reduced milk production by approximately 50%. Foot-and-mouth disease reduced milk production by 22% to 66% (Onono et al., Reference Onono, Wieland and Rushton2013; Senturk and Yalcin, Reference Senturk and Yalcin2005). The percentage of milk reduction varied depending on the production system, the severity of the epidemic and the stage of lactation. Developing effective vaccines and conducting management, including biosafety and insect control, could lower infection rates and then culls as a result of these diseases.
Respiratory diseases
High-yielding cows are more exposed to these diseases as they face an extremely negative energy balance, resulting in immunosuppression. This makes the cows more susceptible to many other diseases. Moreover, these diseases are associated with a decrease in feed intake, which in turn reduces the energy supplied to the udder for milk production. This explains why the cows of this class had shorter and lower levels of lactation curve than the retained ones. The findings agreed with Mellado et al. (Reference Mellado, Pérez, Morales, Macías-Cruz, Avendaño-Reyes, Guillén and García2021), who found that tuberculosis was associated with higher milk capacity. To reduce the culls caused by these diseases, management practices that work against the causes linked with them should be followed. The bacteria and viruses causing these diseases are activated when cows are exposed to stress, high humidity, temperature changes and dust. High intensity, poor barn hygiene and ongoing changes in feed gradients all contribute to higher infection rates.
Data spanned 12 years, and management practices may have evolved, influencing lactation traits. This study was conducted in a single large herd in Egypt, which may limit the generalisability of findings to other regions or smaller herds with different management practices. The subtropical climate may also influence LCC differently compared with temperate climates. Additionally, grouping calving years into broad periods (e.g., 2008–2011) may mask annual variations in management or disease prevalence. Future studies should validate these findings across multiple herds and climates. While the large sample size of 27,297 lactation records and consistent herd management practices helped ensure high statistical power and minimised confounding factors within the study herd
Conclusion
This study highlights the milk production patterns of cows that had udder issues or problems related to reproduction, metabolism or locomotion. By linking culling causes to milk production trends, dairy managers can spot risks early, track when the milk of cows starts to decrease and pay attention to keep healthier, high-value cows in the herd longer. This approach could reduce costs and improve milk yield and animal welfare on dairy farms.
Acknowledgements
The authors are very grateful to Dr Rabie R. Sadek and Dr Mohamed A. M. Ibrahim, professors of animal husbandry, Department of Animal Production, Faculty of Agriculture, Cairo University, for their valuable help in preparing this manuscript.
Funding statement
The authors declare that no funds, grants or other support were received during the preparation of this manuscript.
Competing interests
The authors declare that there is no conflict of interest.
Ethics approval and consent to participate
This study was approved by The Institutional Animal Care and Use Committee (CU-IACUC) Cairo University, Egypt (Date: Feb.2024 /No. CU II R F 1 24).
Availability of data and material
The data sheets are available from the corresponding author if it will be requested by the editor of the journal or the reviewers during the process of publishing the current paper.
Authors’ contributions
All authors had the same contribution.