I. INTRODUCTION
Nanomaterials have generated intense research activity in recent years due to the variety of interesting properties they exhibit. Many display quantum size effects when their size approaches the de Broglie wavelength of the valence electrons, leading to unusual electronic, optical, and magnetic properties. Reference Daniel and Astruc1 These properties are intrinsically tied to the tailored shapes and nanoscale sizes, which also give rise to large surface area to volume ratios and high surface curvatures. Both the latter aspects also increase the chemical activity in many nanostructured systems. For these reasons, many studies have sought to better control the size and morphology of various nanomaterials during synthesis to achieve the desired structures and the associated properties.
Energetic ion beams can alter both the structure and composition of essentially any material by displacing atoms from their lattice sites, inducing localized heating to extreme temperatures, or implanting new atomic species within the lattice. Reference Nastasi, Mayer and Hirvonen2 These conditions are encountered in radiation environments, such as nuclear and space applications, where stray energetic particles can dramatically change material properties. Bulk systems of comparatively insensitive materials often require substantial particle fluences for radiation effects to become apparent. However, smaller fluences become a significant concern in sensitive materials or devices with small length scale critical features. For example, solid state microelectronics may suffer performance degradation from single particle events. Reference Schwank, Shaneyfelt and Dodd3 Nanomaterials present an interesting case for radiation tolerance; a single ion may affect large portions of these small structures, but the small volume also decreases the frequency of ion interactions.
At the same time, radiation effects are not exclusively detrimental and may be employed to selectively enhance materials. Ion beam modification techniques are well developed for bulk materials and have been applied extensively in the semiconductor industry and in metallurgical applications. Reference Auciello and Kelly4 The success of these techniques in bulk materials stemmed from a fundamental understanding of ion-solid interactions. Ion beams have been suggested as potential tools for modifying existing nanoparticles (NPs), Reference Dmitrieva, Rellinghaus, Kastner, Liedke and Fassbender5–Reference Dhara7 and to create new far-from-equilibrium structures. Reference Ramjauny, Rizza, Perruchas, Gacoin and Botha8,Reference Bufford, Pratt, Boyle and Hattar9 Still, a fundamental understanding of the unique aspects of ion-solid interactions in nanoscale volumes must be further developed to better control and predict the results.
Some previous efforts have been made to investigate the irradiation response of NPs. Atomistic simulation techniques like molecular dynamics (MD) are well suited for both the time and length scales associated with collisional effects in NPs. Reference Krasheninnikov and Nordlund10,Reference Nordlund and Djurabekova11 As such, several studies have investigated radiation effects in NPs Reference Krasheninnikov and Nordlund10,Reference Nordlund and Djurabekova11 ; simulations of self-ion irradiation in Au NPs have predicted behavior ranging from formation of large surface craters to disintegration, depending on NP size, composition, and ion energy. Reference Kissel and Urbassek12–Reference Jarvi and Nordlund15 Other MD studies have suggested significant internal changes resulting from heavy ions including transitions from metastable to stable crystal structures via transient melting processes. Reference Jarvi, Kuronen, Nordlund and Albe16 Recently, Monte Carlo (MC) codes have also been developed specifically for simulation of radiation effects in arbitrarily shaped nanostructures. Reference Borschel and Ronning17 MD methods are generally regarded as more accurate on the atomic scale, as they include fewer simplifying assumptions. Still, MC codes have the advantages of being able to handle larger systems in excess of a few tens of nanometers in size and can simulate more ion trajectories, allowing better statistical determination of properties like average ion range. Detailed experiments with nanometer resolution are needed to validate and refine various predictions from these different models.
Ex situ experiments can probe larger numbers of NPs over time scales that can extend to days, weeks, or longer. Studies of FePt Reference Dmitrieva, Rellinghaus, Kastner, Liedke and Fassbender5,Reference Wiedwald, Klimmer, Kern, Han, Boyen, Ziemann and Fauth18 and CuAu Reference Jarvi, Pohl, Albe, Rellinghaus, Schultz, Fassbender, Kuronen and Nordlund19 NPs revealed both direct transformations from icosahedral to face centered cubic (FCC) structures during irradiation, and reductions in postirradiation annealing temperatures required to induce the transformation. Others investigated the particles ejected from the parent NPs during heavy ion irradiation. Reference Baranov, Kirillov, Novikov, Obnorskii, Toulemonde, Wien, Yarmiychuk, Borodin and Volkov20 These types of studies provide good statistical averages for the responses of the NPs to multiple ions. Unfortunately, reliably tracking the evolution of the individual NPs with these techniques is difficult, and real time observation of individual ion events is not possible. There is also concern that the enhanced atom mobility exhibited in the nanostructures might obscure the results in the time between irradiation and analysis.
In situ ion irradiation transmission electron microscopy (TEM) experiments provide an ideal complement to simulations and ex situ experiments, as single ion events can be resolved in real time at nanometer length scales. Reference Hinks21 Several in situ studies have investigated the sputtering of nanoscale clusters from films. Reference Birtcher, Donnelly and Schlutig22,Reference Birtcher, Donnelly and Schlutig23 These studies noted a few changes in particles after their initial appearance, specifically movement of individual particles by single ions. However, the primary focus was on the process of sputtering from the film, not the structural evolution of the particles themselves. Fewer in situ studies have directly examined the radiation response of nanomaterials. Birtcher and Donnelly noted that 200 keV Xe ions acting near nanoscale protuberances in Au foil induced liquid-like flow of material. Reference Birtcher and Donnelly24 Greaves et al. employed in situ ion irradiation with 80 keV Xe ions to investigate the sputtering from Au nanorods Reference Greaves, Hinks, Busby, Mellors, Ilinov, Kuronen, Nordlund and Donnelly25 and found that both collisional and thermal sputtering contributions were enhanced by the close proximity of free surfaces in comparison to flat surfaces. Cratering and roughening of the nanorod surfaces was observed, with individual craters continually disappearing and reappearing as a result of repeated ion interactions. In addition, we previously investigated Au NPs subjected to high fluences of heavy and light ions and reported sintering in closely spaced clusters, and substantial loss of volume over time. Reference Bufford, Pratt, Boyle and Hattar9 Still, there is a need to look more closely at the mechanisms of structural change that occur as a result of single ions. With the in situ techniques presented here, it is possible to resolve interactions between single ions and NPs. These events occur within one video frame and result in cluster sputtering, sintering, and surface cratering.
This study aims at elucidating the microstructural evolution of Au NPs induced by single ion events as a function of NP size and ion energy. To this end, Au NPs from 5–60 nm in diameter, an order of magnitude size distribution, were observed during in situ ion irradiation TEM experiments using Au ion beams of energies ranging nearly three orders of magnitude, 46 keV–10 MeV.
II. EXPERIMENTAL PROCEDURES
Spherical gold NPs were purchased from Nanopartz, Inc. (Loveland, CO) with nominal diameters of 5 ± 0.75, 20 ± 1.6, and 60 ± 3 nm. All as-received NPs were stabilized with the company's proprietary carboxylic acid ligand and suspended in deionized water in concentrations of 0.05 mg/mL. The particles were deposited by drop casting onto pure carbon grids, SiO/Formvar grids (Ted Pella, Inc., Redding, CA) and silicon nitride membrane window grids (Structure Probe, Inc., West Chester, PA). To aid in the dispersion a drop of deionized water (0.5 µL) was first deposited, followed by an equal volume of NP solution.
The samples were observed using a 200 kV JEM-2100 TEM (JEOL Ltd., Tokyo, Japan), which is part of the recently completed in situ ion irradiation TEM (I3TEM) facility at Sandia National Laboratories. Reference Hattar, Bufford and Buller26 This microscope is optimized for high contrast imaging, which is well suited for resolving radiation-induced defects. As such, it includes a high tilt pole piece, which provides a maximum point resolution of 2.5 Å. The samples were loaded in a single tilt holder. Since the ion beam enters the microscope perpendicularly to the electron beam, the holder was tilted +30° in α to overcome shadowing from the stage prior to in situ irradiation. Au− beams of 46 keV were used directly from a source of negative ions by cesium sputtering (SNICS), while 2.8 MeV Au4+ and 10 MeV Au8+ beams were produced by accelerating ions from the same source through a 6 MV EN Tandem accelerator (High Voltage Engineering). The respective ion fluxes were approximately 1 × 10¹¹, 1 × 10¹⁰, and 4 × 10⁸ ions/cm2/s. The beam spot was circular and approximately 4 mm in diameter. The final ion fluences ranged from 1.5 × 10¹² ions/cm2 to 3.4 × 10¹⁴ ions/cm2. The video was collected using a 1024 × 1024 pixel FastScan-F114TR camera, and the still images were collected using a 4096 × 4096 pixel TemCam-F416 camera (TVIPS GmbH, Gauting, Germany). Since Au NPs are known to change gradually during the TEM observation, Reference Chen, Palmer and Wilcoxon27 the electron beam current was kept at the lowest dose that permitted good imaging, about 25 pA/cm2, and was blanked whenever video or image collection was not in progress. Additional groups of NPs not under continuous electron beam exposure were observed at intervals for comparison. For 3D reconstructions, images were collected every 3° over a tilt range of approximately −75° to +75° degrees using a single tilt tomography holder (Hummingbird Scientific, Lacey, WA). The tomograms were processed using the IMOD software package Reference Kremer, Mastronarde and McIntosh28 and modified using the UCSF Chimera visualization program. Reference Pettersen, Goddard, Huang, Couch, Greenblatt, Meng and Ferrin29 The stopping power and ion range estimations were made using the stopping and range tables generated by the stopping range of ions in matter (SRIM-2013) software package. Reference Ziegler, Ziegler and Biersack30
III. RESULTS
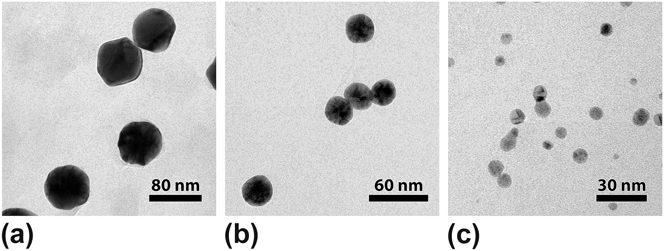
To investigate the fundamental effects of ion energy and length scale on the response of nanostructures, a model experiment was devised using NPs with sizes spanning one order of magnitude. Self-ion irradiation was chosen to maximize the displacement damage and minimize the doping effects. The 46 keV lower energy limit was chosen because nuclear stopping dominates for these ions and the average end-of-range values are comparable to the smallest NPs. In contrast, in the 10 MeV upper limit, the nuclear and electronic stopping both make significant contributions, and the average ion ranges exceed the diameters of the largest NPs. FCC Au NPs have minimal oxidation problems and are ideally suited as a model system that allows the material response to be more readily distinguished. The morphologies of the as-drop cast NPs appear in Fig. 1. Initially most NPs were roughly spherical, although many demonstrated some degree of faceting [Fig. 1(a)], and the NP sizes were mostly consistent with the dimensions reported by the manufacturer. Some of the NPs had begun sintering together [most prominently in the 5 nm NP samples, Fig. 1(c)], either in the solution or in the time between sample preparation and observation. Clustering was more prominent with decreasing NP size and produced some large groups of NPs (dozens to thousands) in the as-deposited samples. This was likely a result of the drop casting and drying procedure. To avoid issues with agglomerated NPs during irradiation (e.g., clusters behaving as larger structures or a continuous film), areas with both isolated single NPs and small groups (∼2–12 NPs) were selected, allowing the observation of ion effects in single NPs, as well as the effects at the NP interfaces.
As-deposited Au NPs on carbon grids. (a) 60 nm, (b) 20 nm, and (c) 5 nm. Note the differences in magnification among the images.

The various tested grid support films affected the NP distributions to different degrees. It appeared that capillary forces in the drying droplets drew the NPs along. This effect was most prominent on the nitride grids, likely due to the nitride surface interacting less with the stabilizing ligands on the NPs. This phenomenon was exploited to control the density of the NPs; by placing a droplet off-center, the droplet would draw most NPs toward the edge as it dried, resulting in a very low density of NPs left in the window area. Thus, both low- and high-density samples were produced in this way. The different NP densities in the samples were important for observing different effects. The areas deposited could be roughly estimated by optically observing the residue left on the grids. Samples deposited on the SiO/Formvar grids were found to be poorly suited for observing the ion effects during the in situ irradiation. Whole NPs on these grids were frequently displaced considerable distances or disappeared completely from the grid during ion irradiation, most likely due to the local charging effects arising from ion interactions with the nonconductive SiO layer. Hence, pure carbon grids were used for the majority of the samples in this study.
A. Cumulative effects
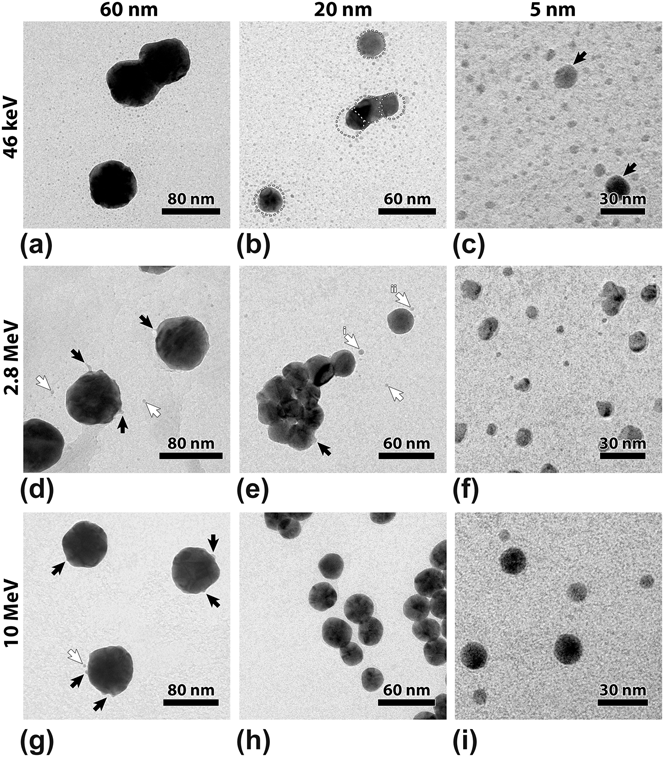
The cumulative effects of the different ion irradiation conditions on NPs of various sizes appear in Fig. 2. All NPs in the 46 keV case [Figs. 2(a)–2(c)] were subjected to an ion fluence of 3.4 × 10¹⁴ ions/cm2. Similarly for the 2.8 MeV case [Figs. 2(d)–2(f)], the fluence was 4 × 10¹³ ions/cm2 for all particles, while for the 10 MeV case [Figs. 2(g)–2(i)] the respective fluences were 4.5, 2.4, and 1.5 × 10¹² ions/cm2. Sputtering of smaller particles and clusters was observed in all NPs at all energies but was most prevalent with the 46 keV beam. As a result, large numbers of sputtered particles surrounded the parent NPs in Figs. 2(a)–2(c). Smaller sputtered particles formed halos around the 60 and 20 nm NPs, as is apparent in Figs. 2(a) and 2(b). The associated material loss is highlighted in Fig. 2(b), where the dotted circles represent the original NP profiles [see Figs. 1(b) and 2(b)]. Halos were not clearly present in the 5 nm NPs in Fig. 2(c), but sputtering was so prominent that many newly sputtered particles began to approach the size of the remaining parent NPs [indicated by arrows in Fig. 2(c)]. NPs initially in contact underwent sintering during irradiation, as illustrated in Fig. 2(b). Small surface protrusions resulting from the 46 keV irradiation were observed in the 60 and 20 nm NPs and were more prominent in the 20 nm NPs.
Postirradiation microstructures showing cumulative effects of ion irradiation. From left to right, the columns are from 60, 20, and 5 nm samples. (a–c) 46 keV irradiation to 3.4 × 10¹⁴ ions/cm2. (b) The same group of NPs from Fig. 1(b). Dotted lines show the initial outlines of the NPs. Arrows in (c) indicate the parent NPs. (d–f) 2.8 MeV irradiation to 4 × 10¹³ ions/cm2. Black arrows denote surface features formed by ion interactions and white arrows indicate sputtered particles. The white arrows labeled i and ii in (e) indicate particles that formed from filaments instead of sputtering. (g–i) 10 MeV irradiation to 4.5, 2.4, and 1.5 × 10¹² ions/cm2.

Increasing the ion energy to 2.8 MeV resulted in less sputtering than with the 46 keV ions, but the sputtered clusters were still observable [Figs. 2(d)–2(f), white arrows]. Sintering was again prominent in NPs initially closely spaced together, as illustrated in Fig. 2(e). Although some surface features were similar to those formed by 46 keV ions, the increased ion energy also created some notably different structures [Figs. 2(d) and 2(e), black arrows]. Nanoscale filaments appeared frequently in the 60 nm NPs [Fig. 2(d)], but were not observed in similar sized NPs irradiated with the 46 keV ions. Such surface features were less frequently found in the 20 nm NPs, and were not observed in the 5 nm NPs. Some 5 nm NPs were found to have developed nonround shapes [Fig. 2(f)].
Further increasing the ion energy to 10 MeV again resulted in sputtered clusters and surface feature formation in the 60 nm NPs, as illustrated by the respective white and black arrows in Fig. 2(g). The effects in the 20 and 5 nm NPs were far less pronounced. In fact, most NPs of those sizes appeared similar before and after irradiation [Figs. 2(h) and 2(i)]. The examination of a large number of 20 nm NPs revealed a few sputtered clusters and a few surface features, but these were rare. In contrast to the NPs irradiated with lower energy ions, sintering was much less prevalent with the 10 MeV ions. The material in the sputtered halos typically surrounded the parent NPs and did not show a strong relationship to the incident beam direction. Likewise, the nanoscale filaments were observed all along the perimeters of the NPs [Figs. 2(d), 2(e), and 2(g)]. The analysis of the electron diffraction patterns also did not indicate a crystallographic orientation dependence for the surface filament development. However, it should be noted that some NPs underwent more significant sputtering than others during exposure to the same fluence [e.g., Fig. 2(b)], suggesting possible shadowing or channeling effects.
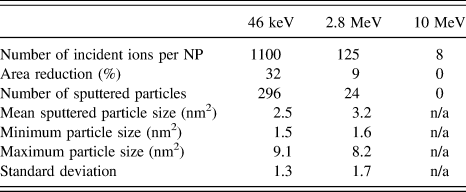
More detailed statistics from the 20 nm NPs and sputtered particles in Figs. 2(b), 2(e), and 2(h) appear in Table I. The area reduction and number of sputtered particles was greatest for the 46 keV beam. However, this beam had a total fluence of nearly an order of magnitude larger than the 2.8 MeV beam. The mean sputtered particle size was largest for the 2.8 MeV beam. Due to the high density of the sputtered particles near the NPs in the 46 keV case, it is likely that some particles agglomerated after sputtering, so the actual average and maximum particle sizes created directly by sputtering were likely smaller than what is reported in the table. Interestingly, the sputtered particles were not observed within this viewing area in the 10 MeV case. This can be attributed in part to this beam having the lowest fluence, but also to a reduced cross-section resulting from the increased energy. Some of the variations in cumulative effects can be attributed to the differences in fluence for the assorted NPs in Fig. 2. Nonetheless, the different interaction volumes presented by the different sized NPs influenced the rate of interactions, and it was also apparent that the ion energy affected the microstructural change.
Projected area analysis for the 20 nm NPs and sputtered particles in Figs. 2(b),2(e) and 2(h).

B. Effects of particle size and ion energy
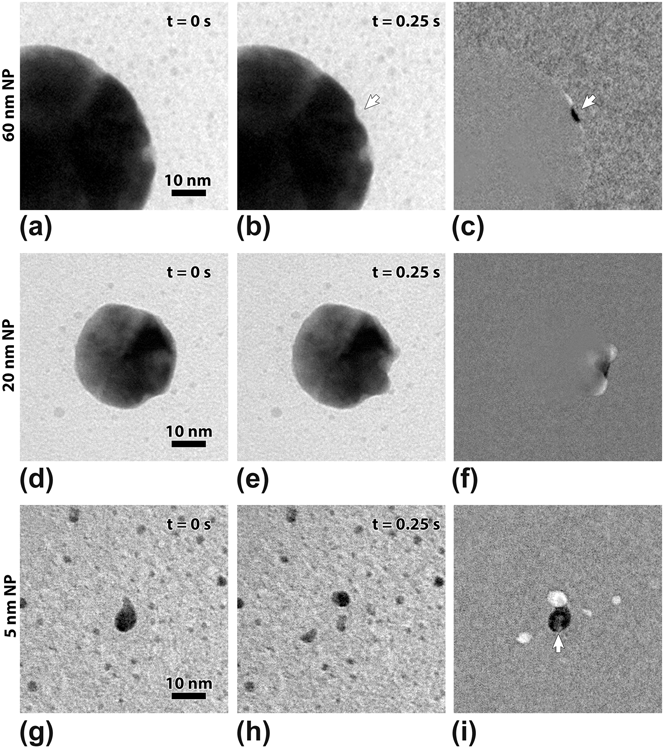
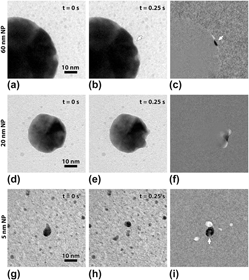
The NP size, ion energy, and ion fluence clearly influenced the cumulative NP evolution seen in Fig. 2. To better understand the effects of the NP size and ion energy, single ion events were studied using in situ ion irradiation. The structural changes wrought by single ions were found to differ with both the NP size and the ion energy. Figure 3 highlights the changing microstructural response to single 46 keV Au ions as a function of the NP size. In the 60 nm NPs, the ion effects were confined to the near-surface regions and only produced small features, like the crater formed in Figs. 3(a) and 3(b). From the projected image, the approximate diameter and depth of the crater are 6.7 and 1.5 nm, respectively. The rest of the NP surface remained essentially static. The change is highlighted in the difference image in Fig. 3(c). Here features present only in Fig. 3(a) appear dark, while those appearing only in Fig. 3(b) are light. Features that are the same in both images appear as a flat gray field. With the reduction of the NP size to 20 nm, single ion interactions affected far greater volumes of the NPs, for example, the crater formed in Figs. 3(d) and 3(e). Considering the projected image in Fig. 3(e), the size of the crater measured from the initial surface was about 5.5 nm wide and 3 nm deep, comparable in size to the crater produced in the 60 nm NP. However, the pronounced edges produced in the collision were substantially larger, measuring 11 nm width and 4.2 nm depth. The difference image in Fig. 3(f) shows the extent to which the crater rim was displaced from the original surface. In the case of the 5 nm NPs, single ion events were even more dramatic. Instead of surface structure changes, the NP in Figs. 3(g) and 3(h) exploded, with the material split among at least 5 smaller particles. The difference image in Fig. 3(i) shows the locations of the original NP and the particles left after the explosion, with the white arrow indicating a fragment that appears faint as it overlaps the original NP. Other single ion events in the 5 nm NPs caused a shape change of the entire particle within 1 frame, suggesting transient melting behavior.
Effects of single 46 keV ions in NPs of decreasing size. Note that the magnification is similar for all micrographs. Each pair of micrographs is separated by 1 frame, about 0.25 s here. (a–c) A single ion strike in a 60 nm NP created a surface crater, marked by the white arrow. (c) The difference image highlights the change between (a) and (b); features present only in (a) are dark and newly formed features present only in (b) appear light. (d–f) A single ion creating a crater in a 20 nm NP. (f) The difference image. (g–i) A ∼5 nm teardrop-shaped NP was initially surrounded by a number of previously sputtered particles. (h) The NP exploded, leaving several particles nearby. (i) Difference image showing the locations of the old and new particles. The white arrow indicates a fragment from (h) that is difficult to see in (i) because it overlapped the original NP location.

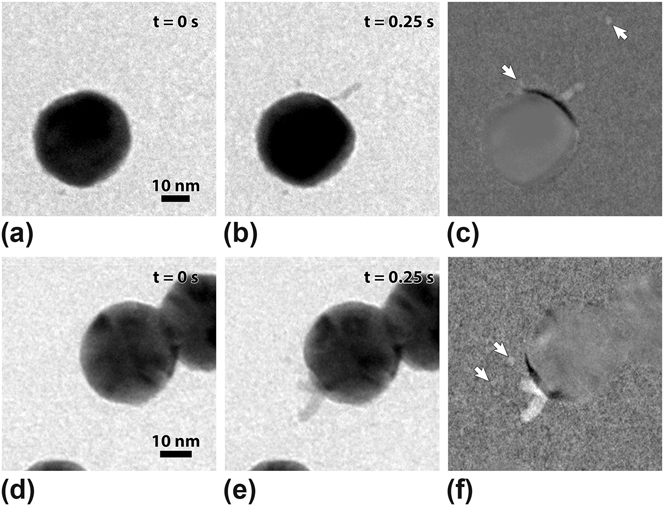
In a similar fashion, ion energies may be varied in NPs of the same diameter to elucidate the effects of the electronic and nuclear stopping powers on the structural evolution. Figure 4 illustrates the effects of 2.8 and 10 MeV ions in 20 nm Au NPs. A typical 46 keV ion strike event was already presented in Figs. 3(c) and 3(d). In the case of a single 2.8 MeV ion [Figs. 4(a) and 4(b)], a filament approximately 12 nm long and a sputtered particle were produced. During the ion interaction, the upper portion of the surface changed from the original profile, while the lower portion remained static [seen in the difference image, Fig. 4(c)]. The effects of the 10 MeV ions were similar to those of the 2.8 MeV ions; the single ion event illustrated in Figs. 4(d) and 4(e) similarly produced a filament approximately 11.6 nm long and sputtered particles approximately 1.1 and 1.7 nm in diameter. The difference image in Fig. 4(f) highlights the filament formation and a small profile change. It should be noted that the filament creation events occurred in 20 nm NPs both with and without an obvious change of the surface during irradiation with 2.8 and 10 MeV ions, and so filament creation did not always coincide with a change in projected area. It is not immediately clear if the absence of changes in the projected area reflected real structural changes, or if information was lost in the projection. To overcome this projection limitation of TEM and better understand the overall distribution of the surface features presented in Figs. (3) and (4), a detailed tomography study was performed alongside in situ ion irradiation.
Effects of varying ion energies in 20 nm Au NPs. (a, b) Filament formation during a 2.8 MeV single ion event. The difference image in (c) highlights the filament formation and profile change of the NP. The white arrows highlight the sputtered particles from (b) that are faint in (c). (d, e) Filament formation by a 10 MeV single ion event. (f) Difference image similar to (c) showing the filament and surface change. The white arrows similarly indicate the faintly visible sputtered particles.

C. 3D reconstructions
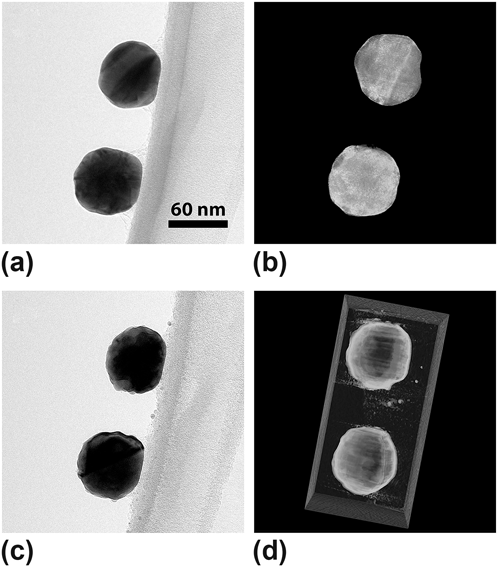
In principle, features discussed in Figs. (2)–(4) might be expected to form in any portion of the NP surface accessible by ions. However, surface structures can only appear unobstructed in the projected image when situated at the edges of the NP, e.g., the craters, bumps, and sputtered particles shown in Figs. (2)–(4). Other features formed along the projection direction were obscured by overlapping the rest of the NP. Overlapping features could sometimes be distinguished; for example, in Fig. 3(e) some of the crater structures can be discerned. Unfortunately this was not always the case; for example, the crater in Fig. 3(b) appears essentially as a silhouette. While additional information about these kinds of surface features can be revealed by collecting individual micrographs at different tilt angles, a more comprehensive view of the NP surfaces may be provided by combining the images into electron tomograms. Once generated, 3D reconstructions can be rotated freely using a computer visualization program, allowing the surfaces to be easily viewed from multiple angles. To better understand the surface morphology and distribution of the sputtered material, sequential tilt series were acquired between intervals of irradiation. The resulting 3D reconstructions provide snapshots in time of the NP structures at different fluences. Figure 5 shows example source micrographs (tilted to approximately −36° in α) alongside the corresponding 3D reconstructions (near 0° tilt) of 60 nm NPs before and after irradiation with 2.8 MeV Au to a fluence of 2.0 × 10¹⁴ ions/cm2. The reconstructions reveal important 3D information; for example, a NP appears similar in projection whether it is on the top or bottom side of the carbon support film. The reconstructions showed that the sputtered material appeared on the carbon film surface, within the carbon film, and at the back. Reference Bufford, Pratt, Boyle and Hattar9 This observation suggests that sputtered material can be embedded within the support film or, in some cases, pass through the carbon. Reconstructions were not made for the 20 and 5 nm NPs, as they mostly lacked the dramatic surface changes seen in the 60 nm NPs.
Source micrographs and 3D reconstructions of 60 nm Au NPs (a, b) before and (c, d) after irradiation with 2.8 MeV Au4+ to a fluence of 2.0 × 10¹⁴ ions/cm2.

D. Generally observed single ion effects
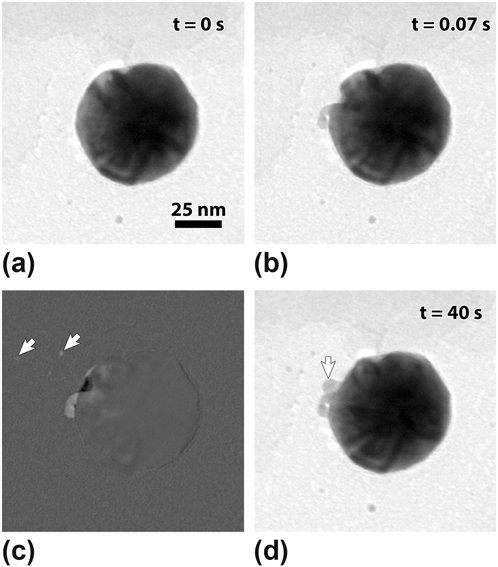
Beyond the size and energy-dependent responses detailed in Figs. (3) and (4), several other commonly observed single ion effects appear in Figs. (6)–(8). Figure 6 illustrates cluster sputtering and the formation of a nanoscale filament, bump, and surface crater in a 60 nm NP by two separate single 2.8 MeV Au ion events. In Fig. 6(b), a filament and two sputtered particles appeared within 1 frame, or 0.07 s. The difference image in Fig. 6(c) shows the sputtered particles, filament, and crater more clearly, while the white arrows indicate two small sputtered particles that otherwise appear faint. The filament here is notably different from those in Fig. 4, which formed nearly perpendicular to the surface with no evidence of a nearby crater. This filament morphology in Fig. 6 appears to be consistent with surface rupturing from an underlying cascade, a phenomenon which will be discussed more in Sec. IV. A subsequent event in Fig. 6(c) captured ∼40 s later illustrates the formation of a smaller bump and two sputtered particles, again within 0.07 s.
Formation of filaments by single 2.8 MeV Au4+ ion strikes in 60 nm NPs. (a, b) The particle before and after the interaction. (c) A difference image highlights the filament, crater, and two sputtered particles (white arrows). (d) A similar event that occurred 40 s later, with a corresponding surface bump (white arrow).

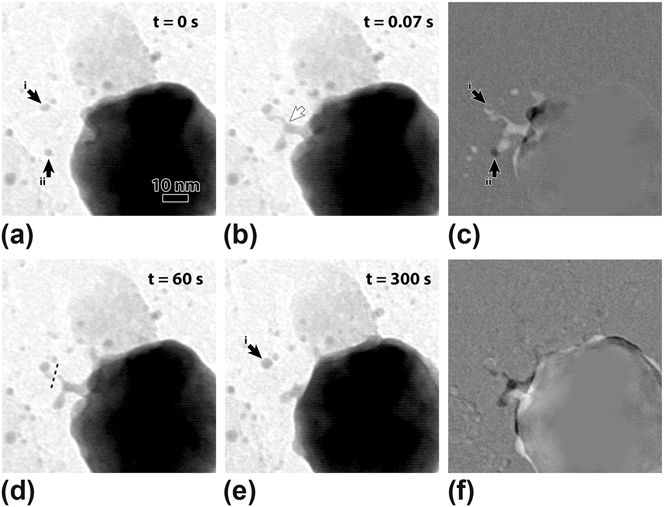
Filament creation in a 60 nm NP by a 2.8 MeV ion, followed by separation and reabsorption. (a) The particle before the event, with black arrows indicating two previously ejected smaller particles, labeled i and ii. (b) A filament was ejected (white arrow) by a single ion. (c) A difference image reveals the location of the ejected filament and particles and the extent of the surface change. The initial positions of particles i and ii are noted by arrows. (d) Over a period of 60 s, the filament separated (dotted line). (e) Part of the filament diffused into particle i, increasing its size. The other portion retracted back to the parent NP. (f) The changes between (d) and (e) are highlighted in a difference image. Two additional surface bumps from ion interactions in the interim are also visible.

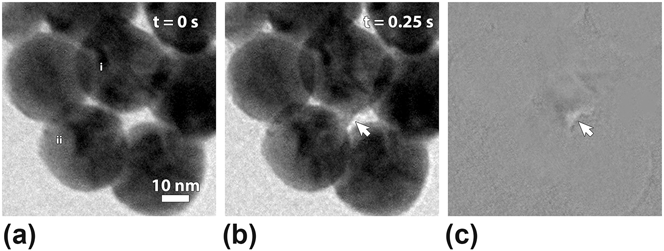
Rapid sintering event due to a single 2.8 MeV ion in 20 nm NPs. (a) Initially two NPs in the center, i and ii, were in contact. (b) In less than 1 frame the neck between them rapidly expanded, as indicated by the white arrow. (c) The new neck material appears lighter in the difference image. For reference, the white arrow is in the same location in (b) and (c). More subtle changes in the stress contours are apparent above the arrow in (c).

Over time, surface features generated by the ion interactions underwent evolution by both gradual diffusion, potentially under the assistance of the electron beam, and more rapid evolution due to subsequent ion interaction-driven events. Figure 7 illustrates the former type of evolution in which a filament formed and interacted with previously sputtered clusters over a period of approximately 300 s. The filament first appeared within 1 frame and was attached to the previously sputtered particles labeled i and ii in Fig. 7(a). The difference image in Fig. 7(c) highlights the ejected material, and the arrows denote the initial positions of the previously sputtered particles. After a period of 60 s with no further identified ion interactions, the filament had separated along its length, as shown by the dotted line in Fig. 7(d). By 300 s [Fig. 7(e)], a portion of the filament had diffused into particle i, increasing its diameter from about 2.3 nm in Fig. 7(a) to 4.6 nm in Fig. 7(e). The rest of the filament retracted toward the NP surface. The difference image in Fig. 7(f) reveals the extent of the change between Figs. 7(d) and 7(e). Similar filament dissociation events also occurred without the presence of the previously sputtered particles. For instance, two particles that appear in Fig. 2(e) (labeled i and ii) formed in this manner.
In contrast to the gradual diffusion processes that modified ion-induced defects, subsequent ion interactions sometimes caused more rapid evolution. For example, surface bumps and craters occasionally disappeared within one frame. This rapid evolution suggests the transfer of a significant amount of energy, enough to greatly enhance flow processes or induce localized melting of the particle. One such flow event appears in Figs. 8(a) and 8(b). Here the neck initially connecting two NPs rapidly thickened within one frame (white arrow), indicating the movement of material. The new material in the neck appears lighter in the difference image in Fig. 8(c). The white arrow is in the same location in Figs. 8(b) and 8(c), for reference. More subtle changes in the stress contours inside NP i are also apparent above the arrow in Fig. 8(c). Again, the rapid movement of the material suggests that a flow process occurred, while the lack of change in the surrounding NPs indicates a localized nature for this phenomenon. The stress contour change accompanying the sintering event indicates that the internal structure was also altered. The dynamics of the single ion effects reported in this manuscript, as well as the 3D reconstructions, can be seen in the supplementary videos associated with the online version of this manuscript. By performing in situ ion irradiation TEM experiments at various ion energies and on various particle sizes in this idealized model system, significant insight can be gained into the structural evolution of nanostructures as a function of nuclear and electronic stopping conditions.
IV. DISCUSSION
A. Utility of in situ observation
The in situ nature of these experiments was particularly useful for identifying transient states, one example of which is the formation of separate particles from parent NPs by processes other than direct sputtering. Figures (1) and (2) represent as-deposited and postmortem states. A good deal of useful information can be collected from these micrographs; however, the dissociation of surface filaments that lead to the formation of separate particles in Fig. 2(e) is not discernable from the still micrographs alone. Figure 7 presents another example of dynamic satellite particle formation; here the sputtered filament interacted with the previously sputtered particles, changing their sizes and locations. Similarly, in Fig. (3) the material ejected by the explosion of the NP combined with nearby particles and changed their sizes. Each of these cases resulted in particles that were of different sizes from those that were directly sputtered, thus affecting the size distribution of the new particles. Hence, attempts to measure the sputtering rates or the sizes of the ejected particle should take this behavior into account. In a similar manner, attempts to measure the rate of crater or filament formation must account for the possibility that these features may disappear due to subsequent ion interactions.
Real time observation was also able to capture the rapidity with which the neck formed between two NPs in Fig. 8. Sintering often occurs as a gradual process dominated by the surface diffusion, although the electron beam may enhance the sintering rates. To this end, NPs under continuous observation and others not exposed to the ion beam were both observed. While sintering has been noted before in irradiated NPs, Reference Bufford, Pratt, Boyle and Hattar9,Reference Chen, Palmer and Wilcoxon27 the rapid nature of the energetic ion-induced sintering may affect the overall sintering rates in NPs subjected to ion bombardment. This phenomenon might be of interest for NP systems where sintering would be detrimental, or it could be harnessed to sinter NPs without global heating above room temperature. Real time observation also made it abundantly clear that many ions passed through the NPs without little or no recognizable effects outside of subtle strain contour changes.
B. Frequency of events
It should be noted that the dramatic changes resulting from the single ion interactions shown in Figs. (3) and (4) and Figs. (6)–(8) represent a minority of the incident ions. Considering the full projected area of ideal 60, 20, and 5 nm diameter spherical NPs, the total ion fluence of 3.4 × 10¹⁴ ions/cm2 in the 46 keV case [Figs. 2(a)–2(c)] corresponds to an average of approximately 9700, 1100, and 70 ions/NP. Similarly for the 2.8 MeV case [Figs. 2(d)–2(f)], where the fluence was 4 × 10¹³ ions/cm2 for all particles, an approximate average of 1100, 125, and 8 ions/NP is obtained. For the 10 MeV ions [Figs. 2(g)–2(i)] respective fluences were 4.5, 2.4, and 1.5 × 10¹² ions/cm2, corresponding to an approximate average of 125, 8, and 0.3 ions/NP for the 60, 20, and 5 nm NPs. With the exception of the largest NPs and the highest flux beam (60 nm NPs, 46 MeV ions), the average ion flux per NP was less than 0.5 ions/s. This flux allowed ample time to identify single ion interactions during the video recording. Although approximately 3 ions/s were incident on the 60 nm NPs under the 46 keV beam, the large NP size relative to that of the ion-induced structural changes allowed single ion events to be identified reasonably well. In all cases, the fluxes were far from the cascade-overlap regime.
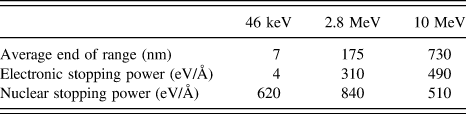
For the 46 keV ions incident on 60 nm NPs in Fig. 2(a), small changes occurred along the surface at a rapid rate. However, for the 60 nm NPs subjected to 2.8 MeV ions in Fig. 2(d), only about 5 large surface features are readily visible on each NP, corresponding to only about 0.5% of the incident ions. The reasons for this behavior can be better understood by considering several aspects of the ion-solid interaction, as listed in Table II. The 46 keV ions have a comparatively short end of the range, low electronic stopping power, and high nuclear stopping power. For the MeV-range ions, the average end of the range was much higher and the electronic stopping power increased dramatically. Hence, it is clear that many of the 46 keV ions strongly interacted with the NPs, whereas many of the 2.8 and 10 MeV ions passed completely through with minimal observable structural changes. The primary questions with regard to the various observed effects include determining how the type of cascades and proximity to the surface affect the resulting structural changes.
Ion interaction parameters computed by SRIM. Reference Ziegler, Ziegler and Biersack30

C. Size effects
A good place to start is to consider the maximum energy of a single cascade before it splits into subcascades. MD simulations of single self-ion cascades in Au predicted a maximum energy for single cascades of 10–20 keV. Reference Nordlund, Ghaly, Averback, Caturla, de la Rubia and Tarus31 These cascades produced cavitation and displacement of ∼5000 atoms (in the 10 keV case), resulting in local reordering and defect production. Subsequent simulations investigated the surface damage produced when these cascades occurred at different distances below a flat surface. Reference Ghaly, Nordlund and Averback32 When such cascades were far from the surface, the cascade volume liquefied, then recrystallized, leaving vacancies and dislocations in the bulk, but having little effect on the surface. In contrast, with cascades at shallower depths, the viscous flow of material to the surface and microexplosions occurred. Thus, surface effects can be expected for cascades in which the depth of the center of energy is less than or equal to the radius of the cascade. The authors noted hydrostatic pressures within the cascades exceeding 10 GPa, which caused the material to flow to the surface and in rare cases to violently rupture it. They also did not observe microexplosions for ions below 20 keV.
The NPs differ from the previously mentioned MD studies of near-surface effects in that they present a fixed volume. Surface proximity clearly influences whether an ion will cause a large surface damage event or dissipate its energy into the bulk. Au and other heavy, relatively low melting point, metals have high stopping powers that localize energy within a few nanometers of the surface, making them ideal for cratering and explosions. The authors of the previously mentioned studies found ion penetration depths and energy centers on the order of 5 nm for ions in the 10–20 keV range, similar to the ∼7 nm average range for the 46 keV Au predicted by SRIM. Accordingly, the volumes that can be reached by the 46 keV ions (i.e., material within 7 nm of the surface) correspond to 16% for 60 nm NPs, 36% for 20 nm NPs, and the entire volume of the 5 nm NPs. Considering the aforementioned 5000 atoms displaced in a cascade, they make a sphere of ∼5.5 nm in diameter. For the 60 nm NPs, this corresponds to a volume fraction of only 0.08%. For the 20 nm NPs this increases to 2%, and the volume of the 5 nm NPs is obviously exceeded. This analysis makes it clear that much of the volume is inaccessible to the 46 keV ions in the 60 nm NPs, whereas much of the volume of the 20 and 5 nm NPs can be affected.
From Fig. 3, it is apparent that a similar transfer of energy will have quite different effects in NPs of different sizes. A transition occurs with decreasing size, from surface effects in the 60 nm NPs, to more substantial cratering in 20 nm NPs, to full NP effects in the 5 nm NPs. The cratering and disintegration seen in Fig. 3 is qualitatively similar to the structures predicted by MD simulations of self-ion bombardment in the range of 16–64 keV of flat surfaces and 20 nm Au NPs. Reference Zimmermann and Urbassek13 The 60 nm NPs behaved much like the simulated flat surface, while the 20 nm NPs developed craters comparable to those in the simulation, although with somewhat less severe damage. The disintegration of the 5 nm NPs was also predicted by the MD simulations of 40–100 keV self-ion bombardment of similarly sized Au NPs. Reference Kissel and Urbassek12,Reference Zhurkin14 For the most part, the experimental results using 46 keV ions were consistent with the MD simulations; interactions with higher energy ions brought a few changes not seen in the simulations.
D. Effects of increasing energy
As mentioned in Sec. IV. B, the electronic stopping power increases considerably from the 46 keV ions to the 10 MeV ions. It has been shown previously Reference Bufford, Pratt, Boyle and Hattar9 that the predicted energy transfer into Au NPs during electronic interactions with the MeV-range ions should be enough to substantially heat or even melt the NPs. However, a comparison of the in situ observations and ion fluxes indicate that transient melting events only occurred for a small minority of the incident ions. The infrequent NP changes suggest that much of that energy is not actually transferred; this behavior might be related to the recapture or escape of the excited electrons within the limited NP volume, but further work is needed to validate such a hypothesis.
The higher energy 2.8 and 10 MeV ions produced some surface features similar to those observed with lower energy ions. For example, the crater in Figs. 6(a) and 6(b) can be interpreted as surface rupturing behavior caused by high pressure from a single near-surface cascade. Reference Ghaly, Nordlund and Averback32,Reference Merkle and Jager33 Here the “lid” of the crater remained attached instead of being ejected as a free particle. In these and other studies, ions with energies of 100 keV and below were sufficiently energetic to cause cratering of Au surfaces. However, some behaviors not seen with lower energy ions emerged with increasing energy. The long nanoscale filaments created by the 2.8 and 10 MeV ions in the 20 and 60 nm NPs seen in Fig. 4 were not observed in our experiments with the 46 keV ions or in MD simulations, where the maximum energy used was 100 keV. This suggests that more than 46 keV was required to cause these events, as well as NPs with a diameter greater than 5 nm. Additionally, the rapid shape change of significant portions of the NPs, as in Fig. 4, indicates substantial energy transfer to a large volume of the NP. This may indicate a transient melting of the NP. Reference Jarvi, Pohl, Albe, Rellinghaus, Schultz, Fassbender, Kuronen and Nordlund19 The single cascade energy is on the order of tens of keV and 46 keV ions that appeared to affect entire 5 nm NPs but only parts of 20 nm NPs. It is therefore reasonable to think that the rapid shape change events caused by the MeV ions in the 20 nm NPs exceed the single cascade energy and may indicate more complicated, cascade-splitting behavior. The role of these additional cascades is not immediately clear. While a small number of cascades would be expected for single 46 keV ions, it is plausible that some rare events with the 2.8 and 10 MeV ions might transfer a great deal of energy, leading to the formation of several cascades by a single ion. Furthermore, the long range of the MeV ions in comparison with the NP diameters allows the ions to reach the entire NP volume, potentially causing cascades anywhere within the NPs. The formation of the surface filaments on all surfaces of the 60 and 20 nm NPs with no clear relation to the beam direction is consistent with ions reaching all parts of the NPs. In addition, the frequent events in which the strain contours within the NPs changed without obvious surface damage also suggest that ions affect the entire NP volume. The changing strain contours also suggest that the cascades may have produced defects or made subtle internal structure changes, Reference Jarvi, Kuronen, Nordlund and Albe16 without affecting the surface. Computational modeling and further experimental testing are underway to better understand the roles of the electronic and nuclear energy transfer and the nature of collisions that lead to the formation of different surface features.
V. CONCLUSIONS
A fundamental understanding of the radiation response of NPs is needed to ensure radiation tolerance and to predict the material response for controllable ion beam modification. To better understand the effects of the NP size and ion energy on microstructural change, Au NPs with nominal diameters of 5, 20, and 60 nm were observed in situ during irradiation with Au ions with energies of 46 keV, 2.8 MeV, and 10 MeV. Ions of all energies sputtered smaller clusters from the NPs of all sizes, and structural changes depended on both the NP size and the ion energy. The effects of the 46 keV ions in the 60 nm NPs were mostly confined near the surface, but the relative magnitude of the structural changes increased with decreasing NP size. In contrast, the 20 nm NPs developed large craters and the 5 nm NPs were transiently melted or broken apart explosively. Increasing the ion energy caused more dramatic effects; MeV-range ions produced nanoscale filaments extending from the surfaces of the 60 and 20 nm NPs, and shape changes occurred in the 5 nm NPs. However, the frequency of the interactions fell with increasing energy and decreasing NP size, such that the 5 nm NPs were largely unaffected by the 10 MeV ions.
In situ ion irradiation TEM provides a means to study the structural evolution of the NPs in real time over a range of ion energies and reaches time and length scales intermediate between the simulations and ex situ studies. The technique allowed the observation of the dynamic behavior of single-ion-induced defects that might have otherwise been missed, including the formation and disappearance of various surface structures, sintering behavior, and explosive splitting of NPs.
Supplementary Material
To view supplementary material for this article, please visit http://dx.doi.org/jmr.2014.259
ACKNOWLEDGMENTS
The authors thank J. Hinks (University of Huddersfield), G. Tucker (Drexel University), S. House (University of Illinois at Urbana-Champaign), and T.J. Boyle, D.L. Buller, J.S. Custer, B.A. Hernadez-Sanchez, K. Jungjohann, A.N. Kinghorn, P. Lu, S.H. Pratt, and W. Wampler (Sandia National Laboratories) for their helpful assistance and discussions. The tomograms were modified using the UCSF Chimera package from the Computer Graphics Laboratory, University of California, San Francisco (supported by NIH P41 RR-01081). This work was supported by the Division of Materials Science and Engineering, Office of Basic Energy Sciences, U.S. Department of Energy. Sandia National Laboratories is a multiprogram laboratory managed and operated by the Sandia Corporation, a wholly owned subsidiary of the Lockheed Martin Corporation, for the U.S. Department of Energy's National Nuclear Security Administration under contract DE-AC04-94AL85000.