Implications
This paper summarizes results of an Austrian research project concerning the greenhouse gas (GHG) emissions from commercial biogas plants. Two major conclusions could be drawn based on the project results: (1) GHG emissions were lower for systems using manure and organic residues compared with biogas systems using energy crops only. (2) Digestate management strongly influenced the total GHG emissions from biogas systems. Therefore, it is important to seal digestate stores of newly erected biogas plants and to follow the rules of ‘good agricultural’ practice in order to maximize the existing GHG mitigation potential of biogas systems.
Introduction
Biogas is produced during the anaerobic digestion of different biomass resources and is often used for heat and electricity generation in combined heat and power generation plants (Kaltschmitt and Streicher, Reference Kaltschmitt and Streicher2009). Biogas can also be upgraded to biomethane, which is a renewable fuel with similar characteristics to natural gas (Theißing, Reference Theißing2006). It can therefore be used in the same applications as natural gas for heat and electricity production, or as a transportation fuel.
The environmental effects of the production and use of biogas and biomethane in Austria were analyzed and evaluated in a research project funded by the Austrian Climate and Energy Fund. In the project ‘Life cycle assessment of biogas plants – success factors for the sustainable use of biogas technology based on biogas plants in operation’ (Pucker et al., Reference Pucker, Jungmeier, Siegl, Pötsch, Stuhlbacher, Ebner-Ornig, Kirchmayr and Bochmann2010), six existing Austrian biogas plants were comprehensively investigated to determine critical factors for sustainable biogas technology. This paper focuses on results concerning the effects of biogas systems on greenhouse gas (GHG) emissions, highlighting interactions with agricultural management practices.
Material and methods
Life-cycle assessment (LCA) of six commercial biogas plants
In order to evaluate the GHG emissions of six commercial biogas plants, an LCA was performed. An LCA is a method to investigate and evaluate the environmental impacts (here GHG emissions in CO2-eq) of a given product or service, based on the identification of energy and materials inputs and emissions released to the environment. An LCA considers the environmental impacts over the entire lifetime of the product ‘from cradle-to-grave’ (Bird et al., Reference Bird, Cowie, Cherubini and Jungmeier2011).
For the LCA of the biogas systems the following processes were considered:
• production and collection of substrates,
• fermentation of the substrates in a biogas plant,
• upgrading of biogas to biomethane (if applicable) and
• use of biogas or biomethane.
Furthermore, the LCA included the GHG emissions (in CO2-eq) of construction, operation and dismantling of all components of the biogas plant, CHP plant and upgrading unit. The analysis also accounted for the use of liquid digestate by-product of biogas production as an organic fertilizer for crop production.
Inputs for the LCA was based on the real operational data from six commercial plants in Austria that are producing biogas for combined electricity and heat generation. In one case, biogas is upgraded to biomethane and supplied to the natural gas grid. Different mixtures of the following substrates were considered as input for the biogas systems:
• Energy crops (e.g. maize silage)
• Grassland biomass
• Livestock manure (cattle slurry, pig slurry)
• Organic residues (e.g. fruit residues, vegetable residues, fatty residues)
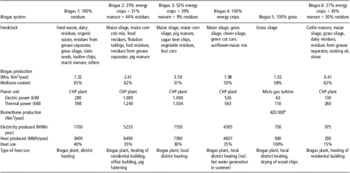
Table 1 gives an overview of the basic characteristics of the six biogas systems. The naming of the systems, for example, biogas system 1 (100% residues), is based on the proportions of the different feedstocks in the total feedstock mix, on a fresh mass basis.
Characteristics of six Austrian biogas systems evaluated in this paper

aUpgrading technology: pressure swing adsorption.
Comparison to reference systems
The GHG emissions (in CO2-eq) of each system were compared with different reference systems. The following issues are important in making this comparison and so were included in the choice of reference systems:
1. The same amount of agricultural area is used for both systems, addressing the question: ‘What happens with the land if it is not used to produce substrate for the biogas system?’ (referred to as ‘reference use of agricultural area’).
2. The same amount and type of organic residues and livestock manure is considered in both systems, addressing the question: ‘What happens with the organic residues/livestock manure if it is not used as feedstock for the biogas systems?’ (referred to as ‘reference use of residues and livestock manure’)
3. The biogas system and the reference system have to provide the same system output (‘functional unit’). The functional unit was specified to be 1 MWh of useful energy. As the biogas systems provide heat and electricity, the megawatt hour is split up into different proportions of heat and electricity (e.g. 0.77 MWh electricity and 0.23 MWh heat). The balance between electricity and heat differs between the biogas systems, depending on the potential to use heat from the CHP plant (e.g. local district heating, process heat). Biogas system 5 (100% grass) provides heat, electricity and biomethane that is supplied into the natural gas grid and is assumed to be used as transportation fuel in a passenger car. Therefore, the functional unit of biogas system 5 (100% grass) includes 0.05 MWh electricity, 0.105 MWh heat and 0.845 MWh biomethane. A passenger car can travel 1148 km with 0.845 MWh of biomethane.
Using data from existing operational biogas plants has the drawback that the balance of electricity, heat and fuel differs between systems, so that systems cannot be compared directly. Results always refer to the biogas system in comparison to its corresponding reference system.
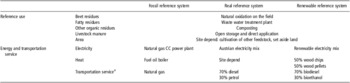
In accordance with Austrian energy and biogas experts, three different reference systems were defined (Table 2).
Characteristics of the reference systems used as comparators for the six biogas plants evaluated in this paper

aOnly applicable for comparison with biogas system 5 (100% grass).
1. The ‘fossil reference system’ is based on fossil energy sources. Electricity is provided by natural gas, heat by fuel oil and natural gas is used as transport fuel.
2. The so called ‘real reference system’ represents the actual situation before the biogas system was implemented. For electricity, the Austrian electricity production mix in 2007 was used, with 53% large-scale hydro power, 7.2% small-scale hydro power, 9.7% bituminous coal, 4.0% fuel oil, 15.2% natural gas, 5.9% solid biomass, 0.8% biogas, 0.8% municipal waste incineration and 3.1% wind power, whereas imported electricity was not included (Energie Control GmbH, 2009). The heat supply was different for each biogas plant, depending on the local situation. Seventy percent of transportation is provided by a diesel- and 30% by a petrol-fuelled passenger car, representing the current average fuel consumption for transportation in Austria.
3. The ‘renewable reference system’ is based on renewable energy sources other than biogas. For electricity, a renewable mix is assumed to consist of 49% hydro power, 30% wind power, 20% biomass and 1% photovoltaic. This renewable mix is a scenario representing the expansion of renewable electricity plants in Austria until 2020 (Hochmair, Reference Hochmair2010). Heat is provided by wood chips (50%) and wood pellets (50%). Seventy percent of the transportation service is provided by a biodiesel and 30% by a bioethanol fuelled passenger car.
Example for system modeling
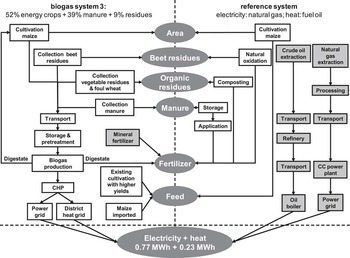
Figure 1 shows the system modeling using biogas system 3, in which energy crops (52%), livestock manure (39%) and organic residues (9%) are used as substrates. The biogas product is used in a CHP plant to generate heat and electricity. For those areas where maize is cultivated for biogas production, the reference use is the cultivation of maize as livestock feed. Maize silage and maize grain are not available for animals if the maize is used in the biogas system. Therefore, additional maize needs to be produced for this biogas system. It is assumed that a part of this demand is covered by increased yields, with the recent trend showing 1.2% annual growth in maize yield per hectare in Austria (based on annual test reports for the period 1994 to 2011 by the Styrian Chamber of Agriculture; Landeskammer für Land- und Forstwirtschaft Steiermark, 1994–2011). It is assumed that the rest is imported from neighboring Hungary, and since this is also mainly achieved from yield increases, there was no further consideration of possible effects on land use in Hungary.
System modeling for life-cycle assessment (LCA) of biogas system 3 (52% energy crops + 39% manure + 9% residues).

The reference use of livestock manure was assumed to be direct application of undigested manure as fertilizer and the GHGs from storage and application were considered. Composting was the reference use for organic residues and spoiled wheat. The reference use of sugar beet residues was direct application on arable land as a green manure. The fermentation residues from the digestion process were assumed to be stored and used as organic fertilizer. The biogas system shown in Figure 1 has one closed and five open storage tanks. It was assumed that closed digestate storage tanks are gas-leak proof for all of the systems. Eighty percent (on a wet basis) of the digestate was used as fertilizer on areas where maize is cultivated for use in the biogas production, so no additional mineral fertilizer was needed. The remaining digestate is compared with the fertilizer value of the reference systems (composting, undigested slurry application and direct use of sugar beet residues on fields). The nutrient balance of the biogas system compared with the reference systems, showed a nutrient deficit for the biogas system 3 shown in Figure 1, which would need to be made up using synthetic mineral fertilizer. Therefore, the LCA included the annual production and use of 10 tons of nitrogen, 6 tons of phosphorus and 4 tons per year potassium.
Global warming potentials (GWP) and GHG emissions factors
The GHGs included in the LCA were carbon dioxide (CO2), methane (CH4) and nitrous oxide (N2O). Indirect N2O emissions (caused by atmospheric deposition of nitrogen and by nitrogen leaching from soils) were not included. GWP on a 100 year time horizon were used to express the contribution of CO2, CH4 and N2O to global warming, in terms of equivalent amount of CO2 (CO2-eq). The contribution to global warming of 1 kg CH4 corresponds to 25 kg CO2-eq. and that of 1 kg N2O to 298 kg CO2-eq. (Solomon et al., Reference Solomon, Qin, Manning, Chen, Marquis, Averyt and Tignos2007). Biogenic CO2-emissions from biomass and biogas combustion were considered zero, because of the uptake via photosynthesis according to IPCC guidelines (Houghton et al., Reference Houghton, Meira Filho, Lim, Trèanton, Mamaty, Bonduki, Griggs and Callander1996).
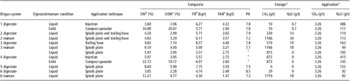
In the LCA, N2O and CH4 emission factors for the storage and CH4 emission factors for the application of digestate (manure in the reference systems) were based on literature values taking into account their actual composition (DM, ODM, TN, TAN, pH) in comparison to the compositions stated in the literature (Table 3). For the calculation of N2O emissions from the application of digestate/manure, the IPCC Tier 1a emission factor for direct soil emissions (1.25%) was applied (Eggleston et al., Reference Eggleston, Buendia, Miwa, Ngara and Tanabe2006; Environment Agency Austria, 2009a). Ammonia and N2O losses during storage and NH3 losses during application were considered for the calculation of direct N2O emissions from the soil. Indirect N2O emissions from soil were not considered. A 2.95-times higher N2O-emission factor was used in the case of digestate injection in comparison with spreading (Wulf et al., Reference Wulf, Meating and Clemens2002 and Reference Wulf, Jager and Döhler2005).
Characteristics, composition and average CH4 and N2O emissions from the storage and application of the digestate/manure of the six biogas plants investigated in this paper

Calculated by Pucker et al. (2010) based on Hüther and Schuchardt (1998), Ross et al. (1999), Sommer et al. (2000), Edelmann et al. (2001), Külling et al. (2001), Schimpl (2001), Sommer and Hutchings et al. (2001), Amon et al. (2002), Hersener et al. (2002), Wulf et al. (2002), Kaparaju and Rintala (2003), Kryvoruchko (2004), Olesen et al. (2004), Bundesforschungsanstalt für Landwirtschaft (2005), Wulf et al. (2005), Amon et al. (2006), Clemens et al. (2006), Laaber et al. (2007), Eggleston et al. (2006) and Environment Agency Austria (2009).
bDry matter.
cOrganic dry matter.
dTotal nitrogen based on fresh weight.
eTotal ammonium nitrogen based on fresh weight.
fNot known.
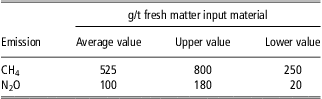
For the composting process in the reference system, CH4 and N2O emission factors were used according to a study on the current state of technology of Austrian composting systems (Austrian Federal Ministry of Agriculture, Forestry, Environment and Water Management, 2005); these are shown in Table 4.
Emission factors for CH4 and N2O for composting (Austrian Federal Ministry of Agriculture, Forestry, Environment and Water Management, 2005)
Analyses and measurements on CHP units showed that they have a so-called ‘methane slip’, because of incomplete combustion. This results in CH4 emissions in the flue gas. Woess et al. (Reference Woess, Bird, Enzinger, Jungmeier, Padinger, Pena and Zanchi2011) reports an average methane slip value of 1.79% for Austrian biogas CHP plants, whereas Vogt (Reference Vogt2008) quotes an average value of 0.5%. On the basis of these sources, an average methane slip of 1% was used in this LCA. Diffuse methane leakage (e.g. piping) was not included.
Owing to the high degree of variability and to investigate the influence on the overall GHG emissions of CH4 and N2O emission factors from manure and digestate management of the biogas systems, sensitivity analyses were performed using a minimum, maximum and average value approach. The influence of varying CH4 and N2O emission factors for composting, digestate and livestock manure storage and application were investigated.
Results
Table 5 shows the results of the LCA on the GHG emissions for the different biogas systems. Each of the systems had a specific system design (different feedstock combination, different system output, different reference use of agricultural area and residues). Therefore, the GHG balance is only valid for these specific biogas plants. A ranking of the investigated biogas plants was not possible but key factors influencing the results could be identified.
GHG emissions of the investigated biogas systems and comparison to reference systems

a1.148 km/passenger car from 0.85 MWh of biomethane.
The GHG emissions of the biogas systems were compared with the three reference systems, which supply the same amount of heat, electricity and biomethane. All biogas systems had lower GHG emissions than fossil reference systems. The biogas systems reduced the GHG emissions by 60% to 100%. Compared with the renewable reference system based on hydro power, solar, wind and biomass, five out of six biogas systems caused higher GHG emissions.
Biogas system 1 (100% residues) had a negative effect on net N2O emissions originating from the reference use of the feedstock, which for the majority of the substrates are aerobically composted. The N2O emissions from the composting process are higher than the N2O emissions from the biogas system, which results in negative N2O emissions in total. Biogas system 2 (25% energy crops + 31% slurry + 44% residues) also showed very low N2O emissions because of the avoidance of N2O emissions from composting, storage and application of undigested slurry. For systems with a higher proportion of energy crops, N2O emissions made the highest contribution to GHG emissions. Biogas system 4 (100% energy crops) showed especially high N2O emissions, most of which arose from direct N2O emissions (nitrification and denitrification processes) from soil management. The energy crops were fertilized using digestate from the biogas plant which is partly applied using and injection technique, showing some benefits (e.g. uniform distribution, low to zero risk of ammonia volatilization, very low risk of crop contamination, low risk of odor emissions and wind drift (Lukehurst et al., Reference Lukehurst, Frost and Al Seadi2010), but according to Wulf et al. (Reference Wulf, Meating and Clemens2002 and Reference Wulf, Jager and Döhler2005), it causes 2.95 times higher N2O emissions in comparison to splash plate or trailing hose applications. Methane emissions from the biogas systems are mainly linked to open digestate storage tanks and the unavoidable methane slip of the CHP combustion engine, which was assumed to be 1%. Biogas system 5 (100% grass) is an exception with a sealed digestate storage tank. Therefore, the CH4 emissions in this system are mainly linked to the combustion process in the engine of the passenger car. Biogas system 6 (27% energy crops + 43% slurry + 30% residues) had a negative effect on net CH4 emissions because of the avoidance of emissions from storage and application of undigested cattle manure.
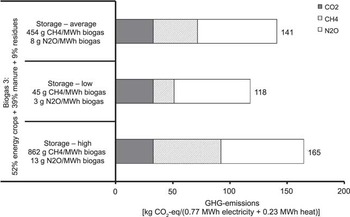
To emphasize the influence of different emission factors for CH4 and N2O emissions from digestate storage and application, a sensitivity analysis was performed. Figure 2 shows the results for varying the CH4 and N2O emissions from digestate storage for biogas system 3 (52% energy crops + 39% manure + 9% residues). N2O emissions from the digestate store were lower compared with emissions following digestate application, with the consequence that variation in N2O emissions from storage had little impact on the overall GHG emissions. Varying CH4 emissions from the digestate store had a greater impact on the overall GHG emissions of the biogas system.
Greenhouse gas (GHG) emissions of biogas system 3 (52% energy crops + 39% manure + 9% residues) for varying CH4 and N2O emissions during storage of digestate.

For biogas system 4 (100% energy crops), the total GHG emissions were modeled using three different values for direct N2O emissions from soil (lower, average and upper). The influence on the total GHG emissions of the biogas system was significant. Assuming an upper value of 21 kg N2O/ha per year, the GHG emissions increase from 190 to 279 kg CO2-eq for 0.71 MWh electricity and 0.29 MWh heat. Assuming a lower value of 2 kg N2O/ha per year, the total GHG emissions decrease to 84 kg CO2-eq for 0.71 MWh electricity and 0.29 MWh heat.
Discussion
The results of the LCA, based on six existing biogas plants in Austria, showed that CH4 and N2O emissions from digestate and manure management can significantly influence the total GHG emissions of a biogas system. A similar conclusion was drawn by Meyer-Aurich et al. (Reference Meyer-Aurich, Schattauer, Hellebrand, Klauss, Plöchl and Berg2012), who studied the GHG mitigation potential of using biogas from cattle slurry and maize to produce heat and electricity under German conditions. The uncertainty analysis with 14 parameters showed that uncertainties because of fertilizer-induced N2O emissions from the soil had the largest influence on GHG emissions when the digestate was stored in gas-leak proof tanks. With open digestate storage tanks, the uncertainty of emissions from the digestate dominated the variability in GHG emissions.
Our results show a higher variability in total GHG emissions as N2O from digestate application as a fertilizer than by CH4 emissions from the digestate stores. In contrast to Meyer-Aurich et al. (Reference Meyer-Aurich, Schattauer, Hellebrand, Klauss, Plöchl and Berg2012), the digestate application technique was included in the calculation of the N2O emissions.
The LCA presented in this paper is based on existing operational biogas plants and are valid for these specific system designs – changes in system design, feedstock and reference use of agricultural area could lead to different conclusions.
Conclusions
An LCA of GHG emissions from six different commercial biogas plants was performed. These biogas systems were compared with three different reference systems: (1) fossil, (2) real and (3) renewable reference system. The LCA showed that in all cases, both the fossil reference system and the real reference system, resulted in higher GHG emissions (in CO2-eq) than the biogas systems (20% to 6810% higher). The GHG emissions were lower for systems using manure and organic residues, compared with biogas systems using only energy crops. Compared with the renewable reference system based on hydro power, solar, wind and biomass (woodchips and pellets), five out of six biogas systems had higher GHG emissions. N2O and CH4 emissions from digestate management strongly influenced the total GHG emissions from biogas systems. Therefore, it is important to seal digestate stores of newly erected biogas plants and to follow the rules of ‘good agricultural practice’ at the digestate application stage, to maximize the GHG mitigation potential of biogas systems.
Acknowledgments
The work for this paper was conducted by the Austrian project ‘Life cycle assessment of biogas plants – success factors for the sustainable use of biogas technology based on biogas plants in operation’, which was financed by the Austrian Climate and Energy Fund and carried out within the framework of the program ‘Energy systems of Tomorrow’. The authors thank the other members of the project team Arnold Stuhlbacher, Günther Bochmann, Roland Kirchmayer and Franz-Josef Ebner-Ornig.
This paper was published as part of a supplement to animal, publication of which was supported by the Greenhouse Gases & Animal Agriculture Conference 2013. The papers included in this supplement were invited by the Guest Editors and have undergone the standard journal formal review process. They may be cited. The Guest Editors appointed to this supplement are R. J. Dewhurst, D. R. Chadwick, E. Charmley, N. M. Holden, D. A Kenny, G. Lanigan, D. Moran, C. J. Newbold, P. O'Kiely and T. Yan. The Guest Editors declare no conflict of interest.