




No CrossRef data available.
Article contents
Visualizing genetic similarity at the symptom level: The example of learning disabilities
Published online by Cambridge University Press: 29 June 2010
Abstract
Psychological traits and disorders are often interrelated through shared genetic influences. A combination of maximum-likelihood structural equation modelling and multidimensional scaling enables us to open a window onto the genetic architecture at the symptom level, rather than at the level of latent genetic factors. We illustrate this approach using a study of cognitive abilities involving over 5,000 pairs of twins.
Information
- Type
- Open Peer Commentary
- Information
- Copyright
- Copyright © Cambridge University Press 2010
References
Davis, O. S. P., Haworth, C. M. A. & Plomin, R. (2009) Learning abilities and disabilities: Generalist genes in early adolescence. Cognitive Neuropsychiatry
14(4):312–31.CrossRefGoogle ScholarPubMed
Gower, J. C. (1966) Some distance properties of latent root and vector methods used in multivariate analysis. Biometrika
53(6):325–28.CrossRefGoogle Scholar
Haworth, C. M. A., Harlaar, N., Kovas, Y., Davis, O. S. P., Oliver, B. R., Hayiou-Thomas, M. E., Frances, J., Busfield, P., McMillan, A., Dale, P. S. & Plomin, R. (2007) Internet cognitive testing of large samples needed in genetic research. Twin Research and Human Genetics
10(4):554–63.CrossRefGoogle ScholarPubMed
Mardia, K. V., Kent, J. T. & Bibby, J. M. (1979) Multivariate analysis. Academic Press.Google Scholar
Neale, M. C., Boker, S. M., Xie, G. & Maes, H. H. (2006) Mx: Statistical modeling, 7th edition. Virginia Commonwealth University.Google Scholar
Oliver, B. R. & Plomin, R. (2007) Twins Early Development Study (TEDS): A multivariate, longitudinal genetic investigation of language, cognition and behavior problems from childhood through adolescence. Twin Research and Human Genetics
10(1):96–105.CrossRefGoogle ScholarPubMed
Plomin, R., DeFries, J. C., McClearn, G. E. & McGuffin, P. (2008) Behavioral genetics, 5th ed. Worth.Google Scholar
Plomin, R., Haworth, C. M. A. & Davis, O. S. P. (2009) Common disorders are quantitative traits. Nature Reviews:Genetics
10(12):872–78.CrossRefGoogle ScholarPubMed
Plomin, R. & Kovas, Y. (2005) Generalist genes and learning disabilities. Psychological Bulletin
131(4):592–617.CrossRefGoogle ScholarPubMed
R Development Core Team. (2009) R: A language and environment for statistical computing. R Foundation for Statistical Computing.Google Scholar
Tufte, E. R. (2001) The visual display of quantitative information, 2nd edition. Graphics Press.Google Scholar
Wellcome Trust Case Control Consortium. (2007) Genome-wide association study of 14,000 cases of seven common diseases and 3,000 shared controls. Nature
447:661–78.CrossRefGoogle Scholar
Young, G. & Householder, A. S. (1938) Discussion of a set of points in terms of their mutual distances. Psychometrika
3(1):19–22.CrossRefGoogle Scholar
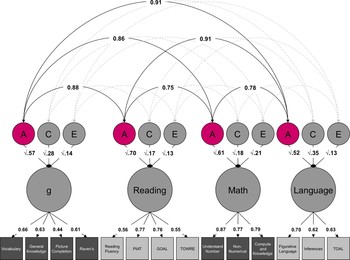
Figure 1. Latent factor twin model with genetic correlations highlighted: A, additive genetic effects; C, shared (common) environmental effects; and E, nonshared environmental effects. Squares represent measured traits, and circles represent latent factors. The lower tier of arrows represents factor loadings, and the second tier represents genetic and environmental path coefficients. The curved arrows at the top represent correlations between genetic (solid lines) and environmental (dotted lines) latent factors. Adapted from Davis et al. (2009).
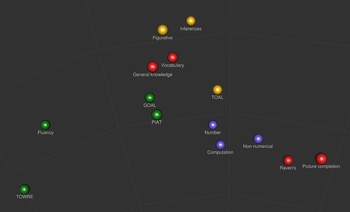
Figure 2. Screenshot of a three-dimensional representation of genetic similarities among the tests that form the latent factors in Figure 1. Each sphere represents a test, and tests are colored by corresponding latent factor from Figure 1: green for reading, blue for mathematics, red for g, and yellow for language. Tests with similar genetic influences are closer together in space.
 You have
Access
- 1
- Cited by
A surprising finding emerging from genetic studies across diverse learning disabilities is that most genetic influences are shared: They are “generalist” rather than “specialist” (Plomin & Kovas Reference Plomin and Kovas2005). We know this because multivariate genetic analysis of twins yields genetic and environmental correlations among traits; high genetic correlations point to a shared genetic etiology and frame a “generalist genes” hypothesis. Although recent advances in molecular genetics, such as genome-wide association, are revealing the genetic variants that are responsible for these common influences (Wellcome Trust Case Control Consortium 2007), we are beginning to realize that the genetic and environmental architecture of psychological traits is far more complex than previously imagined. Just as Cramer et al. highlight the difficulties of psychiatric diagnosis at a phenotypic level, we have argued that, at an etiological level, such common disorders are quantitative traits reflecting multiple underlying dimensions of genetic (and environmental) risk (Plomin et al. Reference Plomin, Haworth and Davis2009). To maximize our chances of identifying particular genetic variants, it is essential that we understand the genetic relationships among these traits by estimating and comparing the genetic correlations derived from genetically sensitive study designs (Plomin et al. Reference Plomin, DeFries, McClearn and McGuffin2008). In common with Cramer et al., we have found that one of the most effective ways to present and reason about such high-dimensional information is through graphical representation (Tufte Reference Tufte2001).
Accurate estimation of multivariate statistics such as genetic and environmental correlations requires large samples. We recently exploited widespread access to inexpensive and fast Internet connections in the United Kingdom to assess over 5,000 pairs of 12-year-old twins from the Twins Early Development Study (TEDS; Oliver & Plomin Reference Oliver and Plomin2007) on four batteries: reading, mathematics, general cognitive ability (g), and, for the first time, language (Haworth et al. Reference Haworth, Harlaar, Kovas, Davis, Oliver, Hayiou-Thomas, Frances, Busfield, McMillan, Dale and Plomin2007). A multivariate structural equation model using latent factors showed that, as expected, genetic correlations among reading, mathematics, and g are high in late childhood and early adolescence (0.75–0.91), with language as highly correlated genetically with g as reading and mathematics (see our Fig. 1 here) (Davis et al. Reference Davis, Haworth and Plomin2009).
Latent factor twin model with genetic correlations highlighted: A, additive genetic effects; C, shared (common) environmental effects; and E, nonshared environmental effects. Squares represent measured traits, and circles represent latent factors. The lower tier of arrows represents factor loadings, and the second tier represents genetic and environmental path coefficients. The curved arrows at the top represent correlations between genetic (solid lines) and environmental (dotted lines) latent factors. Adapted from Davis et al. (Reference Davis, Haworth and Plomin2009).
However, as Cramer et al. demonstrate, there is another level of detail that cannot be investigated through analysis of latent factors. The batteries that index the latent constructs of reading, mathematics, g, and language can be broken down into their constituent tests, our “symptoms,” to better understand the complex relationships among cognitive components that result in high correlations at the level of latent factors. Our own approach to exploring these relationships used multidimensional scaling of genetic correlation matrices to produce interactive graphical representations of the underlying genetic architecture.
As shown in Figure 1, each latent construct was characterised by three or four subscales that assessed different aspects of the trait: 14 tests in total. These measures are described in detail in Davis et al. (Reference Davis, Haworth and Plomin2009). Multidimensional scaling can be used to reduce the high-dimensional relationships among the tests to two or three spatial dimensions.
Classical (metric) multidimensional scaling (Gower Reference Gower1966; Young & Householder Reference Young and Householder1938) requires a matrix representing the pair-wise “distance” between every pair of traits. With a high-performance computing cluster we calculated the pair-wise genetic correlations among all the tests in the battery using maximum-likelihood structural equation model-fitting in Mx (Neale et al. Reference Neale, Boker, Xie and Maes2006) to make a genetic correlation matrix. The genetic correlation matrix represents the genetic similarity among the tests. To represent the genetic dissimilarity, or distance, we subtracted the correlations in the matrix from 1. We performed multidimensional scaling on the resulting matrix using the R function cmdscale (R version 2.10.1; R Development Core Team, 2009) and checked whether three dimensions allowed an adequate representation of the true distance matrix using the criterion suggested by Mardia et al. (Reference Mardia, Kent and Bibby1979) and inspection of a Shepard diagram, which plots the distances obtained from multidimensional scaling against the values in the original distance matrix.
Figure 2 represents the well-fitting three-dimensional solution using the graphics library OpenGL, available in R through the rgl package. The screenshot shows genetically similar traits clustering together and genetically dissimilar traits more distant from one another in space. For a sense of scale, the closest relationship is between two measures of reading comprehension, GOAL and PIAT in the centre of the figure, with a genetic correlation of almost 1; the most distant relationship (a genetic correlation of 0.12) is between TOWRE on the far left, a measure of reading fluency, and Picture Completion on the far right, a measure of nonverbal ability. The image highlights subtle patterns of gene-sharing among the tests. For example, the mathematics tests cluster close together, while the comprehension and fluency components of reading ability are relatively separate in the centre and far left. Likewise, the g battery falls naturally into verbal (near the top) and nonverbal (far right) components. Meanwhile, reading comprehension, the verbal components of g, and language cluster at the top of the figure. Although most correlations are strong, the heterogeneity tells a more nuanced version of the generalist genes story than we saw at the level of latent factors.
Screenshot of a three-dimensional representation of genetic similarities among the tests that form the latent factors in Figure 1. Each sphere represents a test, and tests are colored by corresponding latent factor from Figure 1: green for reading, blue for mathematics, red for g, and yellow for language. Tests with similar genetic influences are closer together in space.
This approach to visualizing the genetic relationship among traits at the symptom level complements Cramer et al.'s network approach to phenotypic comorbidity. When they call for scholars from a wide variety of disciplines to join together to fashion a new approach to psychometrics, they may certainly count geneticists among their allies.
ACKNOWLEDGMENTS
Oliver Davis is supported by a Sir Henry Wellcome Postdoctoral Fellowship from the Wellcome Trust (WT088984). The Twins Early Development Study is supported by the U.K. Medical Research Council (G0500079), the Wellcome Trust (WT084728), and the U.S. National Institute of Child Health and Human Development (HD44454 and HD46167).