

Introduction
The tsetse fly Glossina pallidipes Austin 1903 (Diptera: Glossinidae) is widely but discontinuously spread over much of the eastern half of sub-Saharan Africa (Rogers and Robinson, Reference Rogers, Robinson, Maudlin, Holmes and Miles2004). It is zoophilic over most of its range where it is a potent vector of animal trypanosomiasis that suppresses animal agriculture in much of the area. Fly responses to insecticidally laced traps and targets and other bionomic indices vary geographically (e.g. Langley et al., Reference Langley, Maudlin and Leedham1984; Leak, Reference Leak1998), raising the possibility of distinct biotypes or even a species complex. Such a possibility calls for examination of the breeding structure of G. pallidipes throughout its geographic range.
Ecological research indicated that G. pallidipes is highly vagile so that control methods applied to relatively small areas were likely to fail because of widespread migration (Vale et al., Reference Vale, Hursey, Hargrove, Torr and Allsopp1984; Brightwell et al., Reference Brightwell, Dransfield and Williams1992, Reference Brightwell, Dransfield, Stevenson and Williams1997, Reference Brightwell, Dransfield, Maudlin, Stevenson and Shaw2001; Williams et al., Reference Williams, Dransfield and Brightwell1992). However, recent genetic studies based on allozyme and microsatellite variation have suggested rather lesser rates of gene flow among G. pallidipes populations than may be inferred from the conclusions based on ecological criteria alone (Krafsur et al., Reference Krafsur, Griffiths, Brockhouse and Brady1997; Krafsur and Wohlford, Reference Krafsur and Wohlford1999; Krafsur, Reference Krafsur2002; Ouma et al., Reference Ouma, Marquez and Krafsur2005, Reference Ouma, Marquez and Krafsur2006, Reference Ouma, Beadell, Hyseni, Okedi, Krafsur, Aksoy and Caccone2011).
Dynamic forces of selection, mutation, genetic drift and gene flow shape the genetic structure of a species. Such evolutionary events leave signals in DNA and allele frequency distributions that reflect demographic history (Rogers, Reference Rogers1995; Emerson et al., Reference Emerson, Paradis and Thebaud2001; Knowles, Reference Knowles2004). Glossina pallidipes, in common with some other tsetse fly taxa, experienced severe declines in population densities and geographic distribution concomitant with a rinderpest epizootic caused by a highly infectious and virulent virus, beginning in the late nineteenth century that was estimated to have reduced mammalian host populations by 90% or more in southern Africa (Buxton, Reference Buxton1955; Nash, Reference Nash1969; Ford, Reference Ford1971). Populations of G. pallidipes crashed throughout much of their geographic range; the historical record for this is particularly strong in southern Africa but much less so in East and central Africa and in Ethiopia. In southern Africa, at least there is documented expansion of G. pallidipes from surviving foci over the past 100 generations. It was of interest, therefore, to learn what signals might remain of the earlier contractions and determine the forces that maintain existing distribution patterns.
Our earlier studies on the breeding structure of G. pallidipes utilized single-strand conformational polymorphisms, in which much mitochondrial variation was undetected (Krafsur and Wohlford, Reference Krafsur and Wohlford1999), allozymes, subject to balancing selection (Krafsur et al., Reference Krafsur, Griffiths, Brockhouse and Brady1997; Krafsur, Reference Krafsur2002), and microsatellites (Ouma et al., Reference Ouma, Marquez and Krafsur2005, Reference Ouma, Marquez and Krafsur2006, Reference Ouma, Beadell, Hyseni, Okedi, Krafsur, Aksoy and Caccone2011; Ouma and Krafsur, Reference Ouma and Krafsur2010) that could underestimate genetic differentiation because of homoplasy and high diversities (Reference HedrickHedrick, 2005b ; Jost, Reference Jost2008). Mitochondrial variation, on the other hand, is more sensitive to demographic forces than microsatellite variation because it is single copy and maternally inherited without recombination; it is particularly appropriate for phylogeographic study (Avise, Reference Avise2004; Reference HedrickHedrick, 2005a ). Furthermore, mtDNA demonstrates a clock-like mutation rate that can provide demographical signals over historically short time intervals.
Here we extend our work to examine the genealogical histories of ribosomal (r16S2) and cytochrome oxidase I (COI) mitochondrial genes in diverse populations of G. pallidipes sampled from 23 locations in eastern and southern Africa. Because the mitochondrial genome is inherited matrilineally without recombination, each haplotype can be considered to represent a clonal lineage. Here we examine haplotype and nucleotide diversities, evaluate gene flow among populations, apply tests for selection and demographic stability, and examine the phylogeographic history of G. pallidipes.
Materials and methods
Sampling
Twenty-three collections of G. pallidipes were made throughout much of its geographic range including Ethiopia, Tanzania, Kenya, Zambia and Zimbabwe (Fig. 1). Temporally replicated sampling was carried out in Lambwe and Nguruman, Kenya; Kakumbi, Zambia; and Rekomitjie, Zimbabwe. Samples were obtained from 1994 to 2006, but most were collected from 2001 to 2003. Further details of the sampling locations and methods are provided in Krafsur et al. (Reference Krafsur, Griffiths, Brockhouse and Brady1997) and Ouma et al. (Reference Ouma, Marquez and Krafsur2005). GPS coordinates and sampling dates are available from the authors E.S.K. and J.O.O. on request.
Sampling locations of Glossina pallidipes. Some regions are too close together to show separately.

DNA extraction, amplification and sequencing
Total genomic DNA was extracted by using the DNeasy extraction kit (Qiagen Inc., Valencia, California, USA). From each fly, a fragment of 300 bp of the r16S2 gene and 440 bp of the COI mitochondrial gene were amplified. DNA amplification was carried out in 50 μl polymerase chain reaction (PCR) consisting of 48 μl of the 1.1 × ReddyMix PCR Master Mix (ABGene, New York, USA), 2 μl of DNA extract (c. 80 ng) and 0.5 μm each of oligonucleotide primers: N1-J-12 585 (5′-GGT CCC TTA CGA ATT TGA ATA TAT CCT-3′) and LR-N-12 866 (5′-ACA TGA TCT GAG TTC AAA CCG G-3′) for r16S2; C1-J-1751 (5′-GGA TCA CCT GAT ATA GCA TTC CC-3′) and C1-N-2191 (5′-CCC GGT AAA ATT AAA ATA TAA ACT TC-3′) for COI (Simon et al., Reference Simon, Frati, Beckenbach, Crespi, Liu and Flook1994). Thermocycling was performed in a PTC-100 MJ Research (Woburn, Massachusetts, USA) thermocycler at 30 cycles of 93 °C for 45 s, 52 °C for 1 min, and 72 °C for 1 min. PCR products were resolved in 1.5% (0.5 × TBE) agarose gels to test for contamination and to check the quality and concentration of the target product for further processing.
DNA sequencing was performed at the Iowa State University Nucleic Acid Facility on an ABI Model 3730 automated sequence analyser. BioEdit (Hall, Reference Hall1999) was used for sequence editing. ClustalX (Thompson et al., Reference Thompson, Gibson, Plewniak, Jeanmougin and Higgins1997) was used to align the sequences. Because the mitochondrial genome is inherited as a unit, the aligned r16S2 (249 bp) and COI (421 bp) sequences were concatenated before statistical tests of hypothesis were applied. GenBank accession numbers for COI are KR05987–086134. For r16S2, the accession numbers are KR086135–086166.
Genetic diversities and population differentiation
Haplotype diversity (H S) was estimated according to Nei (Reference Nei1987). Nucleotide diversity πs, the average number of nucleotide differences per site corrected for sampling bias, was estimated by using Nei and Kumar's (Reference Nei and Kumar2000) equation (12.55). ARLEQUIN version 3.11 (Excoffier et al., Reference Excoffier, Laval and Schneider2005) was used to estimate πs. For easier comprehension, we report instead the mean number of pairwise nucleotide differences per sequence, θπ= (670 × πs).
Differentiation among populations was estimated by χ2 tests of homogeneity and Hudson's (Reference Hudson2000) S nn statistic. S nn measures how frequently closely related haplotype sequences are found in the same geographic location. S nn approaches 1/n when the sampled n populations of equal size are not subdivided. S nn approaches unity as sampled populations become increasingly differentiated. Permutation tests were used to estimate the proportion of samples with S nn equal to or greater than the observed values (Hudson, Reference Hudson2000). The phi (Φ) statistic (Excoffier et al., Reference Excoffier, Smouse and Quattro1992), analogous to Wright's F ST, is also based on molecular differences among haplotypes. It was estimated according to the analysis of molecular variance (AMOVA) procedure programmed in ARLEQUIN software (Excoffier et al., Reference Excoffier, Laval and Schneider2005).
Tests of selective neutrality and demographic stability
These tests assume a mutation–drift steady state and the infinite allele model. They are of interest because of the reported earlier and severe demographic disruptions over southern portions of G. pallidipes' range. High frequencies of singular haplotypes (i.e. those haplotypes that appeared only once) can indicate rapidly expanding populations recovering from constriction or other demographic disequilibria. The expected proportion of singletons E in a sample of size n was specified by the application of Ewens' (Reference Ewens1972) sampling formula
 $$\begin{eqnarray} E (1) = [1 + \frac {1}{2} + \frac {1}{3} + \cdots, + 1/( n - 1)]^{ - 1}, \end{eqnarray}$$
assuming the neutral infinite–sites mutation model and selective neutrality (Hartl and Clark, Reference Hartl and Clark2007, p. 181).
The null hypotheses of selective neutrality and constant population size were evaluated by using the F S test (Fu, Reference Fu1997), a logistic transformation of Ewens' sampling formula (Ewens, Reference Ewens1972). The test assumes demographic stability and mutation–drift equilibrium over long intervals of time. Large negative values of F S can indicate departures from selective neutrality and population demographic expansion.
The null hypothesis of constant population size was also evaluated by using the mismatch distribution model of Rogers and Harpending (Reference Rogers and Harpending1992) that predicts a unimodal distribution in a large, unsubdivided population where there is much gene flow. ‘Mismatch’ refers to the numbers of nucleotide differences in pairwise comparisons of haplotypes. The reason for mismatch distribution analysis is that demographic changes leave a signature in the distribution of the number of nucleotide differences among sequences (Slatkin and Hudson, Reference Slatkin and Hudson1991; Rogers and Harpending, Reference Rogers and Harpending1992; Ray et al., Reference Ray, Currat and Excoffier2003; Wegmann et al., Reference Wegmann, Currat and Excoffier2006). Multimodal distributions can be indicative of population contractions and expansions many generations earlier. DnaSP version 5 software (Librado and Rozas, Reference Librado and Rozas2009) was used to generate the observed and expected values for graphical display.
Tajima's test of selective neutrality is based on the infinite–sites mutation model. The test statistic D compares estimators of θ ( = 2N eμ, where N e is the effective population number, defined later, and μ is the mean mutation rate per generation) based on the number of polymorphic nucleotide sites S and θπ is based on the mean number of pairwise nucleotide differences (Tajima, Reference Tajima1996). The difference between the two estimates of θ is zero under the infinite–sites model. Chakraborty's (Reference Chakraborty1990) test for population amalgamation and selective neutrality was used to compare the number of mitochondrial haplotypes in samples with the numbers expected in demographically stationary populations at the mutation–drift equilibrium. It assumes the infinite–sites model and Ewens' sampling theory, and estimates the probability of obtaining a selectively neutral sample of haplotypes similar to or larger than observed. DnaSP and ARLEQUIN were used to make the calculations.
Population structure and isolation by distance
Population structure and patterns of gene flow were inferred by using correspondence analysis (Greenacre, Reference Greenacre2007), which estimated the canonical correlation of haplotypes classified by sample and region and clustered them according to their genetic similarities. SAS was used to perform the foregoing analyses (SAS, 2003).
The population model of isolation by distance (IBD) (Wright, Reference Wright1943) leads to the expectation that genetic differentiation will increase linearly with geographic distance. Thus, the IBD model of population structure can be tested by regressing genetic differentiation F ST/(1 − F ST) or F ST on geographic distance (km), as proposed by Smouse et al. (Reference Smouse, Long and Sokal1986). According to the island model, the theoretical relationship between F ST and gene flow in terms of the effective number of reproducing female migrants can be represented as
 $$\begin{eqnarray} N _{e}m = (1 - F _{ST})/2 F _{ST}. \end{eqnarray}$$
The chief assumptions include negligible mutation rates (μ≪N em) and equal rates of gene flow among populations of equal size.
Estimation of mutation rates and effective population sizes
Mutation rates μ were estimated to a first approximation after Fu (Reference Fu2001) by taking the average per–site number of nucleotide differences among haplotypes from temporally replicated samples (Δπ) and dividing by the estimated number of generations spanned between the replicates: μ ≈ Δπ/T, where generation time T was taken to be 50 days (Hargrove, Reference Hargrove2003). The principal assumptions include a Poisson distribution of mutations, negligible gene flow from neighbouring populations, selective neutrality and constant effective population sizes.
The effective size of a population (N e) is the number of reproducing female flies in an ideal population, i.e. one of constant size, discrete generations, negligible selection and gene flow, that exhibits the same rate of random genetic change as the sample under study. Generally, it is much less than the census population size. Estimates of N e and their confidence intervals were obtained by using two methods: (1) temporally, variance effective size, the changes in haplotype frequencies between t generations F K (Pollak, Reference Pollak1983; Luikart et al., Reference Luikart, Allendorf, Cornuet and Sherwin1998) and (2) the relation N e= θπ/670/2μ, where the parameters θπ (mean number of nucleotide differences per sequence, divided by 670 to give differences per nucleotide) and mutation rate μ were estimated from independent samples. The temporal method produces estimates of short–term N e that become less biased by overlapping generations with a greater number of generations and very low rates of gene flow (Waples and Yokota, Reference Waples and Yokota2007), and become more accurate because the drift–migration disequilibrium is minimized (Wang and Whitlock, Reference Wang and Whitlock2003). Low rates ( ≤ 2) of gene flow seem to be characteristic of most tsetse fly populations investigated to date (Gooding and Krafsur, Reference Gooding and Krafsur2005; Krafsur, Reference Krafsur2009). The second method provides a long–term estimate of N e that depends on the mutation rate, which varies over a much longer time scale. Long–term estimates may approach N e of the species (Wang, Reference Wang2005).
Results
Haplotype and nucleotide diversities by population
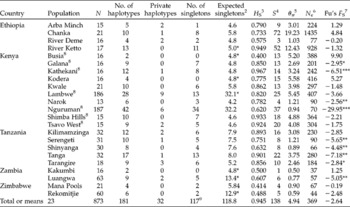
Table 1 presents the diversities in 23 populations of G. pallidipes. Of the 670 bp in the concatenated nucleotide sequence of G. pallidipes, 138 sites (138/670 = 21%) were variable, of which 35 (25%) were singleton variable and 103 (75%) were parsimony informative. The mean number of polymorphic sites per sequence S varied from only one in Kakumbi to 72 in Chanka. Particularly notable was the extraordinary number of variable sites in four Chanka and River Ketto flies.
Haplotype and nucleotide diversities in Glossina pallidipes by sampling location1

1 Each mitochondrial sequence was 670 bp with no alignment gaps. Singletons are haplotypes that appear only once.
2 Expected on the hypothesis of the neutral infinite-sites model (Hartl and Clark, Reference Hartl and Clark2007); * P< 0.05.
3 Haplotype diversity (Nei, Reference Nei1987, equation (8.4)).
4 No. of polymorphic sites.
5 Average number of nucleotide differences per sequence (i.e. mismatch; Tajima, Reference Tajima1983).
6 Long-term estimates: N e= θπ/670/μ, where μ = 1 × 10− 5.
7 Significance by permutation tests: * P< 0.05, ** P< 0.01, *** P< 0.001.
8 Locations at which tsetse fly control methods are known to have been applied.
9 Singletons unshared over 23 populations.
Among 873 G. pallidipes, 181 mitochondrial haplotypes were detected. No haplotype was ubiquitous among the 23 samples. The most common haplotype was carried by 13.5% of the pooled samples. Different haplotypes, equivalent to maternal lineages, varied from two in Busia to 42 in Nguruman.
Of the 181 haplotypes, 117 were singletons (haplotypes appearing only once), 117/181 = 64.6% of the total. The observed number of singletons was very close to theoretical expectations of 119. Only 32 haplotypes (50%, exclusive of singletons) were shared between two or more sampled populations and 32 (50%, exclusive of singletons) were private. Such a large proportion of private haplotypes is strongly indicative of low rates of gene flow. Of the 32 private lineages, 18 (56%) were detected in Lambwe and Nguruman where sample sizes were large. No private haplotypes were detected in 11 (48%) of the 23 sampled populations. The distribution of haplotypes among the sampled populations, less than the 117 singletons, is provided in the supplementary data (Table S1, available online). Singleton frequencies varied significantly among the populations (
 $$\chi _{(22)}^{2} = 77 $$
, P≈ 0). In Ethiopia, only Arba Minch shared haplotypes, two in number, with populations in Kenya and Tanzania. Sampling in Kenya was most intensive in Lambwe and Nguruman. Six of 15 Lambwe haplotypes were shared with other populations, two with Tanzanian populations. Nguruman possessed three shared and six private haplotypes, exclusive of singletons. Its predominant haplotype occurred singly in only three other populations. Twenty lineages were observed in Tanzania, none of which was detected in southern Africa. Seven lineages were observed in southern Africa, only one of which was shared with Kathekani in Kenya.
Haplotype diversities (the probability that two randomly chosen flies have different haplotypes) varied from 0.4 in Busia to 0.967 in Kathekani, and the overall mean H
S= 0.945 ± 0.0035 SD (Table 1). The average number of pairwise nucleotide differences between sequences θπ= 4.94 ± 6.3 SD varied within samples from 0.50 in Kakumbi to 19.23 in Chanka. The average number of nucleotide differences per site πS varied from 0.0002 in Luangwa to 0.025 in Chanka and a mean 0.0045 over all samples. Hypotheses of independence were rejected for the number of haplotypes (
 $$\chi _{(22)}^{2} = 64 $$
, P≈ 0) and number of polymorphic sites (S) per population (
 $$\chi _{(22)}^{2} = 299 $$
, P≈ 0).
Neutrality tests and tests of demographic stability
High frequencies of singular haplotypes (i.e. rare mutations) can be indicative of demographically young, rapidly expanding populations (Slatkin and Hudson, Reference Slatkin and Hudson1991; Rogers and Harpending, Reference Rogers and Harpending1992) as in populations recovering from a constrictive force; however, there can be more complex demographic explanations (e.g. Wegmann et al., Reference Wegmann, Currat and Excoffier2006). The frequencies of singletons as proportions of total haplotype numbers varied greatly among samples from zero in Busia, Kakumbi and Kodera to 85% in River Ketto (Table 1). The observed numbers of singletons were significantly less than expected in six of the 23 populations and only one, River Ketto, showed a significant excess of singletons. Therefore, the distributions of singular haplotypes do not indicate the patterns of rapid population expansion, but seven populations showed presumptive evidence of departures from the mutation–drift equilibrium.
The parameter F S tests the observed number of haplotypes against the number expected under the infinite-sites model and selective neutrality (Table 1). Simulations show that the index is sensitive to demographic and range expansions where it takes negative values (Fu, Reference Fu1997). Significant negative F S values can indicate an excess of singular haplotypes and were recorded in four of 10 Kenyan populations, in four of five Tanzanian populations, and in one of four southern African populations. No significant F S value was recorded in Ethiopia. The mean number of haplotypes over all samples was 10.5 ± 8.6 compared with an expected value of 6.8 ± 3.9.The overall mean test statistic F S= − 2.64 ± 6.9 (P≈ 0.28). Thus, there is statistical support for the notion of population expansion or selection in nine of the 23 sampled populations. This is a conservative result however because, according to simulations, the chances of accepting a false null hypothesis when using Fu's test are greatly increased in populations with low rates of immigration (Ray et al., Reference Ray, Currat and Excoffier2003; Excoffier, Reference Excoffier2004) and the effect is greater in heterogeneous environments (Wegmann et al., Reference Wegmann, Currat and Excoffier2006). Tajima's test of selective neutrality for Nguruman was D= − 2.48 (P≈ 0) and that for Shinyanga, it was D= − 1.7 (P≈ 0.027). The mean D over the 23 samples was − 0.48 ± 0.97 (P≈ 0.38). A ‘significant’ result can be expected in at least one of the 23 samples. With the exception of Nguruman, these data are consistent with the hypotheses of selective neutrality and demographic stability, but, again, caution is necessary in accepting such results. The foregoing simulations showed that Fu's and Tajima's tests lack power in demes, in which there is only modest gene flow (e.g. c. < 20 reproductives per generation).
Some samples afforded very high diversities, raising the possibility of population amalgamation. The number of haplotypes in a heterogeneous population may be greater than that expected in a homogeneous population at mutation–migration equilibrium. The application of Chakraborty's (Reference Chakraborty1990) test for population amalgamation indicated instead a deficiency of haplotypes in Chanka (expected 14.5, observed 10, P≈ 0.02) and insignificant excess in River Ketto (expected 11, observed 13, P≈ 0.4). The same test indicated more haplotypes than expected in Lambwe (observed 28, expected 19.9, P= 0.002) and in Nguruman (observed 42, expected 5.5, P≈ 0). Quasi-significant departures from expectations were observed in Shinyanga and Luangwa (P≈ 0.05). Tsetse flies in both Lambwe and Nguruman have been subjected to several seemingly effective population suppression measures and have since rebounded in density. Earlier studies using allozymes and microsatellites demonstrated random mating within the foregoing populations (Krafsur et al., Reference Krafsur, Griffiths, Brockhouse and Brady1997; Ouma et al., Reference Ouma, Marquez and Krafsur2005, Reference Ouma, Marquez and Krafsur2006), thereby falsifying the hypotheses of amalgamation.
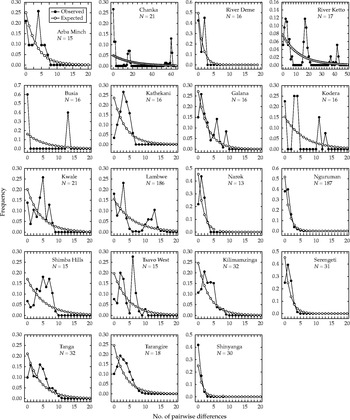
Mismatch distributions (Fig. 2) showed pronounced departures from theoretical expectations based on demographic steady states, which include constant population sizes. Unimodal distributions were 11 in number. Those in Kenya included Kathekani, Narok and Nguruman. Serengeti and Tarangire in Tanzania also presented unimodal mismatch distributions. A unimodal distribution was obtained in each of the southern African populations, pooled for graphing because their haplotype frequencies were homogeneous. The mode of the Nguruman distribution was only 1 bp difference, and the modes in Shinyanga and southern Africa were zero, indicative of a recent genetic coalescence. Simulations suggested that unimodal distributions in subdivided populations can be indicative of recent expansions of population or range (Wegmann et al., Reference Wegmann, Currat and Excoffier2006), and this is consistent with significant F S statistics. Where there is little gene flow among subdivided populations, the expected mismatch distribution is bimodal according to the simulations by Ray et al. (Reference Ray, Currat and Excoffier2003) and Wegmann et al. (Reference Wegmann, Currat and Excoffier2006). Busia showed modes of 0 and 13. Multimodal pairwise nucleotide differences were recorded in each of the Ethiopian samples, in seven of 10 Kenyan populations and in two of five Tanzanian populations. Of particular interest are the multimodal distributions in Chanka, with modes of 0, 16 and 60 bp differences and River Ketto that showed modes at 2, 17 and 43 bp. These large mismatch differences, albeit among relatively few flies, indicate the presence of ancient lineages and temporally successive demographic events.
Mismatch distributions by population. Open circles show expected frequencies on the hypothesis of demographic equilibrium.

Diversities by region
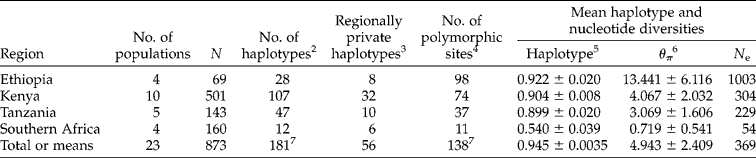
The various diversity indices varied greatly among the sampled populations, but are the differences regional? Diversity and related indices are summarized regionally for convenience because geographical distances among the sampling locations were less within countries than between them (Table 2). Most haplotypes (71%), excluding singletons, were regionally confined. The relative proportions of private haplotypes (haplotypes found in only one population sample and not in others) varied from 86% in southern Africa to 50% in Tanzania, but were homogeneous (
 $$\chi _{(3)}^{2} = 1.1 $$
= 1.1, P≈ 0.78).
Mitochondrial diversities in Glossina pallidipes by region1

1 Private haplotypes are regionally unique.
2
 $$\chi _{3}^{2} $$
= 26.7, P≈ 0.
3
 $$\chi _{3}^{2} $$
= 1.1, P≈ 0.78, exclusive of singletons.
4
 $$\chi _{3}^{2} $$
= 193, P≈ 0.
5
 $$\chi _{4}^{2} $$
= 10.6, P≈ 0.03 tested by Kruskal–Wallis ANOVA.
6
 $$\chi _{4}^{2} $$
= 12.01, P≈ 0.02 tested by Kruskal–Wallis ANOVA.
7 Includes singletons. There were 79 haplotypes excluding singletons.
Other mitochondrial haplotype and nucleotide diversities in the populations of G. pallidipes varied significantly among regions, confirmed by contingency chi-square and Kruskal–Wallis ANOVA. Most mitochondrial diversity was found in Ethiopia and least in southern Africa. Population haplotype frequencies differed significantly within regions with the exception of southern Africa. Mean numbers of nucleotide differences (θπ) were particularly great in Ethiopia (13.44) and very low in southern Africa (0.72). Similarly, the number of polymorphic sites (S) was 137 in Ethiopia but only 11 in southern Africa. On a regional basis, only one haplotype was shared among three regions and 11 haplotypes were shared between two regions. Most (10) shared haplotypes were between Kenya and Tanzania. Southern Africa shared only one of its 12 haplotypes and Ethiopia shared only two of its 28 haplotypes.
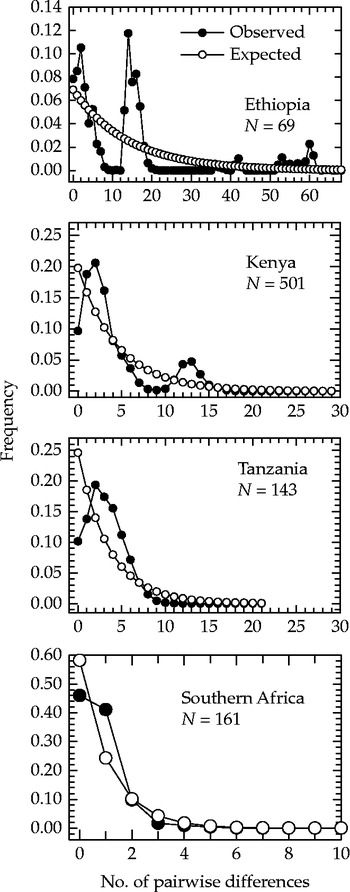
Pooling mismatch distributions by country revealed regional patterns (Fig. 3) in earlier demographic events. Five major modes were observed in Ethiopia, three of which were not recorded elsewhere. Two major modes were observed in Kenya and only one broad mode was observed in Tanzania. Southern Africa was unimodal at zero mismatches, confirming a trend from north to south of increasingly younger lineages.
Regional mismatch distributions. Open circles show expected frequencies on the hypothesis of demographic equilibrium.

Population structure and isolation by distance
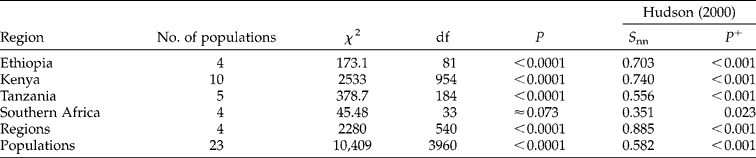
Tests of genetic differentiation among the populations of G. pallidipes grouped by country and region are summarized (Table 3). Chi-square tests of homogeneity in haplotype frequencies indicated highly significant differences within all countries except the four southern African samples. However, Hudson's S nn statistic suggested marginally significant differences even in southern Africa.
Tests of genetic differentiation in Glossina pallidipes populations within and among regions

+ Probability levels estimated by permutation tests.
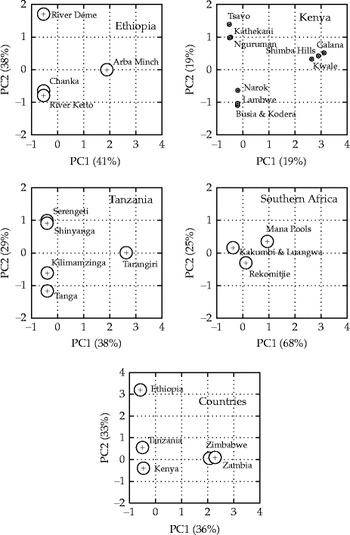
Correspondence analysis showed strong geographic associations of haplotypes (Fig. 4). Three clusters were identified with significant differences in haplotype frequencies in Ethiopia (
 $$\chi _{(81)}^{2} = 163.4 $$
, P< 0.001), three in Kenya (
 $$\chi _{(954)}^{2} = 1255 $$
, P< 0.001), three in Tanzania (
 $$\chi _{(184)}^{2} = 312.8 $$
, P< 0.001) and three in southern Africa (
 $$\chi _{(33)}^{2} = 45 $$
, P~0.052). The 181 haplotypes were strongly associated with three clusters: Ethiopia (north), Kenya and Tanzania (east), and Zambia and Zimbabwe (southern Africa), with significant differences in haplotype frequency profiles among these regions (
 $$\chi _{(360)}^{2} = 1227 $$
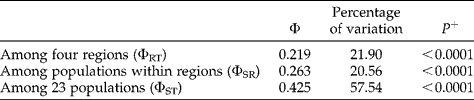
, P≈ 0). AMOVA (Table 4) indicated that 21.9% of genetic variance was attributed to the four regional groups, equivalent to F
GT. The same analysis indicated that 20.6% of the variance among populations laid within the regional groups (F
SG= 0.21) equivalent to the correlation of haplotypes within the grouped populations. Permutation tests indicated that the within- and between-country F statistics all differed from zero (P< 0.0001) and were minimum estimates because the high frequencies of singletons tended to minimize differentiation. Also by AMOVA, ΦST= 0.42, the probability that two randomly chosen flies within a sampled population have the same haplotype relative to that in the gene pool as a whole.
χ2 maps generated from the correspondence analysis of Glossina pallidipes samples showing geographic associations of haplotypes by sampling locations in and among the countries. The first two principal components (PC) display the row and column associations in terms of explained variance.

Φ statistics by analysis of molecular variance (Excoffier et al., Reference Excoffier, Smouse and Quattro1992) over 23 populations of Glossina pallidipes. Permutation tests estimated P

+ Probability levels estimated by permutation tests.
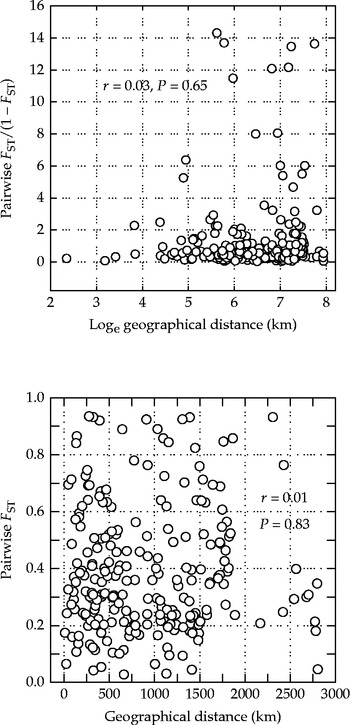
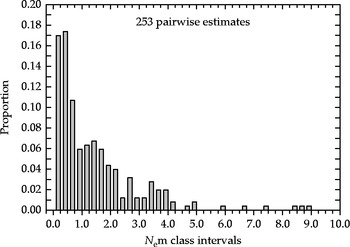
Figure 5 shows the relationships between the pairwise indices of genetic differentiation and the corresponding geographical distances. Inspection of F ST/(1 − F ST) vis-à-vis loge geographic distance (Smouse et al., Reference Smouse, Long and Sokal1986) might suggest a weak relationship, but Pearson's product-moment correlation indicated none (r= 0.03, P= 0.65). The scatter plot of pairwise F ST on geographical distances showed no relationship (r= 0.05, P= 0.83). The frequency distribution of 253 population pairwise estimates of the effective migration rate N em showed that 51% were less than one reproducing female per generation and 75% were less than two (Fig. 6). Only 8% of the pairwise estimates of gene flow were greater than five. Strong and weak degrees of differentiation may be found between the populations separated over all distances from c. 50 to 3000 km, indicating that drift is a much stronger force than migration among the sampled populations.
Pairwise indices of genetic differentiation plotted on corresponding geographical distances between them.

Estimates of the effective number of migrants (N em) exchanged between all the possible pairs of populations. The abscissa is scaled in units of 0.25 (one reproductive every four generations). 51% of the pairwise estimates were less than one reproductive per generation.

Mutation rate and effective population sizes
The average mutation rate was approximately 1 × 10− 5± 2 × 10− 6 per site per generation, and varied about 100-fold among estimates (Table 5). A more direct estimate of mtDNA in Drosophila melanogaster was 6.2 × 10− 8 (Haag-Liautard et al., Reference Haag-Liautard, Coffey, Houle, Lynch, Charlesworth and Keightley2008), one-sixteenth of our indirect estimate for G. pallidipes. Taking the mutation rate as 1 × 10− 5 and π = θπ/670 from Table 1, estimates of the long-term female effective population number N ef ranged from 37 in Kakumbi to 1435 in Chanka and a weighted arithmetic mean over all samples was 369 (Table 1). This estimate, however, can be improved by a regional examination (Table 2). The historical record shows a massive die-off of mammalian hosts, particularly in southern Africa, from the rinderpest epizootic and the concomitant disappearance of G. pallidipes for many years. The regional N ef estimate for southern Africa is 54 and that for Ethiopia is 1003, a value distorted by a relatively small number of flies with relatively diverse mitochondria in Chanka and River Ketto. Eliminating the two Ethiopian and the four southern African samples yields a weighted overall mean N ef of 230 ± 122 SD, providing a long-term mean for populations in southern Ethiopia, Kenya and Tanzania. The foregoing estimates would be an order of magnitude greater if the mutation rate were 1 × 10− 6.
Mutation rate (μ) in Glossina pallidipes populations estimated from temporal samples by using Fu's (Reference Fu2001) method+

+ Generation time was 50 days. Long-term estimates of N e= θπ /670/2μ, where μ is the mutation rate. Short-term estimates of N e were estimated by using Pollak's (Reference Pollak1983) method, as modified by Luikart et al. (Reference Luikart, Allendorf, Cornuet and Sherwin1998).
The method of temporal changes in haplotype frequencies afforded estimates of N ef that ranged from 178 to 4381 and are contrasted with the corresponding long-term estimates from the same samples (Table 5). The short-term estimates depend on haplotype frequencies that vary with recent evolutionary and demographic processes. They are said to be the more accurate assessment of current effective population sizes (Wang, Reference Wang2005). Nevertheless, they are biased by continuously overlapping generations. Assuming a daily mortality rate of 0.025 among females (Rogers et al., Reference Rogers, Randolph and Kuzoe1984), some 47% of a stationary population will be at least 50 days old. With the exception of Nguruman, short-term estimates from Kenya were less than the long-term estimates. The Kenyan populations had experienced steep diminutions in density within 10 years of our genetic sampling, and the southern African populations experienced such a severe, long-term restriction beginning in 1896 that they were not recorded until 1942 (Lovemore, Reference Lovemore1958), even though entomologists and animal health officers had been sampling throughout the region since 1930.
Discussion
Haplotype and nucleotide diversities
Diversity indices varied significantly among the sampled G. pallidipes populations. The most diversities were recorded in River Ketto and Kathekani. The fewest diversities were recorded in Busia, Kakumbi, Mana Pools and Rekomitjie. Clearly, the 23 populations experienced different demographic histories. Hypothetically, variations in diversity could be a consequence of among-population differences in effective population numbers (i.e. genetic drift), variation in mutation rates and natural selection. The chief effectors of tsetse fly population densities in the past 125 years include weather patterns (Rogers and Robinson, Reference Rogers, Robinson, Maudlin, Holmes and Miles2004), the rinderpest epizootic, wildlife management, the loss of habitat through human population growth and, locally, insect population management schemes (Buxton, Reference Buxton1955; Nash, Reference Nash1969; Ford, Reference Ford1971; Hargrove, Reference Hargrove, Maudlin, Holmes and Miles2004).
Empirical data for more than 1600 animal species (Bazin et al., Reference Bazin, Glémin and Galtier2006) suggested that mitochondrial diversities (but not allozyme or microsatellite variation) are unrelated to population sizes because there was no correlation between mtDNA polymorphism and species abundance. Recurrent adaptive evolution as selective sweeps was consistent with their empirical data. It is difficult to accept a hypothesis of selection operating on G. pallidipes mitochondrial haplotypes over its geographic range because the observed frequency of singletons (117) was essentially that expected (119), consistent with the neutral infinite-sites model. At the population level, however, one-third of the samples provided presumptive evidence, via the F S statistic, of responses to selective forces.
Results of demographic stability tests initially seem to be confusing. The F S test indicated that nine of the 23 populations showed significant departures from expectations based on demographic equilibrium. Significant Tajima's D tests were recorded in only two of the populations, Nguruman and Shinyanga. (One may be expected by chance alone.) The departures were negative in sign, consistent with selection or population growth. Chakraborty's test indicated a significant excess of haplotypes in five populations, including Nguruman and Shinyanga. The excesses could, in principle, reflect heterogeneous populations. Our earlier research based on microsatellite loci indicated that each of these populations was randomly mating, i.e. F IS≈ 0 (Ouma et al., Reference Ouma, Marquez and Krafsur2006), thereby falsifying the hypotheses of amalgamation. Population expansion is a more likely explanation because Nguruman was the site of intensive suppression trials in 1983–1995 (Brightwell et al., Reference Brightwell, Dransfield, Stevenson and Williams1997) from which G. pallidipes had recovered by the time of sampling. Tsetse flies in Shinyanga were probably recovering from earlier, recurrent rinderpest epizootics as, indeed, were the southern African populations.
The biological validity of the foregoing F S and D tests is tenuous because it is hard to make reliable estimates of θ ( = 2N eμ) in natural populations. Sampling vagaries, overlapping generations and short-term demographic dynamics confound indirect estimates of N e and the mutation rate. Simulations have shown that F S can fail to show departures from demographic equilibrium where N em < 20 (Ray et al., Reference Ray, Currat and Excoffier2003; Wegmann et al., Reference Wegmann, Currat and Excoffier2006). Our estimates of gene flow were an order of magnitude less than 20. F S is also sensitive to the interval between the initiation of population growth and sampling. Also, temporal heterogeneity in population sizes adversely affects tests for demographic stability (Wegmann et al., Reference Wegmann, Currat and Excoffier2006). Supporting information is required before a hypothesis based on contrasting estimates of θ is accepted or rejected.
Mismatch distributions can illustrate strong signals of earlier demographic events such as selective sweeps and population restrictions. High frequencies of 0 and 1 bp mismatches were recorded in 12 tsetse populations, indicative of comparatively recent expansions. Much older demographic events could be inferred in the Ethiopian populations, in seven Kenyan populations and in three Tanzanian populations.
The historical record indicates the disappearance of G. pallidipes and G. morsitans in southern Africa, beginning in the last decade of the nineteenth century followed by very slow expansions in range from a few refugia (Ford, Reference Ford1971). However, the mismatch distributions often provided a different scenario from that afforded by F S. They showed multimodal distributions in northern and some East African populations and unimodal distributions in the Tanzanian and southern African populations but also in Kathekani, Narok and Nguruman, the sites of tsetse suppression trials. Populations in Busia, Kodera, Galana and Tsavo West were multimodal and were also subject to suppression attempts.
Sample sizes were disproportionately greater in Lambwe and Nguruman, Kenya, because they were of greater interest as locations of longstanding investigation of G. pallidipes ecology and of population suppression programmes (Brightwell et al., Reference Brightwell, Dransfield, Stevenson and Williams1997; reviews in Brightwell et al., Reference Brightwell, Dransfield, Maudlin, Stevenson and Shaw2001; Ouma et al., Reference Ouma, Marquez and Krafsur2006; Krafsur, Reference Krafsur2009). Populations in those locations were suppressed below levels of detection; subsequent resurgences by 1998 in Nguruman and Lambwe were initially attributed to immigration, though a later comprehensive review admitted the likelihood of continuous presence (Brightwell et al., Reference Brightwell, Dransfield, Maudlin, Stevenson and Shaw2001). Our earlier genetic work, based on microsatellite diversities, had falsified conclusions of immigration (Ouma et al., Reference Ouma, Marquez and Krafsur2006), but now strongly supported by the current mitochondrial data that indicate that the predominant lineages are largely unshared with the other sampled populations.
Regionally pooled mitochondrial diversities in G. pallidipes were substantial and geographically heterogeneous, as reflected by the skewed distribution of haplotype frequency and high proportions of private haplotypes (28%) and singletons (65%). Under the neutral infinite-sites model, singletons can be considered to be recent mutants, indicative of expanding populations (Tajima, Reference Tajima1989; Fu, Reference Fu1997). Summed over populations, however, the observed number of singletons (117) was approximately equal to the expected one (119).
Gene flow
The pronounced genetic differentiation within and among countries is consistent with the physical and ecological fragmentation of the populations. Chi-square tests of homogeneity were falsified and Hudson's F ST was substantial within Ethiopia, Kenya and Tanzania, but not in the southern African countries. Indeed, only 17 of the 253 pairwise F ST estimates were ≤ 0.10. Given the assumptions of Wright's island model, the mean over all samples by using Hudson's formulation was F ST= 0.47 ± 0.07. Fifty-one percent of the pairwise estimates of gene flow were less than one per generation (equivalent to F ST≥ 0.33), and the high proportions of private haplotypes strongly indicates the demographic independence of most populations. The relative strength of genetic drift vis-à-vis gene flow may have been enhanced by habitat fragmentation caused by growth in human populations and concomitant economic development. Such is the case among Glossina palpalis s.l. populations in West Africa (Bouyer et al., Reference Bouyer, Ravel, Dujardin, de Meeüs, Vial, Thévenon, Guerrini, Sidibé and Solano2007; De Meeûs et al., Reference De Meeûs, Ravel, Rayaisse, Kaba, Courtin, Bouyer, Dayo, Camara and Solano2014). Demonstrable climatological and meteorological correlations, however, seem to explain much of the current distribution of G. pallidipes (Rogers and Robinson, Reference Rogers, Robinson, Maudlin, Holmes and Miles2004).
Geographic distribution of diversity
Mitochondrial diversities were much greater in Ethiopian and east African populations than in the southern African (Zambia and Zimbabwe) populations, which are consistent with studies based on microsatellite loci (Krafsur, Reference Krafsur2002; Ouma et al., Reference Ouma, Marquez and Krafsur2005). Together, they indicate larger effective population sizes in northern than in southern populations, which can be attributed to the recorded effects of the rinderpest epizootic of the late nineteenth century (reviews in Buxton, Reference Buxton1955; Ford, Reference Ford1971). Tsetse flies are exclusively haematophagous; therefore, morsitans group populations are adversely affected by reductions in mammalian host densities. The effects of the rinderpest in East Africa and Ethiopia do not seem to have been so thoroughly documented in the available published literature, but based on genetic evidence, it seems that tsetse populations in those regions were not as seriously affected as in southern Africa.
Three regional genetic groups were disclosed by correspondence analysis, in which Ethiopian tsetse fly populations appeared genetically the most distinct from the others. With the exception of Zambia and Zimbabwe, little diversity was shared among the populations in the countries as indicated by the few shared haplotypes and F ST. The Zimbabwean and probably the southern Zambian populations expanded from the same small refugium and became detectable in 1942. The discontinuous distribution of G. pallidipes throughout its geographic range has been attributed principally to temperature and rainfall patterns (Robinson et al., Reference Robinson, Rogers and Williams1997a , Reference Robinson, Rogers and Williams b ; Rogers and Robinson, Reference Rogers, Robinson, Maudlin, Holmes and Miles2004). The physical geography of Central and East Africa, much of which is dissected by the Rift Valley and its various branches, also contributes to isolation.
Mutation rate and effective population numbers
The long-term estimates of N ef in G. pallidipes varied greatly from sample to sample, but there was a strong trend of decreasing numbers from north to south. Most of the sample estimates seemed small even when recent population histories and tsetse reproductive biology are considered. If we may assume that the mutation rate of 1 × 10− 5 per site per generation is accurate (as noted earlier, the corresponding estimate for Drosophila was 6.2 × 10− 8, lower by two orders of magnitude), each estimate of N ef is a harmonic mean for the species over its geographic range (Wang, Reference Wang2005). The mean over the 23 samples was about 3.7 × 10² and over 17 samples was about 1.2 × 10² when the most northern and southern samples are disregarded. The foregoing estimates of long-term N ef can be compared with an estimate for Glossina fuscipes fuscipes in Uganda of about 1.5 × 10² (calculated from data in Echodu et al., Reference Echodu, Beadell, Okedi, Hyseni, Aksoy and Caccone2011) and that for the highly prolific African mosquitoes Anopheles gambiae of about 4 × 10⁵ (Lehmann et al., Reference Lehmann, Hawley, Grebert and Collins1998) and that for Anopheles funestus of about 1 × 10³ (Michel et al., Reference Michel, Grushko, Guelbeogo, Sagnon, Costantini and Besansky2006). The N ef+m estimate for African D. melanogaster was 1.15 × 10⁶ (Charlesworth, Reference Charlesworth2009). The mean long-term estimate of about 2.3 × 10² for G. pallidipes in the central part of its range may seem rather low from a biological point of view but its discontinuous distribution and its low, slow reproduction rate ensure small population densities when compared with Anopheles mosquitoes and Drosophila. Moreover, the estimated harmonic mean is heavily weighted by the severe population losses that began with the rinderpest epizootic some 730 generations before sampling. The effect of the epizootic was severe in the 1920s, suggesting a prolonged period of restriction (Buxton, Reference Buxton1955; Lovemore, Reference Lovemore1958; Ford, Reference Ford1971).
The short-term estimates of N ef were greater than the corresponding long-term estimates, varying from 178 in Nguruman, Kenya, to 1460 in Lambwe, Kenya, and 1842 in Rekomitjie, Zimbabwe. Earlier short-term estimates (of N ef+m), based on the analysis of microsatellite diversities, varied between 333 and 1026 in Nguruman and from 202 to 502 in Lambwe (Ouma et al., Reference Ouma, Marquez and Krafsur2006); those estimates are inflated by about 1.5 × because most tsetse females become inseminated only once (Balloux and Lehmann, Reference Balloux and Lehmann2003). The short-term estimates are further biased because tsetse populations overlap continuously and are uncorrected for sampling (Waples, Reference Waples2002). At the time of sampling, population densities were substantial, but earlier had dropped beneath sampling thresholds because of tsetse population management trials at Lambwe and Nguruman (Ouma et al., Reference Ouma, Marquez and Krafsur2006, Krafsur, Reference Krafsur2009). As already noted, tsetse flies were reduced below detection thresholds in Zimbabwe for many years.
Conclusion
Analysis of mitochondrial nucleotide sequences of G. pallidipes has allowed us to resolve in finer detail than heretofore the population structure of the most important vector insect. Moreover, we have gained new insights into population histories and degrees of isolation. For example, it was shown earlier that the ecologically well-studied populations in Lambwe and Nguruman, Kenya, shared little microsatellite variation with other populations, thereby calling into question inferences of widespread immigration after control measures were applied (Brightwell et al., Reference Brightwell, Dransfield, Stevenson and Williams1997). Inferences about gene flow, based on admittedly unrealistic simplifying assumptions (Jost, Reference Jost2008), seem to falsify earlier claims of immigration that led to conclusions that any measures except very short-term control procedures were destined always to fail. Nevertheless, the genetic data strongly support the notion that isolation and genetic drift are strong, gene flow is correspondingly weak, and well-designed and executed control programmes may, after all, prove to be highly effective against tsetse populations such as those sampled.
Supplementary material
To view supplementary material for this article, please visit http://dx.doi.org/10.1017/S1742758415000223.
Acknowledgements
The authors thank Nigel Griffiths, Imna Malele, Steve Mihok, Alan Robinson, John Terblanche, Stephen Torr and Glyn Vale for providing much sampling. Jane Rutto kindly prepared the map of the sampling sites. This research was supported by USPHS grants AI-40048 and AI-52456.