Introduction
The existence of bistratified (BS) ganglion cells in vertebrate retina has long been recognized, beginning with the pioneering work of Cajal (Reference Cajal1893). More recently, BS ganglion cells were found in Golgi preparations of rabbit retina (Famiglietti & Siegfried, Reference Famiglietti and Siegfried1979). It was proposed that type 1 bistratified (BS1) ganglion cells correspond to ON-OFF directionally selective (DS) ganglion cells in rabbit retina (Famiglietti, Reference Famiglietti1981a, Reference Famiglietti1983b), well characterized in physiological studies (Barlow et al., Reference Barlow, Hill and Levick1964; Oyster, Reference Oyster1968; Ariel & Daw, Reference Ariel and Daw1982), a correspondence confirmed by a combination of extracellular recording and intracellular staining (Amthor et al., Reference Amthor, Oyster and Takahashi1984).
When first observed in Golgi’s laboratory (Tartuferi, Reference Tartuferi1887), the stratification of Golgi-impregnated ganglion cell dendrites in the inner plexiform layer (IPL), in particular the co-stratification and contact of dendrites belonging to neighboring ganglion cells of the same type, was marshaled as evidence in support of the eventually discredited “reticular” theory of neural organization, promoted by Golgi against the cellular theory, effectively championed by Cajal. Subsequent students of primate retina in particular doubted the functional importance of dendritic stratification of ganglion cells in the IPL, observing that individual examples of a “single type,” such as the “midget” ganglion cell, branch at different levels of the IPL (Polyak, Reference Polyak1941), and believing that synaptic connectivity rather than cell shape was a better guide to function (Boycott & Dowling, Reference Boycott and Dowling1969).
Nevertheless, the existence of BS ganglion cells begged the question of the functional significance of dendritic stratification and prompted speculation about “differencing” operations performed by such cells in frog retina (Lettvin et al., Reference Lettvin, Maturana, Pitts, McCulloch and Rosenblith1961). A simple explanation was afforded by the demonstration that the IPL could be divided into two sublaminae, a and b, containing the neural circuitry for OFF and ON responses, respectively (Famiglietti & Kolb, Reference Famiglietti and Kolb1976; Famiglietti et al., Reference Famiglietti, Kaneko and Tachibana1977; Nelson et al., Reference Nelson, Famiglietti and Kolb1978). The well-known ON-OFF DS cells were thus obvious candidates for the most commonly observed BS ganglion cell in rabbit retina (Famiglietti, Reference Famiglietti1983b), particularly in view of the evidence for co-stratification at both levels of BS1 ganglion cells and starburst amacrine (SA) cells (of two types), the latter corresponding in their mirror-symmetric organization to the cholinergic retinal neurons (Famiglietti, Reference Famiglietti1981a, Reference Famiglietti1983a,Reference Famigliettib, Reference Famiglietti1987a) demonstrated by Masland and Mills (Reference Masland and Mills1979). Also supporting this view was the pharmacological evidence for powerful effects of cholinergic agonists on ON-OFF DS ganglion cells (Masland & Ames, Reference Masland and Ames1976; Ariel & Daw, Reference Ariel and Daw1982).
The present Golgi study is part of a comprehensive morphological and quantitative analysis of ganglion cells in rabbit retina and identifies two types of BS ganglion cell in addition to BS1 cells. It appears that two examples with reportedly different physiological properties, resembling the BS2 cells identified and classified here, were stained intracellularly in a survey of rabbit ganglion cells, filled after extracellular physiological recording (Amthor et al., Reference Amthor, Takahashi and Oyster1989). The present study does not include “leptodendritic” cells (e.g., Famiglietti, Reference Famiglietti1990), nor a variety of more complex, multistratified cells (e.g., Famiglietti, Reference Famiglietti2005a), which will be described elsewhere.
Materials and methods
The tissue preparation, Golgi impregnation, and analytical methods for studying retinal ganglion cell have been laid out in detail elsewhere (Famiglietti, Reference Famiglietti1992a,Reference Famigliettib). The methods used conformed to institutional and NIH guidelines. A synopsis of these methods is presented below.
Golgi impregnation
Golgi-impregnated rabbit retinas were prepared according to a Golgi–Kopsch–Colonnier method described elsewhere (Famiglietti, Reference Famiglietti1985a). Briefly, pigmented rabbits (Dutch-belted, New Zealand red or black, and indeterminate strains with brown or black iris) were surgically enucleated, painlessly, under deep halothane anesthesia, and were euthanized by halothane overdose, followed by thoracotomy and exsanguination. The retinas were isolated from the posterior half of the eye under dim light in buffer and were flattened by making radial cuts from the periphery toward the center. They were then mounted in a sandwich of filter paper, which was held flat by a coverslip and rubber bands on a glass slide and were then fixed in aldehydes. The slide was immersed in an aldehyde–dichromate mixture and then in 1% silver nitrate, for a few days each. Retinas were dehydrated and mounted whole on glass slides either in DPX or in sheets of Epon/Araldite.
Retinal location of ganglion cells
Details of the methods for determining the location of mid-visual streak in each Golgi-impregnated retina and for accurate mapping of the retinal location of each cell are given in a previous communication (Famiglietti, Reference Famiglietti1992a). More than 1000 Golgi-impregnated ganglion cells were closely examined. A subsample of 59 well-impregnated type 1 bistratified cells was extracted from a large sample of more than 700 well-studied retinal ganglion cells in 15 retinas and was suitable for measurement of both cell body and dendritic field diameters. Only 12 well-impregnated examples of BS2 cells suitable for dendritic field measurement were identified in four of the 15 retinas. Most of the ganglion cells lay within 2 mm of mid-visual streak (dvs = 0.0). This distributional bias is a consequence of the concentration of ganglion cells in and near the visual streak, as well as of the Golgi–Kopsch–Colonnier impregnation method used here.
Measurement and analysis of cell body, dendritic field size, and axonal diameter
Camera lucida drawings were made of nearly all cells with a Zeiss drawing tube at magnifications ranging from 250× to 670×. Methods of determining cell body and dendritic field areas using best-fitting convex polygons are described elsewhere (Famiglietti, Reference Famiglietti1992a). Areas were converted to “equivalent dendritic field diameters,” according to the equation d eq = 2√(A/π), where A = dendritic field area.
The choice of location at which to measure the diameter of a ganglion cell axon is somewhat arbitrary, but the goal of such measurements is to relate this parameter to relative axonal conduction velocity. This quandary is somewhat reduced in the case of Golgi preparations of the retina, in which the length of axonal impregnation rarely exceeds the dendritic field radius and is usually less. The convention adopted here is to measure axonal diameter within one cell body diameter, at the widest point at which diameter does not taper for a distance at least equal to the diameter of that segment.
Corrections were not made for tissue shrinkage in Golgi preparations due to fixation and dehydration, when the sizes of Golgi-impregnated cells were graphed. Shrinkage has been estimated in this material to range up to 30% in all dimensions (Famiglietti, Reference Famiglietti1985a) and is typically 15–25%.
Graphic analysis
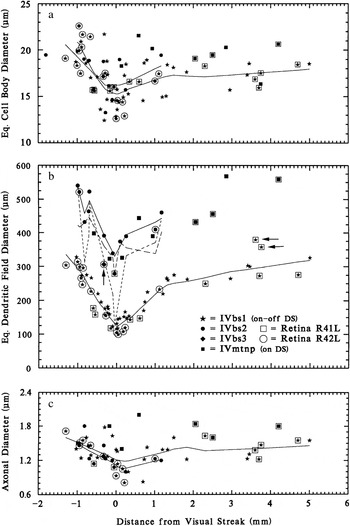
Cell body and dendritic field sizes were plotted as a function of distance from the visual streak (dvs). Curves were fitted to the distributions by the LOWESS (locally weighted statistical sampling) method (Cleveland, Reference Cleveland1979; Efron & Tibshirani, Reference Efron and Tibshirani1991) implemented in SYSTAT™. The F value (fraction of the total sample used to compute the curve locally) was adjusted to low values (F = 0.3–0.6) to reflect local variations, such as the sharp reduction of size in the visual streak. The values for equivalent dendritic field diameters of BS1, BS2, and BS3 cells, graphed as symbols in Fig. 1b, and to which LOWESS curves were fitted in the first two cases, are based on areas that are the envelopes of branching in both sublamina a and sublamina b, projected onto the retinal plane. For BS2 cells, field sizes for branching in sublaminae a and b were also graphed separately, because in some examples there are such large discrepancies in branching at the two levels in what appear to be completely impregnated cells.
Graph of cell body (a) dendritic field (b) and axonal (c) diameters of BS ganglion cells in rabbit retina, as they vary with distance from mid-visual streak (DVS). Axonal diameters were measured in a subset of the sample. The sizes of three types of BS cell are documented. Data from two of the several retinas used are singled out (R41L and R42L). There is little difference in cell body size or axonal diameter among class IV, type 1, 2, or 3 bistratified (IVbs1 or BS1, IVbs2 or BS2, IVbs3 or BS3) cells, but their dendritic field diameters differ significantly. Horizontal arrows indicate atypical BS1 cells, and vertical arrow indicates provisionally designated BS3 cell. In each graph, LOWESS curves are fitted separately to the data for BS1 and BS2 cells (solid lines). In b, equivalent dendritic field diameters are graphed separately as lines for branching in sublamina a (dots) and sublamina b (dashes) for BS2 cells.

Microscopic analysis of dendritic stratification
Analysis of dendritic stratification was performed for the most part in flattened, whole-mounted retinas, as described elsewhere in detail (Famiglietti, Reference Famiglietti1992b), using high-magnification, high–numerical aperture oil immersion lenses and an accurate, gear-driven (Zeiss WL, Oberkochen, Germany) microscope stage elevator. Dendritic stratification in the retina must be analyzed against a reference layer or layers. The most valuable material for the analysis of dendritic stratification, which can lead to a useful representation of stratification, substratification, and co-stratification of dendritic trees in the IPL of rabbit, is the whole, unsectioned, flat-mounted retina containing numerous instances of overlapping dendritic trees (e.g., Fig. 10). In these instances, “marker” cells constitute fiducials against which other less well-known cells can be studied. Consistency of relationships in level of stratification can thus be represented against a standard (e.g., Fig. 12). The most useful marker cells in the IPL of the rabbit for this study are the type a and type b SA cells, the type 1 bistratified (BS1) or ON-OFF DS ganglion cell, class I and class II cells (Famiglietti, Reference Famiglietti2004b), and the class IV, type 1 small tufted (IVST1) (local edge detector) ganglion cells (Famiglietti, Reference Famiglietti2005b).
Camera lucida drawings, digital photography, and reproduction
Camera lucida drawings were traced using a Zeiss RA microscope fitted with a Zeiss drawing tube and a 25× NA 0.65 or an oil immersion 40×, 50×, or 100× NA 1.0 long working distance microscope objective. Drawings were digitized at 600 dpi on a flatbed scanner and imported into Adobe Photoshop 6, where contrast and brightness were adjusted, and layered images at various gray levels illustrating levels of stratification were constructed. Photographs were taken through a 25× NA 0.65, 50× or 100× NA 1.0 oil immersion, objective lens in RAW format with a Canon G5 digital microscope camera, converted to TIFF files in Canon Zoombrowser software, and assembled and processed in Adobe Photoshop 6.0. Serial optical sections were generally taken at 2.0-micron intervals on a Zeiss WL gear–driven microscope stage. Dendritic branching was typically assembled en montage (summed) from two to four sections, depending on local tilt of the whole-mount preparation.
Quantitative analysis of dendritic trees
For BS1 cells and medial terminal nucleus–projecting (MTNP) cells, branching data were the same as those published previously (Famiglietti, Reference Famiglietti1992a). In most of these cases, computer logging of dendritic trees was performed on a computer-driven microscope system described elsewhere (Famiglietti, Reference Famiglietti1985a). The data of “terminal and preterminal branch length” and “distance from soma” were calculated from the logged structure of the dendritic tree and were exported into graphics and plotting systems. Shortest distances along the dendritic tree from the soma to the origins of each preterminal and terminal branch were extracted using the lengths of each preterminal branch and the stored branching topology. For BS2 and BS3 cells, scaled camera lucida drawings were digitized, and each dendritic branch was traced and measured, using (NIH) Image J software (National Institute of Health; url:rsb.info.nih.gov/ij/). Distances from the soma of each dendritic branch origin were calculated by summing on-path, preterminal branch lengths. These distances along with the length of each preterminal and terminal branch were transferred to a file in the statistical and graphing program, SYSTAT™, and terminal branch length was plotted against distance from the soma.
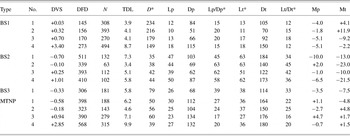
Straight lines were fitted to the distributions of terminal and preterminal branch lengths by the method of least squares (the slopes of which are tabulated as Mp and Mt in Table 1). Because the set of preterminal branches originates at the soma, the straight lines fitted to their distributions meet the ordinates of each graph, while those fitted to the terminal branch lengths do not, unless a primary dendrite does not branch. In addition, Gaussian bivariate ellipsoids were fitted to the data plotted. The ellipsoids are centered upon the sample means of x and y variables. The lengths of their major and minor axes are determined by the unbiased standard deviations of x and y, and their orientation is determined by the sample covariance between x and y. The size of an ellipse is determined by a probability value between 0 and 1. This value has been set at 0.5 in Fig. 7. If the data were bivariate normal, then 50% of the data points would lie inside the ellipse. The principal justifications for plotting Gaussian bivariate ellipsoids in these graphs of untransformed data are to mark the sample means (Lp, Lt, Dp, and Dt in Table 1) and to show, by the ellipsoid’s axial deviation from the linear regression plot, the presence of marked heterogeneity in the sample covariance, an indicator of significant heterogeneity among the terminal or preterminal branches. The Gaussian ellipsoid also provides a reference against which to assess the apparently typical aggregation of terminal branches of certain lengths within the dendritic fields of most ganglion cells.
Dendritic branching statistics

BS1, BS2, BS3 = type 1, type 2, and type 3 bistratified ganglion cells (BS1 = ON-OFF DS cell). MTNP = medial terminal nucleus–projecting (ON DS ganglion cell). DVS = distance dorsal (−) or ventral (+) to mid-visual streak. DFD = dendritic field diameter (μm). N = number of dendritic branches (per cell). TDL = total dendritic length (mm). D = dendritic density = TDL ÷ dendritic field area (mm/mm2). Lp = mean length, preterminal dendrites (μm). Dp = mean distance from cell body, preterminal dendrites (μm). Lt = mean length, terminal dendrites (μm). Lp = mean distance from cell body, terminal dendrites (μm). Mp = slope of line fitted to preterminal BLD (deg). Mt = slope of line fitted to terminal BLD (deg). Lp/Dp and Lt/Dt in percent.
* Statistics used in cluster analysis.
Cluster analysis
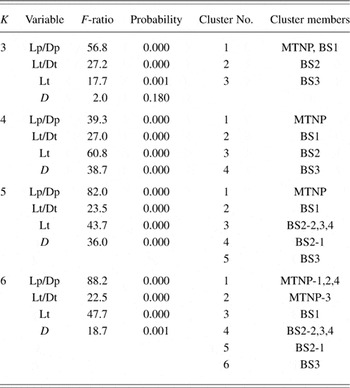
Cluster analysis was performed using a subset of branching statistics for each cell as input to the “cluster” module of the SYSTAT™ statistical program, version 5.03. Two types of clustering algorithms were used: (1) “K-means” for predicted (k) numbers of clusters (Table 2) and (2) agglomerative hierarchical clustering to show statistical affinity among all of the cells analyzed (Fig. 8), each selected from samples classified by other criteria.
Dendritic branching patterns: Cluster analysis

Results
Type 1 bistratified (BS1) ganglion cells
The morphology of type 1 bistratified (BS1) ganglion cells has been well characterized in previous publications (Famiglietti, Reference Famiglietti1983b, Reference Famiglietti1992a,Reference Famigliettib; Vaney, Reference Vaney1994; Amthor & Oyster, Reference Amthor and Oyster1995). Because they do not occur in paramorphic pairs: one type branching in sublamina a and another type branching in sublamina b, as do ganglion cells of classes I–III, they belong in class IV (Famiglietti, Reference Famiglietti1987b, Reference Famiglietti1992a). BS1 cells have medium-size cell bodies, axons, and dendritic field diameters (Fig. 1), in comparison to other ganglion cell types (Famiglietti, Reference Famiglietti1987b, Reference Famiglietti1992a, Reference Famiglietti2004a, Reference Famiglietti2005b). Their dendritic trees are narrowly stratified at two levels, one in the middle of sublamina a, the stratum (S)1/S2 border, and one in the middle of sublamina b, in S4β, and they are thus co-stratified with type a and type b SA cells (Famiglietti, Reference Famiglietti1981a, Reference Famiglietti1992b).
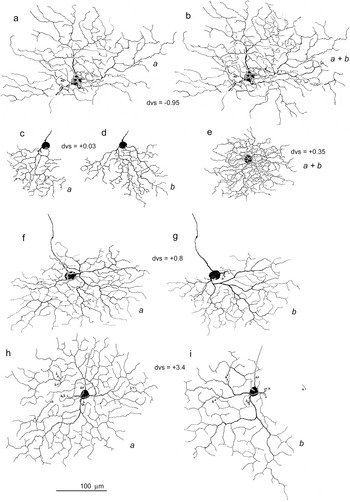
The branching pattern of BS1 cells is quite regular with wavy dendrites that give rise to short terminal branches, uniformly throughout the dendritic tree (Fig. 2). Quantitative analysis has shown that BS1 ganglion cells have a “tufted” branching pattern: increasing frequency of branching with radial distance from the cell body (Famiglietti, Reference Famiglietti1992a). The position of the dendritic tree with respect to the cell body may be concentric (Fig. 2e and 2h) or highly eccentric (Fig. 2f, 2g, 2h, and 2i). Typically, the dendritic field size is larger and the branching frequency per unit area is higher in sublamina a (Fig. 2f, 2g, 2h, and 2i), but exceptions can be found (Fig. 2c and 2d). Sometimes branches descend in retrograde fashion from sublamina a to sublamina b (Fig. 2h and 2i). In the usual case, this descending branch does not branch in sublamina b (Fig. 2i), as it invades the territory of an adjacent BS1 cell, with which it may be expected to tile the plane of branching without gaps and without overlap (Vaney, Reference Vaney1994; Amthor & Oyster, Reference Amthor and Oyster1995).
Camera lucida drawings of five BS1 ganglion cells in rabbit retina. The drawings of cells in c–i have appeared in earlier publications (e in Famiglietti, Reference Famiglietti1987a) (c–e, h, and i in Famiglietti, Reference Famiglietti1992a) (f and g in Famiglietti, Reference Famiglietti2005a). In some cases, the dendritic field arborizations in sublaminae a and b have been drawn separately (a or b) (c, d; f, g; and h, i). In other cases, only one level has been drawn separately (a). In two instances, the two levels have been superimposed (a + b) (b and e). Note the marked differences in size, as well as differences in density of branching, when comparing examples in the visual streak (c, d, and e) with those outside the streak.

Type 2 bistratified (BS2) ganglion cells
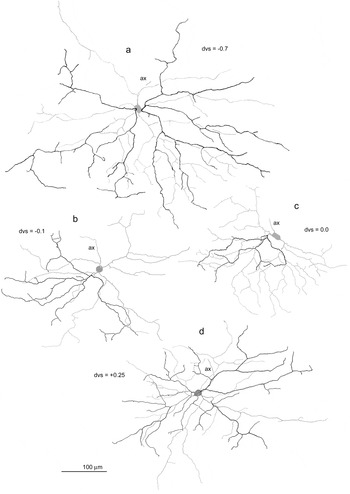
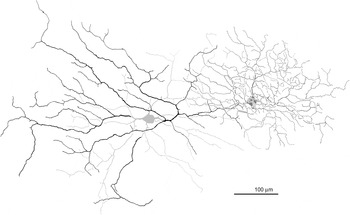
Type 2 bistratified (BS2) ganglion cells have medium-size cell bodies (Fig. 1a) but large dendritic trees (Fig. 1b). Like BS1 cells, their dendritic field size is significantly affected by proximity to mid-visual streak, markedly reduced at dvs = 0.0 (Fig. 1b). The dendritic branching pattern of BS2 cells is very different from that of BS1 cells. Overall, branching occurs at a much lower frequency and is more rectilinear than wavy (Fig. 3). In general, the pattern is “radiate” (Famiglietti, Reference Famiglietti1992a) with relatively straight dendrites extending radially from the cell body. The branching has a “windswept” look, however, due to the common occurrence of sharply retroflexive branching of some major dendritic branches near the cell body. It is also common for the dendritic branches to be asymmetrically disposed around the cell body. In the case of ganglion cells with more concentrically organized, radiate dendritic branching, such as class I cells, there are typically four to five primary dendrites originating from the cell body (Famiglietti, Reference Famiglietti1992a, Reference Famiglietti2004b). The asymmetry of BS2 cells is partly a consequence of the common occurrence of only two to three primary dendrites (Fig. 3b–3d). The field asymmetry is much more marked in sublamina a than in sublamina b, however. In the visual streak (−0.3 < dvs < +0.3), all BS2 cells in the sample exhibit less extensive branching (dotted and dashed curves, Fig. 1b) and a lower frequency of branching in sublamina a as compared to sublamina b. In contrast, outside the streak, five of seven examples had more extensive branching in sublamina a.
Camera lucida drawings of four BS2 ganglion cells in rabbit retina. In all cases, the branching in stratum (S) 1 is traced in black, while the branching in S5 together with the cell body has been traced in gray. As with BS1 cells, there is a significant difference in size between examples outside the visual streak (a) and those at the center of the visual streak (b and c). Dendritic trees are typically asymmetrical with more ventrally and laterally directed dendritic branches. Shorter terminal dendritic branches at the dendritic field perimeter are often directed away from one another at an angle of 180 deg. Note that dendritic branching is generally more extensive and more symmetrically disposed about the cell body in sublamina b. See text for further description.

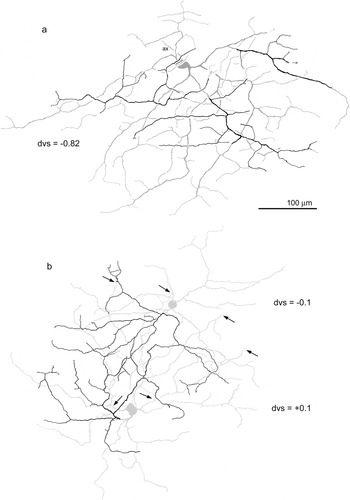
In most cases, the dendrites are ventrally directed with respect to the cell body. There is, however, in almost all cases a strong horizontal component to the alignment of major dendritic branches, a feature especially prominent in the examples of Figs. 4a and 6c and 6d. Even in examples with four primary dendrites, a greater frequency of branching is typically observed in one area of the dendritic tree, constituting one third to one fifth of the dendritic field area (especially Figs. 3a and 4a), a feature also noticeable in ON DS ganglion cells (Famiglietti, Reference Famiglietti1992a). It is usual for sparsely branched dendrites with long preterminal branches to extend well beyond or away from such areas of more concentrated branching. Short terminal dendritic branches do occur at higher frequency in the area of concentrated branching but otherwise are sparsely distributed throughout the dendritic tree. These short branches, 25–75 microns in length, often branch at right angles to the radiating parent branch. At the perimeter of the dendritic field, it is common to see terminal branches 50–100 microns in length, originating from the same parent branch, that are directed away from each other at nearly 180 deg (Figs. 3a, 3b, and 3c and 4a) or alternatively three terminal branches originating in close proximity at about 90 deg to each other (Figs. 3a and 3d and 4a).
Camera lucida drawing of three BS2 ganglion cells. As in Fig. 3, branching in stratum (S) 1 is traced in black, while branching in S5 is traced in gray. (a) Two zones of exaggerated horizontal branching are evident, one in sublamina a (lower mid-field) and one in sublamina b (upper field). In two instances, distal dendritic branches leave sublamina a to rejoin branches in sublamina b, where branching is more extensive and more complex. Two distal dendrites are incompletely impregnated (arrows). (b) Presumed nearest neighbors, one of which is illustrated in Fig. 3b. Dendritic field overlap is greater in sublamina b than in sublamina a, the field perimeter extending just past the neighboring cell bodies (arrows). See text for further explanation.

Topographic spacing of BS2 cells
In two instances, two BS2 cells are impregnated in close proximity. In the example of Fig. 4b, the two are presumed nearest neighbors. Their longest dendrites (in sublamina b) extend to or just beyond the cell body of the nearest neighbor. The branching in sublamina a, however, extends only about two third of the distance between cell bodies. As demonstrated for another relatively sparsely branched rabbit ganglion cell with a radiate dendritic branching pattern, the class Ia2 cell which happens to be dye coupled to nearest neighbors, proximity of nearest neighbors appears to be closely related to the dendritic field perimeter (Famiglietti, Reference Famiglietti2004a). Thus, the cell bodies of nearest neighbors of the same type are distributed in an array 10–20 microns inside the dendritic field perimeters of each member of the array, as determined from the branching in sublamina b. The separation of cell bodies in this example is 190 μm. Converting this distance to density, a value of 28 cells/mm2 is obtained. At this retinal location, estimating 20% shrinkage of the Golgi-impregnated retina, where total ganglion cell density would be approximately 5000 × 1.2 = 6000 cells/mm2 (Oyster et al., Reference Oyster, Takahashi and Hurst1981, Reference Oyster, Takahashi, Fry and Lam1987), BS2 cells would be expected to comprise about 0.5% of the total number of ganglion cells in the visual streak.
Atypical BS1 ganglion cells
As previously noted (Famiglietti, Reference Famiglietti1992a), there is little variation in dendritic field size of BS1 cells at a given retinal location, a fact confirmed by others (Vaney, Reference Vaney1994). In the present study, the sample size is nearly doubled to 59 cells from eight retinas, and the examples from two retinas are singled out in the quantitative analysis (Fig. 1b). Examples from R42L adhere closely to the local mean diameter, except in the visual streak, where the local variation is larger. This greater variation in the visual streak is reminiscent of that observed for class I cells (Famiglietti, Reference Famiglietti2004a). Variation among individuals may account for this difference in the streak or else differential shrinkage of the retina in processing, but evidence of variation in the density of ganglion cells in the visual streak has been related to expression of the albino gene (Oyster et al., Reference Oyster, Takahashi and Hurst1981). Thus, strain differences could account for this variation. (No albinos were used in this study, but pigmented animals of different strains were used.)
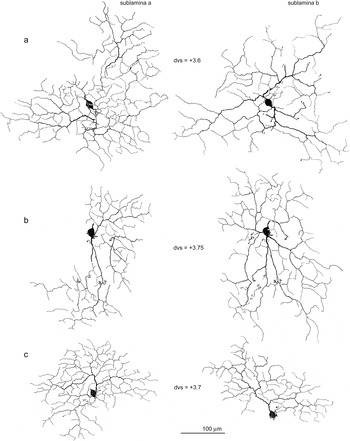
In R41L, dendritic field diameter is consistently lower than the local mean by 15–20%, again consistent with the evidence for minimal local variation in dendritic field diameter. Two examples of BS ganglion cells from retina R41L lie well outside the size ranges for the dendritic field diameters of BS1, however (Fig. 1b, horizontal arrows). While significantly larger than other BS1 cells, they are markedly smaller than BS2 cells. The two atypical cells are depicted in the camera lucida drawings of Fig. 5a and 5b, along with a third, typical, BS1 cell from the same retina at the same distance from the visual streak (Fig. 5c). Close examination of the branching pattern shows that these atypical cells are indeed BS1 cells with relatively regular arrays of short terminal branches.
Camera lucida drawings. Atypical BS1 ganglion cells. Branching in sublamina a (left) and sublamina b (right) is shown separately. Two cells (a and b) are much larger in dendritic field diameter than a third (c), although all three are found at nearly the same dvs in retina R41L (see Fig. 1b). The third cell (c) is typical of BS1 cells in dendritic field size and branching pattern. At a finer scale, the larger, atypical cells also exhibit typical BS1 branching: a fairly uniform density of short terminal branches and a higher branching frequency in sublamina a. The enlarged fields have an abnormal, bilobed dendritic field distribution, particularly notable in sublamina a. See text for interpretation.

These two atypical BS1 cells share two unusual features in their enlarged fields: extensive branching in sublamina b and two, almost disconnected, fields in sublamina a. The example of Fig. 5a exhibits a typical feature of BS1 cells noted above of an obviously higher branching frequency in sublamina a, a feature just detectable in the example of Fig. 5b and in the typical example of Fig. 5c. The two anomalous examples are within 750 microns of each other, but the nearest is about 3 mm from the “normal” example. A possible explanation for these unusually large cells is considered below in the Discussion section.
A third type of BS ganglion cell
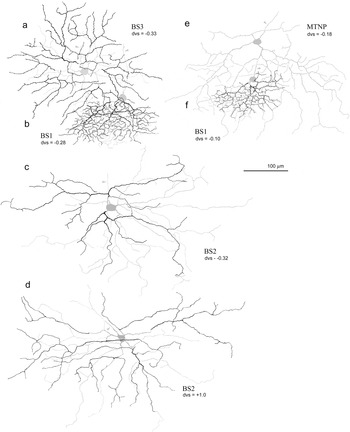
Another BS ganglion cell of intermediate size (Fig. 1, vertical arrow) is not similar to either member of the BS1/BS2 dichotomy. This anomalous cell, lying at the upper edge of the visual streak, is depicted in the camera lucida drawing of Fig. 6a. It overlaps a BS1 cell which is also drawn (Fig. 6b). Apart from size, its branching pattern is clearly much different from that of the BS1 cell, although it shares with the latter a relatively regular branching pattern, and the generation of terminal branches is of rather uniform size. The branching in sublamina a is significantly more well developed than that in sublamina b, a sublaminar difference similar to but more pronounced than that exhibited by BS1 cells. Because of their field overlap, it is possible to conclude that the two levels of branching of this anomalous example are different from those of BS1 cells and approximately the same as those of BS2 cells (see below).
Camera lucida drawings. Three types of BS ganglion cells with an MTNP cell for comparison, in the visual streak. A probable third type of BS ganglion cell (a) (IVbs3 in Fig. 1) is clearly different from the much smaller and more highly branched BS1 cell (b), which it overlaps in the same retina. It also differs markedly from BS2 cells: one example from a different retina at the same dvs (c) and another from the same retina (d) at a different location that yields a comparable size. The BS3 cell has a much more regular branching pattern than that of BS2 cells, resembling the much more densely branching BS1 cell in the presence of a fairly even distribution of short terminal branches. An MTNP cell (e) with overlapping BS1 cell (f) (examples depicted in Famiglietti, Reference Famiglietti1992b) is shown for comparison. See text for details.

A comparison of this cell with a BS2 cell from the same location in a different retina (Fig. 6c), and with a more ventral BS2 cell in the same retina (Fig. 6d), shows, however, that it has little in common with BS2 cells, in regard to branching pattern, having a much more symmetrical and regular pattern. Moreover, its dendritic field size is smaller than that of BS2 cells at a comparable location (Fig. 1b). Although only a single example of this “new” BS cell type has been found in the present material, its clear distinction from BS1 and BS2 cells and its distinctive branching pattern warrant a provisional designation of “BS3.”
Other BS ganglion cell types
A ganglion cell identified in rabbit retina as the ON DS ganglion cell (Amthor et al., Reference Amthor, Takahashi and Oyster1989) has a recognizable morphology (Fig. 6e), shared by cells projecting to the medial terminal nucleus of the accessory optic system (Buhl & Peichl, Reference Buhl and Peichl1986). MTNP cells have been analyzed in terms of their dendritic branching pattern (Famiglietti, Reference Famiglietti1992a) and level(s) of dendritic stratification (Famiglietti, Reference Famiglietti1992b). Oddly, some of these cells are partly BS but only within about 1 mm from mid-visual streak (−1 < dvs < 1) (Buhl & Peichl, Reference Buhl and Peichl1986; Famiglietti, Reference Famiglietti1992b). In one study, about 40% of the MTNP cells, in the range −1 < dvs < 1, had one or a few branches in sublamina a (Buhl & Peichl, Reference Buhl and Peichl1986). The functional significance of this bistratification is not clear, as the normal directional response of these cells is ON, rather than ON-OFF as it is for BS1 cells (Oyster, Reference Oyster1968). MTNP cells are included in this analysis for the following reasons: (1) they are sometimes BS; (2) they are similar in dendritic field size to BS2 cells at all retinal locations (Fig. 1b), although they are somewhat larger in cell body size and axonal diameter (Fig. 1a and 1c); (3) their branching pattern, although recognizable, might be confused with that of other cell types, if cells for comparison are not available from similar retinal locations; and (4) the previous quantitative analysis of their branching provides a heuristic comparison with that of BS2 and BS3 cells in a cluster analysis (see below).
Leptodendritic ganglion cells, of which the commonly displaced ganglion cells of rabbit retina constitute a subgroup (Famiglietti, Reference Famiglietti1990), also include BS ganglion cells that will be described elsewhere in the context of the leptodendritic group. A few other types of ganglion cell in rabbit retina, including “spiny” ganglion cells (unpublished data), exhibit “minor” bistratification of one or a few dendritic branches, similar to that of MTNP cells (Buhl & Peichl, Reference Buhl and Peichl1986; Famiglietti, Reference Famiglietti1992b).
BS ganglion cells: Quantitative analysis of dendritic branching patterns
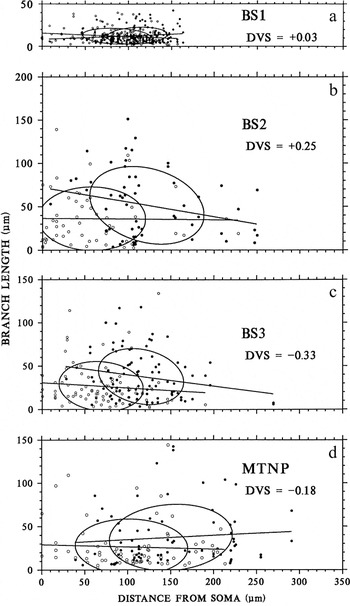
Dendritic branching patterns are generally the most distinctive morphological feature of retinal ganglion cells, although their dendritic stratification in the IPL may be of more functional significance (Famiglietti, Reference Famiglietti1992a,Reference Famigliettib). Several systems of quantitative analysis of dendritic branching patterns were examined, and a new approach was devised which seemed to offer the greatest sensitivity to morphological differences among ganglion cell types (Famiglietti, Reference Famiglietti1992a). ON and ON-OFF DS (BS1 and MTNP) ganglion cells were analyzed by this new method and despite their great difference in dendritic field size (e.g., Fig. 1b) were found to have similarities in their branching patterns (Famiglietti, Reference Famiglietti1992a). Branching data from that study for BS1 and MTNP cells are reproduced in Table 1, and typical examples of “branch length distributions” (BLDs) for BS1 and MTNP cells are illustrated in Fig.7a and 7d. Four examples of BS2 cells and the BS3 cell are newly analyzed (Table 1), and one BLD of each is illustrated in Fig. 7b and 7c.
BLDs of three types of BS ganglion cell and an MTNP cell. Distance from mid-visual streak (DVS) is given for each; all lie within the visual streak. Each scatter plot represents a single example. Preterminal (circles) and terminal (dots) branches are plotted separately, each symbol representing the length of a branch (ordinate) and the distance of its origin from the soma (abscissa) along the path of branching. Straight lines are fitted to the distributions by the method of least squares, and Gaussian bivariate ellipsoids are fitted to the data plotted. The ellipsoids are centered upon the sample means of x and y variables. Although very different in size, BS1 and MTNP cells are most similar in fundamental branching statistics. BS2 cells are quite different from the other three types. See text for details.

As previously described, BLDs are point scatter graphs of the lengths of preterminal (PTD) and terminal (TD) dendritic branches (y, ordinate) against the distance of their origins from the soma along the path of the dendritic tree (x, abscissa). The significance of various details of the graphs is indicated in the Materials and methods section. Briefly, lines are fitted separately to the preterminal (BLDp, or P) and terminal (BLDt, or T) distributions by the method of least squares, and ellipses are centered on the sample means of the x and y variables. As previously noted, BS1 cells have largely overlapping P and T distributions, concentrated at a distance from the soma, a very low value of mean branch length, and least squares fits with slopes (Mp and Mt) near zero (Fig. 7a). These features are indicators of regularity of branching and a relatively uniform field of short preterminal and terminal branches and are characteristic of the “tufted” branching pattern (Famiglietti, Reference Famiglietti1992a, Reference Famiglietti2004b). Although much larger in field diameter, MTNP cells share with BS1 cells (1) significant overlap of relatively “flat” ellipses, (2) separation of the ellipses from the origin (soma), and (3) values of Mp and Mt in the range of ±5 deg (Fig. 7d).
BS2 cells differ significantly from BS1 and MTNP cells in branching pattern. Most noticeable is the fact that the P-distribution ellipse intersects the ordinate, indicating a high frequency of (preterminal) branching near the soma, a pattern typical of class I cells with a radiate branching pattern (Famiglietti, Reference Famiglietti1992a, Reference Famiglietti2004b). Second, the mean lengths of both preterminal and terminal dendrites (Lp and Lt in Table 1) are significantly greater for BS2 cells than for MTNP cells of comparable size. Third, for BS2 cells, the slope, Mt, is significantly negative (−10 ≤Mt, see Table 1), an indication of longer terminal branches originating near the soma and shorter ones near the field perimeter. This situation is typical of cells with rectilinear, radiate branching, which is usually less dense and thus often affords a clear path in its substratum for long terminal dendrites originating near the soma that do not encounter other branches of the same cell. For most narrowly stratified ganglion cells, dendritic intersections or crossings of their own dendrites are very limited.
The BS3 cell differs significantly from BS2 cells in several respects, having a higher density of branching (D, in Table 1), which also differentiates it from MTNP cells, and smaller values of Lp and Lt. Note that these values are about the same as those of MTNP cells (Table 1). The values of Dp and Dt are notably smaller, however, than those of MTNP cells. Of interest is the dense cluster of short preterminal dendrites in the range 40 < Dp < 100. This cluster is an indicator of the regularity of branching of the BS3 cell, a feature shared with BS1 cells, as noted above, that differentiates it from the irregular branching of BS2 cells. The most regular feature of BS2 cells is a tendency for dendritic branches (of widely varying lengths) to originate at a distance of about 100 μm from the soma (Fig. 7b).
Cluster analysis of BS ganglion cells based on branching pattern
Perhaps the greatest difficulty of analyzing and classifying retinal ganglion cells lies in the effects on parameters of size and branching pattern of proximity to central retina. Thus, members of the same type are much smaller and more packed together in central retina than they are in peripheral retina. Parameters most affected are field diameter and cell body size, but branching density is also affected to a lesser extent. Relative length of terminal dendrites, which may be characteristic of several cell types, is also affected, and the enlargement of the whole dendritic field with distance from the visual streak generally affects all branches, as would be the case for a tree painted on an expanding balloon.
Although the samples of cells of each type chosen for analysis were selected from different retinal locations in order to show the degree to which patterns are maintained over a range of sizes, some parameters, such as dendritic density (D) and mean terminal branch length (Lt), are sufficiently different that they remain relatively robust differentiators with changing dvs (Table 1). The effects of dvs are reduced by introducing ratios of distance and length for preterminal and terminal branches (Lp/Dp and Lt/Dt in Table 1). The four variables Lp/Dp, Lt/Dt, Lt, and D are the four dendritic branching parameters used in the cluster analysis of samples of the BS3 cell and four examples each of BS1, BS2, and MTNP ganglion cells (Table 2; Fig. 8).
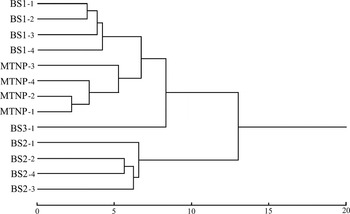
Hierarchical clustering tree, showing the relationships, in terms of quantitative dendritic branching analysis, between four examples each of BS1, BS2, and MTNP cells and a single BS3 cell, in Euclidean space (bottom scale). The identities of individual cells and their branching statistics are given in Table 1. Members of each type are most closely related to each other. BS1 and MTNP cells are more closely related than each to other types. The BS3 cell is more similar to the former two than to BS2 cells, which form a distant group.

Two kinds of cluster analysis were used in this study, k-means clustering, in which the number of clusters (k) is preset and membership in each cluster determined (Table 2), and agglomerative hierarchical clustering, which demonstrates the relationship of each member to each by distance within a relational tree (Fig. 8). K-means clustering was performed on the 13 cells, using the variables indicated above, and K was assigned the values 3, 4, 5, and 6. Cluster membership is indicated for each cell by a designation of “type” (among four types) determined by (1) size; (2) dendritic stratification; and (3) dendritic branching pattern assessed by nonstatistical visual inspection and comparison, as well as an Arabic numeral indicating each individual within a type. Two statistics are given in Table 2 that indicate the quality of “fitness” of each value of K. The “Probability” is an indicator of the likelihood of correct assignment of membership in each cluster for each variable, and the “F-ratio” is an indicator of the weight assigned to each variable in the determination.
The first thing to note in Table 2 is that for each value of K in the range of 3–6, the BS3 cell stands apart from the others. This is the primary statistical evidence for assigning the designation BS3 to this single example. Second, for K = 3, BS1 and MTNP cells cluster together. This confirms the point made previously that, despite their difference in size and density of branching, these two cells of similar function (ON-OFF and ON DS cells) exhibit similar features in their branching patterns (Famiglietti, Reference Famiglietti1992a). For K = 3, evidently, density (D) had a very small influence on clustering (F-ratio = 2.0) and correspondingly a lower probability of affecting correct assignment to a cluster. On the other hand, Lp/Dp has a relatively large influence in the assignments.
In terms of probability, K = 4 and K = 5 appear equally satisfactory in subdividing the sample of 13 cells. For K = 5, one of the BS2 cells is separated from the other BS2 cells and resides in its own cluster. In reference to F-ratio, however, for K = 5, Lp/Dp exerts disproportionate influence on cluster assignment, whereas for K = 4, the influence of the four selected variables is more equal. Thus, a four-cluster segregation of the 13 ganglion cells appears to be the best statistical solution to the morphological classification of this sample in terms of branching pattern. Moreover, considering cluster membership, each of the clusters corresponds to one of the four types determined by other means.
Hierarchical clustering applied to the sample of 13 cells illustrates in a more graphical fashion the relationships among the individual cells in Euclidean space (Fig. 8). As noted above, BS1 and MTNP cells are more closely related to each other than either is to BS2 or BS3 cells. The BS3 cell was noted above to share with BS1 cells features of uniformity of branching and the generation of relatively short terminal branches of comparable length. The tree of Fig. 8 shows the BS3 cell to be about equally related to BS1 and MTNP cells, in terms of the variables selected, but not closely related to BS2 cells, which form a group that is quite separate from BS1, MTNP, and BS3 cells.
Dendritic stratification of BS1 and BS2 cells
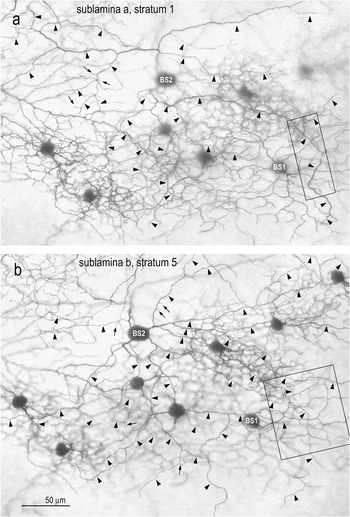
The dendritic stratification of BS2 cells has been analyzed quantitatively by measuring against the levels of branching of overlapping BS1 ganglion cells or SA cells, employed as “fiducial” cells (Famiglietti, Reference Famiglietti1992b, Reference Famiglietti2004b, Reference Famiglietti2005b). An example of overlap is shown in Fig. 9. There is some variation in the precise levels of dendritic stratification with retinal location (e.g., Famiglietti & Vaughn, Reference Famiglietti and Vaughn1981), when measured as a percentage of the thickness of the IPL. The relative positions of the dendritic branching of the two cell types are preserved, however, in the “stack” of strata in the IPL. The cells of Fig. 9 lie nearly 1 mm dorsal to mid-visual streak, where the IPL is relatively thin. Consequently, the distance between adjacent strata is small. Nevertheless, when comparing BS1 and BS2 cell dendrites at sites of dendritic crossing, the dendrites of BS2 cells in sublamina a are observed to lie nearer to the amacrine cell bodies in S1 and BS2 dendrites in sublamina b branch nearer to the layer of ganglion cell bodies (GCL) (Fig. 9).
Camera lucida drawings. Overlapping BS1 (right) and BS2 (left) cells in dorsal retina. The BS1 cell is the same as depicted in Fig. 2a and 2b. The BS2 cell is unusual in the present sample in having more extensive dendrites in sublamina a as compared to sublamina b, in typical fashion; however, the branches in sublamina a (black) are more asymmetrically disposed than those in sublamina b (gray).

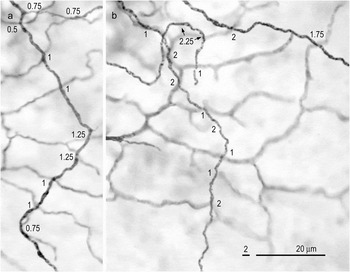
In a second, more central location, at the upper edge of the visual streak (Fig. 10), where the IPL is thicker, the relative levels of dendritic stratification of overlapping BS1 and BS2 ganglion cells can be more accurately determined. Distances between BS1 and BS2 dendrites are measured at 10 dendritic crossings in sublamina a and 13 in sublamina b (Fig. 11). On average, the distance between dendrites is 0.925 microns in sublamina a and 1.5 microns in sublamina b. Because the average thickness of the BS1 and BS2 cell dendrites measured in sublamina a is approximately 0.35 and 0.65 microns, respectively, and the focal plane for measurement in each case is assumed to be in the center of the dendritic segment, the separation of the BS1 and BS2 cell dendritic membranes is more than 0.4 microns ((0.925 − ((0.35 + 0.65)/2)) = 0.425). Measured in similar fashion, the average gap between BS1 and BS2 dendrites in sublamina b is approximately 1.0 micron. Consequently, the dendrites of BS1 and BS2 cells do not come into contact, at least in central retina. Hence, it is expected that BS2 cell dendrites are out of range of synaptic input from SA cells (Fig. 12). Up to the present, however, no examples of overlap of BS2 cells with SA cells have been identified for study in this material.
Photomicrographs. Overlapping BS1 and BS2 cells in the visual streak. The focus in a is on the BS2 branching in S1 of sublamina a and in b is on S5 in sublamina b. Arrowheads indicate the dendrites of the BS2 cell, and arrows mark the long dendritic spines protruding from its dendrites. Boxed areas in a and b are shown at higher magnification in Fig. 11 respectively. Photographed here with a 25× NA 0.65 lens. Calibration bar in b applies to a and b.

Photomicrographs. Overlapping BS1 and BS2 cells in the visual streak (boxed areas in Fig. 8). Laminar distances between crossing BS1 and BS2 dendrites are given at each crossing. Note that the average distance in a (sublamina a) is less than the average distance in b (sublamina b). The gap between BS1 and BS2 dendrites is sufficient to make contact between BS2 cells and SA cells unlikely in both sublaminae. See text for details.

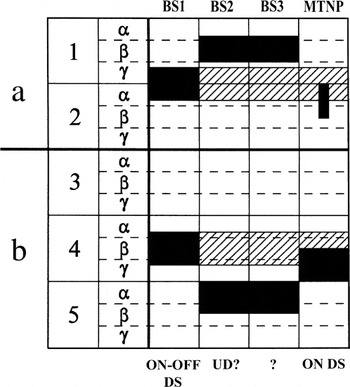
Stratification diagram of the IPL. The levels of branching in the IPL are illustrated for each of the BS ganglion cell types described in this report. Hatching indicates the branching of SA cells.

As noted above, the branching of the putative BS3 ganglion is about the same as that of BS2 cells. This estimate can be made because of its overlap with the fiducial BS1 cell, as illustrated in Fig. 6.
Summary: Dendritic stratification of BS ganglion cells
The standardized stratification diagram for comparative reference displays five equally thick strata, each subdivided into three equal substrata, strata 1 and 2 in sublamina a and strata 3–5 in sublamina b (Fig. 12). On this standard are superimposed the two starburst substrata (diagonal hatching, in Fig. 12), which are reliably found in the middle of sublaminae a and b. These are also the two levels of branching of BS1 ganglion cells (Famiglietti, Reference Famiglietti1981a, Reference Famiglietti1983b, Reference Famiglietti1987a, Reference Famiglietti1992b). The closely analyzed example of dendritic field overlap between BS1 and BS2 cells (Figs. 10 and 11) lies about 300 microns dorsal to mid-visual streak. The average thickness of the IPL measured in this location is 18 microns. At this location, therefore, each standard stratum is 3.6 microns thick, and each standard substratum is 1.3 microns thick. Since BS1 dendrites are centered at the S1/S2 border in sublamina a and in the middle of S4 in sublamina b (Famiglietti, Reference Famiglietti1992b), the dendrites of BS2 cells lie in S1β and S5α and the dendrites of BS3 cells appear to lie at the same two levels (Fig. 12).
Dendritic branching of BS ganglion cells
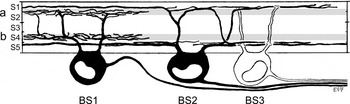
The morphology and stratification of BS1, BS2, and BS3 ganglion cells are illustrated in Fig. 13. It is important to note that only BS1 ganglion cells are within range of synaptic input from SA cells (gray bands in Fig. 13).
Summary drawing of the three types of BS ganglion cells in rabbit retina. The three types do not differ significantly in cell body size or axonal diameter. BS1 ganglion cells have the smallest and BS2 cells the largest dendritic field diameters, whereas the BS3 cell is intermediate in field size. BS1 ganglion cells are co-stratified with SA cell dendrites (gray bands), whereas BS2 and BS3 cells are co-stratified, each with the other, but out of range of SA cell input in the extensive, horizontal components of their dendritic branching.

Discussion
Neural organization for contrast-independent responses
Published evidence shows that there are two types of neural organization exhibited by retinal ganglion cells that subserve contrast-independent responses (similar responses to increments and decrements of light): dendritic stratification near the a/b sublaminar border of the IPL and bistratification with two independent arbors, one each in sublaminae a and b. The first type is exemplified by certain wide-field ganglion cells in carp retina (Famiglietti et al., Reference Famiglietti, Kaneko and Tachibana1977) and in the local edge detector of rabbit retina (Levick, Reference Levick1967; Amthor et al., Reference Amthor, Takahashi and Oyster1989; Famiglietti, Reference Famiglietti2005b; van Wyk et al., Reference van Wyk, Taylor and Vaney2006). The second type is typified by the well-studied type 1 bistratified (BS1/ON-OFF DS) ganglion cell described here and elsewhere (Famiglietti, Reference Famiglietti1981a, Reference Famiglietti1983b, Reference Famiglietti1985b, Reference Famiglietti1987b, Reference Famiglietti1992a,Reference Famigliettib, Reference Famiglietti2005a; Amthor et al., Reference Amthor, Oyster and Takahashi1984; Vaney, Reference Vaney1994; Yang & Masland, Reference Yang and Masland1994; Amthor & Oyster, Reference Amthor and Oyster1995).
The first type may receive cone bipolar cell input from both depolarizing and hyperpolarizing bipolar cells (Famiglietti, Reference Famiglietti2005b; van Wyk et al., Reference van Wyk, Taylor and Vaney2006), by virtue of overlap between the bipolar cell axon terminal near the a/b sublaminar border (Famiglietti, Reference Famiglietti1981b, Reference Famiglietti2005a). The second type receives cone bipolar cell input from different bipolar cell types with nonoverlapping axon terminals, which in the case of BS1 cells may be selective for ON-OFF DS ganglion cells (Famiglietti, Reference Famiglietti1981b, Reference Famiglietti1991, Reference Famiglietti2002, Reference Famiglietti2005a) and may be in part DS (Famiglietti, Reference Famiglietti1993, Reference Famiglietti2002, Reference Famiglietti2005a). The ganglion cells described in this report all conform to the second type and are expected to have similar responses to dark or light objects on a contrasting background.
BS1 ganglion cells: Neural architecture for directional selectivity in rabbit retina
BS1 cells were first equated with ON-OFF DS ganglion cells (Famiglietti, Reference Famiglietti1981a), by virtue of their co-stratification with mirror-symmetric SA cells (Famiglietti, Reference Famiglietti1983a,Reference Famigliettib, Reference Famiglietti1992b), postulated to be cholinergic amacrine cells, as later confirmed (Masland et al., Reference Masland, Mills and Hayden1984; Tauchi & Masland, Reference Tauchi and Masland1984), about the same time that the ganglion cell identity was demonstrated (Amthor et al., Reference Amthor, Oyster and Takahashi1984). It has been shown with Ca2+-sensitive indicator dyes that individual dendrites of SA cells exhibit different DS responses (Euler et al., Reference Euler, Detwiler and Denk2002), confirming the idea that visual information processing in SA cells is localized to dendritic subregions by virtue of the very thin dendritic segments in intermediate and distal zones of their dendritic fields (Famiglietti, Reference Famiglietti1983a, Reference Famiglietti1991; Miller & Bloomfield, Reference Miller and Bloomfield1983).
All across the retina, in the narrow starburst substratum of sublamina a, there are four complete mosaics of ON-OFF DS cells representing four cardinal directions of motion. In the starburst substratum of sublamina b, there are seven complete ganglion cell mosaics representing four different directions of motion for ON-OFF DS cells and three different directions of motion for ON DS ganglion cells (Oyster, Reference Oyster1968; Vaney, Reference Vaney1994; Amthor & Oyster, Reference Amthor and Oyster1995). The highly localized nature of the synaptic interactions underlying the DS mechanism, postulated above and elsewhere and documented in part (see above; Euler et al., Reference Euler, Detwiler and Denk2002), would appear to be dictated by the evidence that a single SA cell dendrite may contact the overlapping dendrites of BS1 (ON-OFF DS) ganglion cell dendrites representing different directional of motion, as well as the dendrites of ON DS ganglion cells (Famiglietti, Reference Famiglietti2002).
The presence of multiple mosaics sharing two narrow substrata of the IPL suggests a highly ordered, two-dimensional arrangement of BS1 ganglion cells across the retina (Vaney, Reference Vaney1994). Consistent with this arrangement is the observation, previously reported, that the variation in dendritic field diameter of BS1 cells is quite small at a single retinal location (Famiglietti, Reference Famiglietti1992a). In the present report, a near doubling of the sample size as well as the identification of subsamples taken from different retinas supports the previous observations. In particular, the subsample of cells from retina R42L shows cells with dendritic field sizes very close to the local average (Fig. 1b). It also shows, however, smaller-than-average cells in the visual streak of R42L. This result is unlikely to be due to differential shrinkage of R42L in the visual streak but suggests somewhat greater variability in the streak, reminiscent of the findings of variation in density of ganglion cells in the visual streak that correlates with expression of the albino gene (Oyster et al., Reference Oyster, Takahashi and Hurst1981). (None of the animals in the present study were albinos, but different pigmented strains were used.)
The subsample of cells from retina R41L was consistently smaller than the local average by 10–20%, a difference likely due to individual variation among animals. Two aberrant BS1 cells were exceptions, however, one third larger in equivalent dendritic field diameter (about 1.8 times the dendritic field area) than others in the same retina at the same distance from the visual streak. The probable reason for this discrepancy is an uncommon, localized developmental disturbance of one of the DS mosaics: a “dropout” of ON-OFF DS ganglion cell precursors, coupled with a developmental imperative toward complete dendritic field mosaics for each directional type, resulting in compensatory dendritic field enlargement (cf. Perry & Linden, Reference Perry and Linden1982).
BS2 ganglion cells: Does a unique morphology reflect a unique physiology?
In preceding studies, only two examples of BS2 cells have been illustrated, both in the same survey of rabbit ganglion cells with “complex” receptive field properties (Amthor et al., Reference Amthor, Takahashi and Oyster1989). They have not been identified in other surveys of rabbit ganglion cells (e.g., Roska & Werblin, Reference Roska and Werblin2001; Rockhill et al., Reference Rockhill, Daly, MacNeil, Brown and Masland2002). Unfortunately, in the physiological study of Amthor et al., which employed intracellular staining after extracellular recording of responses, two very different physiological types “orientation selective” and “uniformity detector” were assigned to two examples of what appears to be a single morphological type: cells. Furthermore, a cell with very different, asymmetrical morphology was also identified as an “orientation-selective” cell. The latter had physiological responses exhibited by 90% of the “orientation-selective units” identified in the study originally characterizing them: OFF-center responses with flanking ON regions (Levick, Reference Levick1967). Another study of orientation-selective ganglion cells using intracellular recording and staining also labeled cells of more than one morphology (Bloomfield, Reference Bloomfield1994). In that study, however, intracellularly stained cells resembled neither BS2 cells nor the asymmetrical cells of Amthor et al. (Reference Amthor, Takahashi and Oyster1989).
Given the physiological responses of most orientation-selective ganglion cells, and the fact that antagonists of γ-aminobutyric acid convert the “bar-flank” arrangement to a center-surround receptive field organization (Caldwell et al., Reference Caldwell, Daw and Wyatt1978), one would not expect a priori that orientation-selective cells would be BS, as they are not fundamentally contrast independent in their responses. It is possible that orientation selectivity in the retina is different from directional selectivity, in that it is a property shared by cells of several different types with several different functional roles. Levick (Reference Levick1967) has noted that rabbits can discriminate stimulus orientation better than could be signaled by cells sensitive to only two stimulus orientations, as is the case for rabbit ganglion cells, ambiguous in their signaling of oblique orientations. Retinal orientation selectivity may therefore serve some more-or-less specific, but as yet indeterminate role in vision, perhaps having to do with maintaining upright orientation of the head or body in visual space, different from the visual object–related function mediated by orientation-selective units in the visual cortex (e.g., Hubel & Wiesel, Reference Hubel and Wiesel1962).
The other physiological type identified with BS2 ganglion cells is the “uniformity detector”(Amthor et al., Reference Amthor, Takahashi and Oyster1989). Uniformity detectors are difficult to identify physiologically because of their unique properties, and not more than 15 have been reported (Levick, Reference Levick1967; Caldwell & Daw, Reference Caldwell and Daw1978; Caldwell et al., Reference Caldwell, Daw and Wyatt1978; Vaney et al., Reference Vaney, Levick and Thibos1981; Amthor et al., Reference Amthor, Takahashi and Oyster1989). Two aspects of morphophysiological correlation favor the identity of BS2 cells with uniformity detectors, rather than orientation-selective units. The first correlation is based on the well-established relationship between axonal conduction velocity and axonal diameter. The axonal diameters of BS2 cells, although slightly smaller on average, do not differ significantly from those of BS1 cells (Fig. 1c). BS1/ON-OFF DS cells exhibit rapid axonal conduction velocities (Caldwell & Daw, Reference Caldwell and Daw1978; Vaney et al., Reference Vaney, Levick and Thibos1981). The conduction latency of orientation-selective cells to optic chiasm stimulation has been measured in 50 cells (Caldwell & Daw, Reference Caldwell and Daw1978; Vaney et al., Reference Vaney, Levick and Thibos1981) and reflects uniformly slow axonal conduction velocities. The few uniformity detectors studied (Caldwell & Daw, Reference Caldwell and Daw1978; Vaney et al., Reference Vaney, Levick and Thibos1981) have latencies to chiasm stimulation shorter than orientation-selective cells but not as short as DS cells.
The second aspect of correlation is based on the fundamentally contrast-independent responses of uniformity detectors: “all forms of stimulation (lights flashed on or off, movement of darker or lighter targets) produced a diminution … of activity” (Levick, Reference Levick1967). This contrast independence is well served by the BS dendritic organization with branching in both sublamina a and sublamina b. Because these cells also respond to fine gratings with suspension of firing, it appears that they are organized to detect an image with contrasting borders, as well as to register changes in illumination (Levick, Reference Levick1967).
Despite contrast-independent responses, pharmacological blockade of γ-aminobutyric acid (GABA) receptors by picrotoxin converted one uniformity detector into a “sustained ON-center cell” (Caldwell et al., Reference Caldwell, Daw and Wyatt1978). This evidence may seem to detract from the argument that the uniformity detector is a BS cell but could be explained by very different input to the BS2 cell dendritic tree in sublamina a compared to sublamina b. Direct bipolar cell input may predominate in sublamina b, whereas in sublamina a, more complicated circuits could be operating, involving GABA-ergic amacrine cells, for example, normally inhibiting each other and also (inhibitory) glycinergic amacrine cells, with the net result that picrotoxin blocks the OFF responses of uniformity detectors. Supporting this view is ultrastructural evidence for differential participation of amacrine cells when comparing two members of a paramorphic pair of ganglion cells, one branching in sublamina a and the other in sublamina b, with more amacrine cell synapses in sublamina a (Weber et al., Reference Weber, McCall and Stanford1991). Moreover, there is physiological and pharmacological evidence for different connectivity of ON-OFF DS (BS1) ganglion cells in sublamina a as compared to sublamina b (Taylor & Vaney, Reference Taylor and Vaney2002). Finally, the less substantial branching of BS2 cells in sublamina a may correlate with its conversion to ON responses in the presence of picrotoxin.
BS3 ganglion cells: A third type of BS ganglion cell?
Up to the present, ganglion cells with the distinctive morphology of the proposed BS3 cell, characterized here, have not been described or illustrated in rabbit retina. As the proposed type, BS3, is based on one example, confirmation is needed in the provision of more examples. The only ganglion cells thus far described with distinctively ON-OFF, contrast-independent responses in published physiological studies of rabbit retina are ON-OFF DS cells, local edge detectors, both identified morphologically, and a single (atypical) example of an orientation-selective cell with the morphology of a BS2 cell (see above) (Amthor et al., Reference Amthor, Takahashi and Oyster1989). Thus, BS3 cells, if they are a distinct type, await physiological characterization in combination with morphological identification.
Acknowledgments
I thank E. C. Siegfried, D. McGlone, B. R. Ferguson, and T. Shaw for technical assistance. This research was supported in part by P.H.S. Award R01EY03547, the Alfred P. Sloan Foundation, the Alberta Heritage Foundation for Medical Research, the Medical Research Council of Canada, and the Natural Sciences and Engineering Research Council of Canada.