Implications
Adipocyte size and number are highly correlated fatness. The identified quantitative trait loci (QTL) in this study would facilitate the identification of genes underlying adipocyte size in pigs, providing an excellent model for human obesity.
Introduction
Obesity, associated with many diseases, has become a prevalent health problem. In the pig industry, selection for increased lean meat and decreased fat deposition has been performed intensively during the past 50 years. Adiposity is correlated with adipocyte hyperplasia and hypertrophy in mammals. Moderate obesity is mainly influenced by adipocyte size; however, severe obesity is associated with increased fat cell size and number in humans (for a review, see Lau, Reference Lau2004). In pigs, the number of adipocyte per animal or per adipose organ is directly related to the body size. In mature pigs, adiposity is largely attributable to cellular hypertrophy rather than to hyperplasia (Anderson and Kauffman, Reference Anderson and Kauffman1972; Hood and Allen, Reference Hood and Allen1977).
So far, great efforts have been devoted to detect quantitative trait loci (QTL) for fatness traits by using different experimental populations. The prominent QTL for fat deposition on pig chromosomes (SSC) 1, 2, 4, 7 and X have been consistently evidenced (Knott et al., Reference Knott, Marklund, Haley, Andersson, Davies, Ellegren, Fredholm, Hansson, Hoyheim, Lundström, Moller and Andersson1998; Rohrer and Keele, Reference Rohrer and Keele1998; Wang et al., Reference Wang, Yu, Tuggle, Liu and Rothschild1998; de Koning et al., Reference de Koning, Janss, Rattink, van Oers, de Vries, Groenen, van der Poel, de Groot, Brascamp and van Arendonk1999; Marklund et al., Reference Marklund, Nyström, Stern, Andersson-Eklund and Andersson1999; Nagamine et al., Reference Nagamine, Haley, Sewalem and Visscher2003; Sato et al., Reference Sato, Oyamada, Atsuji, Nade, Sato, Kobayashi, Mitsuhashi, Nirasawa, Komatsuda, Saito, Terai, Hayashi and Sugimoto2003; Cepica et al., Reference Cepica, Bartenschlager and Geldermann2007; Liu et al., Reference Liu, Jennen, Tholen, Juengst, Kleinwächter, Hölker, Tesfaye, Un, Schreinemachers, Murani, Ponsuksili, Kim, Schellander and Wimmers2007), and the quantitative trait nucleotide underlying the QTL on SSC2 has been explicitly characterized in intron 3 of insulin-like growth factor 2 (van Laere et al., Reference van Laere, Nguyen, Braunschweig, Nezer, Collette, Moreau, Archibald, Haley, Buys, Tally, Andersson, Georges and Andersson2003). These results improved the understanding of the genetic basis of fat deposition in pigs. However, QTL for adipocyte size and number in pig fat tissues remain unexplored.
Erhualian is a Chinese indigenous pig breed that is characterized for obesity, prolificacy and good meat quality (Zhang et al., Reference Zhang, Li and Chen1986). White Duroc is a commercial composite boar line having desirable growth performance and lean meat production. The objective of this study was to identify QTL for adipocyte size and number using a whole-chromosome scan in a three-generation White Duroc × Erhualian resource population.
Material and methods
Animals
A three-generation F2 population was established by a cross between Chinese Erhualian and White Duroc pigs as described in Ren et al. (Reference Ren, Ren, Xing, Guo, Wu, Yang, Mao and Huang2008). Briefly, two White Duroc boars and 17 Erhualian sows were mated to produce F1 pigs, from which nine F1 males and 59 F1 females were intercrossed to produce six batches of 1912 F2 pigs. In this assay, a total of 341 F2 animals from the fourth to sixth batches were slaughtered at 240 days for phenotype recording.
Trait measurements
Approximately 10 g of abdominal fat was collected from the left-side carcass of each F2 animal within 30 min post mortem and frozen in liquid nitrogen immediately. Frozen sections were made from 1 × 1 × 1 cm3 abdominal adipose tissues with a CM1850 freezing microtome (CM1850; Leica, Solms, Germany) following the manufacturer’s instruction. The frozen cut sections were stained through haematoxylin and eosin in a routine way. A Leica DMR electronic microscope (Leica, Wetzlar, Germany) was employed to observe adipose cells at 100× magnification. For each individual the cellular area and perimeter were measured (and averaged) from 300 fat cells by using Leica Qwin version 3.5 (Leica, Wetzlar, Germany). The average cellular diameter  for each animal was calculated based on the area of adipocyte. Following an approach described previously (Sjöström et al., Reference Sjöström, Björntorp and Vrána1971), the average adipocyte volume in each specimen was determined through the formula of
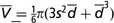 , where s is the standard deviation of
 . The total cell numbers were calculated according to the equation:
 , where W is the weight of abdominal adipose tissue.
Genotyping
Genomic DNA was extracted from pig ear tissues using a standard phenol/chloroform method. All DNA samples were quantified with a DU640 spectrophotometer (Beckman, California, USA) and diluted to a standardized concentration of 20 ng/μl in 96-well plates. Microsatellite markers were initially chosen from the USDA-MARC linkage map (http://www.animalgenome.org/maps/marcmap.html) to genotype all F1 animals in the White Duroc × Erhualian intercross. A final set of 183 informative and easy-scoring markers covering 19 porcine chromosomes was then used for the whole-genome scan across the entire resource population. The information content of each marker was more than 0.5. As described previously (Ren et al., Reference Ren, Ren, Xing, Guo, Wu, Yang, Mao and Huang2008), amplification condition for each marker locus was optimized by using standard protocols. After amplifications with primers labeled by fluorescent dyes (NED, FAM or HEX), genotype data were recorded and collected in an ABI PRISM® 3130XL genetic analyzer with GeneMapper™ Genotyping version 3.7 (Applied Biosystems, Foster City, USA).
Statistics
Phenotypic values of adipocyte number were log transformed before analysis to approximate the normal distribution. The QTL analysis was performed with the web-accessible QTL Express at http://qtl.cap.ed.ac, which is based on a least-squares regression approach (Haley et al., Reference Haley, Knott and Elsen1994). This analysis assumed that QTL alleles (Q or q) were alternatively fixed in the two founder breeds: White Duroc and Erhualian. The probabilities of alleles for each individual in the F2 generation at every centimorgan (cM) throughout the genome were calculated based on flanking informative markers. A multiple linear regression model was used as follows:

where Y is the phenotype value of the F2 population; μ is the overall mean; sex and batch were considered as fixed effects. The body weight at 240 days was used as Covariate. α and d are the additive and dominant effects of a putative QTL, respectively. Ca and Cd are the coefficients of the additive and dominant effects and e is the residual error. The two-QTL model analysis was further performed along SSC7, which showed two-peak profiles for adipocyte size traits in the one-QTL model analysis.
The confidence intervals (CI) of QTL were estimated by a bootstrap method with 1000 iterations (Visscher et al., Reference Visscher, Thompson and Haley1996). Genome-wide significance thresholds were directly determined by 1000 permutation tests as described previously (Churchill and Doerge, Reference Churchill and Doerge1994). The 5% chromosome-wide significant level was treated as the suggestive significant level, which was obtained from the following formula:

where r is the proportion of total genome length attributed to the chromosome (de Koning et al., Reference de Koning, Janss, Rattink, van Oers, de Vries, Groenen, van der Poel, de Groot, Brascamp and van Arendonk1999). The percentage of phenotype variances explained by QTL was calculated by the formula below:

where MSfull, MSreduce1 and MSreduce were the residual mean square (MS) of the model with all detected QTL, with the rest detected QTL except for a given one and without all detected QTL, respectively.
Results and discussion
Phenotypic data
Descriptive statistics of the phenotype measured are shown in Table 1. All phenotypic data conform to the skew distribution and showed remarkable segregation in the F2 population, reflecting phenotypically and genetically original differences between the grandparents of the resource population. This makes the experimental population suitable to identify genomic regions affecting adipocyte size and number. High correlations (r > 0.40, P < 0.001) were observed among traits related to adipocyte size (area, perimeter and volume) and other fatness traits including backfat thickness and abdominal fat weight (data not shown).
Descriptive statistics of the traits measured in the F2 population of the White Duroc × Erhualian intercross

Detection of QTL
A whole-genome linkage map comprising 183 microsatellite markers was constructed with a total length of 2350.3 cM and an average marker interval of 12.84 cM. The marker orders were consistent with the USDA-MARC reference map (data not shown).
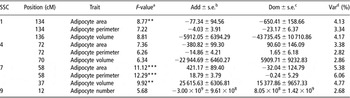
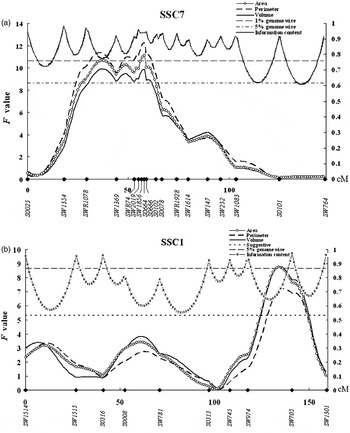
A total of 10 QTL including four at the genome-wide level and six at the suggestive level were found for adipocyte size and number on SSC1, 4, 7 and 9 in the White Duroc × Erhualian intercross (Table 2), and F-statistic curves for genome-wide significant QTL on SSC1 and SSC7 are shown in Figure 1. To our knowledge, neither of these QTL has been reported before this study. The area, perimeter and volume of adipocyte are highly correlated as indicators of adipocyte size. Accordingly, QTL for the three traits were always detected in the same regions, including those on SSC1, 4 and 7.
Details of quantitative trait loci (QTL) for adipocyte size and number detected in the White Duroc × Erhualian cross

aSignificant levels: **5% genome-wide significant level; ***1% genome-wide significant level.
bAdditive effects and their standard errors.
cDominant effects and their standard errors.
dPercentage of the phenotypic variance explained by QTL.
Plots of statistical F-values indicating significant QTL for adipocyte size and number on SSC7 (a) and SSC1 (b). Markers and distance in cM are given on the x-axis, and F-ratios are indicated on the left y-axis. The marker information content along each chromosome is also shown in this figure. Thresholds for the suggestive, 5% and 1% genome-wide significant levels are indicated by dashed, solid and double solid horizontal lines, respectively.

Chromosome 7 showed the most significant association with adipocyte perimeter (F = 12.29) and area (F = 11.12) at 58 cM, and another 5% genome-wide significant QTL for adipocyte volume was detected at a different position (37 cM) on this chromosome (Figure 1a). At these loci, the White Duroc allele increased the phenotypic values. We noticed that the QTL profile showed two peaks on this chromosome, indicating that there could be two distinct and significant QTL affecting adipocyte size on SSC7. However, this assumption was not confirmed by the two-QTL model analysis, which did not show significant evidence for the existence of two QTL on this chromosome (data not shown). We then checked the polymorphic information content of each marker on SSC7 and found that the two-peak profile could be caused by lower information content at this position (Figure 1a). SSC7 is of particular interest to the pig industry for harboring numerous QTL affecting economically important traits. The region of QTL for adipocyte size has been consistently evidenced as QTL for backfat thickness in different experimental populations (Rohrer and Keele, Reference Rohrer and Keele1998; Wang et al., Reference Wang, Yu, Tuggle, Liu and Rothschild1998; de Koning et al., Reference de Koning, Janss, Rattink, van Oers, de Vries, Groenen, van der Poel, de Groot, Brascamp and van Arendonk1999; Bidanel et al., Reference Bidanel, Milan, Iannuccelli, Amigues, Boscher, Bourgeois, Caritez, Gruand, Le Roy, Lagant, Quintanilla, Renard, Gellin, Ollivier and Chevalet2001; Liu et al., Reference Liu, Jennen, Tholen, Juengst, Kleinwächter, Hölker, Tesfaye, Un, Schreinemachers, Murani, Ponsuksili, Kim, Schellander and Wimmers2007), and is homologous to the QTL for body mass index in humans (Norman et al., Reference Norman, Bogardus and Ravussin1995). We observed an interesting phenomenon that the favorable allele decreasing adipocyte size originates from the Erhualian breed at the QTL, which is contrary to the breed characteristic difference in this trait. This observation has been repeatedly documented in many QTL for other traits around this region (Bidanel et al., Reference Bidanel, Milan, Iannuccelli, Amigues, Boscher, Bourgeois, Caritez, Gruand, Le Roy, Lagant, Quintanilla, Renard, Gellin, Ollivier and Chevalet2001; Milan et al., Reference Milan, Bidanel, Iannuccelli, Riquet, Amigues, Gruand, Le Roy, Renard and Chevalet2002; Rothschild et al., Reference Rothschild, Hu and Jiang2007). The reason for it remains unknown. Although many QTL have been consistently evidenced in the region, it is hard to confirm whether these QTL were due to multiple effect of a single locus or effects of closely linked genes for the high density of genes in this region.
We identified a 5% genome-wide significant QTL for the adipocyte area at 134 cM on SSC1 (Figure 1b). At this locus, the Erhualian allele was associated with a larger area of adipocyte and showed an overdominant effect, explaining 4.13% of the phenotypic variance. This region also showed the suggestive effects on adipocyte perimeter and volume (Figure 1b). As on SSC7, the QTL region associated with adipocyte size on SSC1 corresponds to previously reported QTL for backfat thickness (Rohrer and Keele, Reference Rohrer and Keele1998; de Koning et al., Reference de Koning, Janss, Rattink, van Oers, de Vries, Groenen, van der Poel, de Groot, Brascamp and van Arendonk1999; Bidanel et al., Reference Bidanel, Milan, Iannuccelli, Amigues, Boscher, Bourgeois, Caritez, Gruand, Le Roy, Lagant, Quintanilla, Renard, Gellin, Ollivier and Chevalet2001; Milan et al., Reference Milan, Bidanel, Iannuccelli, Riquet, Amigues, Gruand, Le Roy, Renard and Chevalet2002; Sanchez et al., Reference Sanchez, Riquet, Iannuccelli, Gogué, Billon, Demeure, Caritez, Burgaud, Fève, Bonnet, Péry, Lagant, Le Roy, Bidanel and Milan2006). The co-localization of QTL for adipocyte size and backfat thickness shows that there are genetic factors simultaneously affecting the two traits related to fat deposition in those chromosomal regions. Moreover, several significant QTL for average daily gain have been detected at position close to the QTL for adipocyte size on this chromosome (Sanchez et al., Reference Sanchez, Riquet, Iannuccelli, Gogué, Billon, Demeure, Caritez, Burgaud, Fève, Bonnet, Péry, Lagant, Le Roy, Bidanel and Milan2006).
Suggestive effects were evidenced for adipocyte size (the area, perimeter and volume of adipocyte) in a similar region (70–72 cM) on SSC4, and the alleles increasing the phenotypic values were inherited from the Erhualian breed. This region has also been characterized as QTL for backfat thickness and abdominal fat (Marklund et al., Reference Marklund, Nyström, Stern, Andersson-Eklund and Andersson1999; Bidanel et al., Reference Bidanel, Milan, Iannuccelli, Amigues, Boscher, Bourgeois, Caritez, Gruand, Le Roy, Lagant, Quintanilla, Renard, Gellin, Ollivier and Chevalet2001; Varona et al., Reference Varona, Ovilo, Clop, Noguera, Pérez-Enciso, Coll, Folch, Barragán, Toro, Babot and Sánchez2002), subcutaneous fat depth (Marklund et al., Reference Marklund, Nyström, Stern, Andersson-Eklund and Andersson1999), average daily gain (Wang et al., Reference Wang, Yu, Tuggle, Liu and Rothschild1998; Walling et al., Reference Walling, Archibald, Cattermole, Downing, Finlayson, Nicholson, Visscher, Walker and Haley1998 and Reference Walling, Visscher, Andersson, Rothschild, Wang, Moser, Groenen, Bidanel, Cepica, Archibald, Geldermann, de Koning, Milan and Haley2000), body weight (Bidanel et al., Reference Bidanel, Milan, Iannuccelli, Amigues, Boscher, Bourgeois, Caritez, Gruand, Le Roy, Lagant, Quintanilla, Renard, Gellin, Ollivier and Chevalet2001) and carcass weight (Cepica et al., Reference Cepica, Stratil, Kopecny, Blazkova, Schröffel, Davoli, Fontanesi, Reiner, Bartenschlager, Moser and Geldermann2003). The multiple associations with these genetically correlated traits could support evidence of the QTL for size of adipocyte in this region.
In this study, we did not identify the genomic regions significantly associated with adipocyte number. This could be caused by the fact that the expansion of adipose tissues was accompanied exclusively by cellular hypertrophy in adults (Anderson and Kauffman, Reference Anderson and Kauffman1972; Hood and Allen, Reference Hood and Allen1977). We collected abdominal fat samples from 240-day F2 animals, and the difference in fat deposition of these animals is mainly attributable to different adipocyte size rather than to adipocyte number. We observed that the leaner pigs did not contain more adipose cells than the fatter pigs (data not shown).
In summary, we detected novel QTL predominantly for adipocyte size in abdominal fat in the White Duroc × Erhualian intercross, and the Duroc alleles were not systematically associated with reduced adipocyte sizes. The QTL detected generally correspond to the previously reported QTL for other fatness traits on SSC1, 4 and 7. These results contribute to the understanding of the genetic basis of fatness traits in pigs.
Acknowledgements
This study is financially supported by the National Natural Science Foundation of China (30425045) and the National 973 Program of China (2006CB708213).