


I. INTRODUCTION
A phase shifter is a key element whose bandwidth commonly represents the bottleneck of T/R modules used in modern antenna phased arrays (APAs) for electronic warfare (EW) applications [Reference Diciomma, Ciacia, Giolo, Baccello, Orobello and Alleva1]. Moreover, when an active phased array capable of transmitter/receiver (T/R) function is required, a reciprocal phase shifter (PS) is desirable in order to simplify the T/R architecture, avoiding “common leg” architecture. Many solutions have been investigated in scientific literature to develop PS MMICs as illustrated in Table 1, where the classical topologies are sorted by bandwidth performance. Group “A” topologies, studied in [Reference Garver and Robert12] offers reciprocity but they have limited bandwidth, for this reason they are not suitable for wideband applications. The “B” group topologies are reciprocal and able to reach around two octaves bandwidth; nevertheless they are generally based on Lange couplers, which are difficult to integrate when operative frequency falls below 1 GHz. Group “C” topologies are used when the bandwidth becomes ultra large, starting from relative low frequencies, they are suitable for EW applications in the communication bandwidth below 2 GHz; most of them use active components, which imply the need of power supply and offer a non-reciprocal response. Reflection type PS with active circulators is another approach used in wideband MMIC; the active element synthesis allows to overcome the bandwidth limitation of the classical Lange coupler used as reflectometer [Reference Lucyszyn and Robertson8]. Another topology, mostly used in SiGe design, where lumped elements approach is preferred, is to realize a PS using an active vector modulator, composed by poly-phase filters or quadrature all-pass filters (APF), to obtain four orthogonal vectors to be amplitude modulated with variable gain amplifiers and then recombined [Reference Koh and Rebeiz9]. Another approach is to cascade several APF in order to obtain an ultra large bandwidth. The drawback of this approach is represented by the high insertion loss. For this reason the PS presented in paper [Reference Duême, Dequen, Funck, Caillon and Guerbeur11] makes use of amplifiers to limit the insertion loss. An interesting variation, demonstrated in hybrid technology, consists of using APF with both low pass filters (LPF) and high pass filters (HPF) [Reference Tang and Mouthaan13]. Another approach [Reference Pagani, Marpaung and Eggleton14] consists of operating the phase shifting in the optical domain using stimulated Brillouin scattering based phase shifters. To perform such function, it is necessary to properly modulate the radio frequency (RF) signal into optical domain and demodulate it back to RF. The obtained performance is very impressive in terms of bandwidth (1.5–31 GHz) and determines low phase and amplitude errors, unfortunately the technology leads to a non-compact solution if compared with a monolithic microwave integrated circuit (MMIC). The papers [Reference Tang and Mouthaan13, Reference Pagani, Marpaung and Eggleton14] have not been inserted in the table because they have not been demonstrated in MMIC realization. In this paper, for the first time at the best knowledge of the authors, a full passive and reciprocal MMIC 4-bit PS with 1 decade of bandwidth from 0.8 to 8 GHz is presented and is also demonstrated that LPF is not strictly necessary to achieve broadband performance if compared with [Reference Tang and Mouthaan13].
MMIC phase shifter topology versus bandwidth.

Since this work presents a PS with B > 2, the comparison with the “state of art” will be limited to the works listed in group C, Table 1.
The Reflection type with active circulators [Reference Lucyszyn and Robertson8] is a quite attractive architecture in terms of phase error (±2.1° for a 85° phase shift), nevertheless the information provided in the paper is not sufficient for a full comparison for higher phase shifts (337.5°). The most important difference is the active nature of the architecture, which can provide a low insertion loss, unfortunately the non-reciprocity is an important drawback, which make this architecture unusable in the application the PS presented in this paper was designed for.
Active vector modulators architecture [Reference Koh and Rebeiz9, Reference Zijie and Mouthaan10] is typically used in CMOS and SiGe, where the use of active components is preferred above passive components. This aspect leads to highly integrated, but non-reciprocal phase shifters. Moreover, a vector modulator phase shifter has no digital steps, because it is intrinsically analog, for this reason it needs a digital to analog converter to synthesize a desired phase step. The obtained performance are good in both [Reference Koh and Rebeiz9], where a 15° RMS phase error has been presented in the frequency range from 6 to 20 GHz, and [Reference Zijie and Mouthaan10], where 7° RMS have been demonstrated in the frequency range from 0.5 to 6 GHz.
APF with buffers architecture [Reference Duême, Dequen, Funck, Caillon and Guerbeur11] is quite similar to the one presented in this paper, in fact both PS use two all pass cells to provide the desired phase shift. Nevertheless, in [Reference Duême, Dequen, Funck, Caillon and Guerbeur11] there is no use of high pass compensation (which is discussed in the presented paper); for this reason, phase performance is apparently poor, below 1 GHz. Furthermore, the architecture [Reference Duême, Dequen, Funck, Caillon and Guerbeur11] makes use of active cells, which provides a lower insertion loss; unfortunately, the non-reciprocity, represent an unacceptable drawback for the application mentioned in the presented paper.
After this overview on the traditional design approach, Section II will introduce the novel methodology, while Section III is devoted to the presentation of the design and measured results, confirming the effectiveness of the proposed strategy. In Section IV the conclusions have been presented.
II. NOVEL DESIGN APPROACH
The proposed phase shifter is based on APF networks, which are very suitable since they theoretically have a frequency independent amplitude response.
In Fig. 1, two common APF topologies are depicted. A proper choice of L and C values allows to provide the desired phase shift and maintain the impedance matching at the same time. Both topologies can be designed using (1), where Z 0 is the characteristic impedance and ω 0 is the “transition frequency” at which a 180° phase shift occurs.
 $${\left\{ \matrix{Z_0 = \sqrt {\displaystyle{L \over C}} \hfill \cr \omega _0 = \displaystyle{1 \over {\sqrt {LC}}} \hfill} \right.}. $$
Common APF topologies.

The desired phase shift, as observed in [Reference Adler and Popovich15], can be obtained as difference between two APFs phase versus frequency response, tuned at different transition frequencies: ω 0i and ω 0i , for APFi and APFi’, respectively, as shown in Fig. 2.
PS cell with single APF.

An example of a 22.5° ideal PS cell response, composed by a single stage APF, is visible in Fig. 3 where a low phase error – defined as the difference between nominal and actual phase – can be granted on a narrow band centered on the ω i frequency, according to (2).
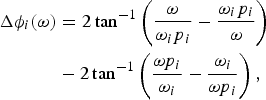 $$\eqalign{\Delta \phi _i (\omega ) &= 2\tan ^{ - 1} \left( {\displaystyle{\omega \over {\omega _i p_i}} - \displaystyle{{\omega _i p_i} \over \omega}} \right) \cr & - 2\tan ^{ - 1} \left( {\displaystyle{{\omega p_i} \over {\omega _i}} - \displaystyle{{\omega _i} \over {\omega p_i}}} \right),} $$
A 22.5° cell response with single stage APFs. Insertion phase on the left and phase error on the right.

where the transition frequency of each APF is defined according to (3).
 $$p_i = \displaystyle{{\omega _{0i}} \over {\omega _i}} = \displaystyle{{\omega _i} \over {\omega '_{0I}}}. $$
In order to extend the PS bandwidth, assuming a ±10° maximum error as goal, it is possible to use two cascaded APFs with a proper frequency shift, as discussed in [Reference Adler and Popovich15] and shown in Figs 4 and 5.
PS cell with two cascade APFs.

A 22.5° cell response with double stage APFs. Insertion phase on the left and phase error on the right.

More than two cascaded cells can be employed to further extend the bandwidth, unfortunately, the higher the number of APFs, the bigger the area occupation and insertion loss. Furthermore, since every APF phase response tends to be zero at low frequency, the corresponding phase difference tends to be zero as well, making the phase shifter unusable in that frequency region; increasing the APFs number, does not effectively solve this problem, as highlighted in Fig. 6.
Low Frequency issue of single and two stages PS cells.

In order to compensate the low frequency limitation it is possible to insert a HPF, whose cut-off frequency shall be accurately selected to improve the low frequency response, leaving the high frequency behavior unaltered. Such HPF can be placed in the cell as indicated in Fig. 7, where APF1 represents the reference state. The cut-off frequency selection presents another drawback that must be kept into account: the higher the phase boost, the higher the amplitude drop, due to the filtering action.
PS cell with single stage APFs and HPF phase equalizer.

As visible in Fig. 8, the HPF solved the low frequency issue with no relevant effect at high frequency.
A 22.5° cell response with single stage APFs and HPF. Insertion phase on the left and phase error on the right (dashed line “before”, dotted line “after” compensation).

As final step it is possible to improve the overall performance using a CAD optimization, as shown in Fig. 9.
Phase error of a 22.5° cell with single stage APFs and HPF (dotted line “before”, solid line “after” optimization).

This solution provides an extension of the phase shifter bandwidth at low frequency, maintaining the number of APFs as little as possible; it can be also extended to realize larger phase steps which would require several APF stages as presented in [Reference Duême, Dequen, Funck, Caillon and Guerbeur11].
III. PHASE SHIFTER DESIGN AND MEASURED RESULTS
A broadband 4-bit phase shifter has been designed, realized, and tested. The PS block diagram is shown in Fig. 10.
PS block diagram.

There are four cells which provide 22.5°, 45°, 90°, and 180° shift and an absorptive single pole double throw (SPDT) switch. The PS cell controls are: 0 V and −2.5 V. In order to compensate the low frequency limitation, two different types of phase equalizers have been adopted. The 22.5° and 45° cells are based on a single stage APF with the addition of two series capacitor, as depicted in Fig. 11 (top), while the 90° and 180° cells are based on a double stage APF with the addition of a T shape-HPF, as shown Fig. 11 (down).
Phase equalizers used for 22.5° and 45° cells (top) and for 90° and 180° cells (bottom).

Both HPF choices have been made taking physical and electrical symmetry into account. Furthermore, in order to keep every PS cell size as little as possible, a planar transformer solution has been adopted for every APF. The transformer is used as substitute of the “uncoupled” pair of inductance, suggested on the right of Fig. 1.
Since mutual coupling should be taken into account, the transformer substitution requires an extension of the design equations [Reference Duême, Dequen, Funck, Caillon and Guerbeur11]. The 22.5° cell is presented as example in Fig. 12 (left), the planar transformer discussed before is clearly visible in both paths, as well as the two series capacitors placed in the upper path.
Microphotograph of the fabricated PS 22.5° test cell (1.6 × 3.7 = 6 mm2) on the left and fabricated absorptive SPDT test cell (4.3 × 1.3 = 5.6 mm2) on the right.

In Fig. 13, a comparison between electromagnetic (EM)-simulated and measured performance of the single 22.5° cell is depicted in Fig. 12 (left). The results show a good match between the simulation and obtained measurements.
EM-simulated (blue line) and measured performance (red line) comparison of the single test cell 22.5° step.

At the end of the phase shifter, there is an high isolation, absorptive SPDT switch, which has been designed and tested in a test cell depicted in Fig. 12 (right). Both switch paths are composed by a series field effect transistor (FET) followed by two FETs in shunt connection. Each path ends with the circuitry shown in Fig. 14, which provides the 50 Ω matching when the series FET is open and the parallel FETs are shunted.
Last section switch implementation detail.

In Fig. 15, there is a comparison between EM-simulated and measured performance of the single SPDT absorptive switch test cell, depicted in Fig. 12 (right). The results show a good match between the simulation and obtained measurements.
EM-simulated (blue line) and measured performance (red line) comparison of the absorptive SPDT test cell.

Since the switch is designed to be absorptive, it is important to note the good return loss all over the operating bandwidth, in both on and off states.
When cascaded, each cell is loaded by the adjacent ones, exhibiting different input/output impedance; in this condition the single cell behavior will be different from the expected behavior on 50 Ω terminations, causing undesired phase errors.
A common way to overcome this problem consists in trying to re-center the chain performance by using optimization or tuning tools provided by any microwave CAD environment. The above mentioned approach however is not always viable, due to the overall design complexity and the resulting resource demand in terms of simulation time. In this case the cell sequence (Fig. 10) has been determined using the algorithm proposed in [Reference Bentini, Ferrari, Ciccognani and Limiti16].
In Fig. 16 the insertion gain and amplitude error over all phase shifter steps is presented. The insertion gain contains the contribution of the SPDT switch insertion loss (Fig. 15).
Measured insertion gain (left) and amplitude error (right) over all the phase states.

The insertion loss of the switch is around 1.8 dB at 8 GHz, due to the absorptive topology that requires an additional switch element at the end of each leg of the switch. The phase shifter insertion loss without the switch is around 12 dB at 8 GHz.
As visible in Fig. 16, at low frequency there is an amplitude cut-off introduced by the HPF. The PS return loss at RF1 and RF2 port is shown in Fig. 17.
Measured S(1,1) and S(2,2) [dB] over all the phase states.

The phase performance is presented in Fig. 18.
Measured Delta Phase steps with respect to 0° (reference step).

The RMS Phase error, with respect to the nominal phase step, is shown in Fig. 19
Measured RMS Phase Error with respect to the phase step.

The measured phase performance – in terms of peak to peak (Fig. 18) error – is less than ±20° in the full operating bandwidth, considering 180° step as reference. In the worst case (all cells activated), the measured performance in terms of RMS error (Fig. 19) is slightly less than 29°. On the contrary, the elementary phase steps are below 12.5° RMS phase error.
The PS should be characterized in terms of phase settling time (defined from the 50% of the control signal voltage to the 90% of output required phase). For practical purpose the measure has been performed analyzing the amplitude response, assuming that either of the phases and amplitude of output signal take the same time to settle at 90% of their steady state value. Figure 20 shows the way the measurement should be read: the settling time has been measured using a two channels oscilloscope, where CH1 is dedicated to the control signal (trigger on the rising edge) while CH2 is connected to a negative voltage power detector.
Settling time measurement criteria for 0°→ϕ′° transition.

The test fixture in Fig. 22 has been driven by an interface board, which adds an additional 10 ns delay, which should be subtracted from the results showed in Fig. 21. Compared with the expected use of the presented phase shifter, the settling time is fully compliant with the application requirement: in fact, in a T/R module used for a EW application, it is necessary to keep the amplitude settling time below 60 ns; such time is typically determined by the final power stages of the transmission chain. Same considerations apply to the phase settling time anyway – its strict relation with the amplitude response – guarantees that the phase performance is stable within 60 ns.
Settling time measurement for the fundamental steps transitions.

Photograph of the fabricated PS (4.4 × 8.5 = 37 mm2) on the left and the test fixture used to validate the PS design provided by UMS on the right.

A photograph of the fabricated PS is shown in Fig. 22. As first prototype, particular attention was paid to limit EM coupling between cells as much as possible, this inevitably led to a bigger size; since there is room for improvement, there is a concrete possibility to reduce the chip area on a second design, to be used in production.
In [Reference Duême, Dequen, Funck, Caillon and Guerbeur11], the MMIC phase shifter has been divided into two parts, this solution guarantees yield improvements but does not reduce the large area occupation.
IV. CONCLUSION
A broadband PS based on APF and HPF filters has been designed, using a reduced number of APFs and avoiding the use of LPFs, in order to decrease the insertion loss and keep MMIC size as little as possible. Due to the reciprocity requirement, no amplifiers have been used. The PS has been fabricated using a GaAs 0.25 PHEMT process in order to provide less than 13 dB insertion loss, less than ±20° phase error (considering 180° step as reference) and less than ±2.5 dB amplitude error in the 0.8–8 GHz bandwidth. The phase shifter settling time is below 20 ns. Provided results show a very good agreement between simulation and measurement, such achievement fully satisfies the T/R module broadband requirements for EW applications.
ACKNOWLEDGEMENTS
First acknowledgment goes to ELT S.p.A., which supported the whole research activity. The authors would also like to thank Giulio Cesare Grande (ELT) for his expertise, and Eric Leclerc (UMS foundry), for the support provided on the UMS process design kit.
 Mauro Ferrari was born in Rome, Italy, in 1981. He received his B.Sc. and M.Sc. degrees in Electronic Engineering in 2003 and 2006, respectively and he received his Ph.D. in Telecommunications and Microelectronics in 2010 at the University of Rome “Tor Vergata”. At the moment he is a Microwave Engineer at Elettronica S.p.a. His research interests are in analysis and design of advanced microwave and millimeter-wave MMICs designed on GaAs, GaN, and novel high-performances materials.
 Luca Piattella was born in Tivoli, Italy, in 1980. He received his Master's Degree in Electronic Engineering (“Electronic Systems for Telecommunications” specialization) in early 2008. He started working in Italy on high power jammers for EW application then had work experience in RF Power transistors design for NXP Semiconductors. He is actually working as Microwave Engineer for Elettronica S.p.A. in Rome. His research interests are in design and development of advanced microwave transmitting-receiving modules, based on the most recent and performing technologies.



