I. INTRODUCTION
ZnO is a material of interest for many applications. Its deep exciton binding energy makes it attractive for ultraviolet (UV) lasers and light-emitting diodes (LEDs), and its surface reactivity and piezoelectric properties make it useful for gas sensors and transducers.Reference Özgür, Hofstetter and Morkoç1 There are many fine reviews concerning ZnO,Reference Özgür, Alivov, Liu, Teke, Reshchikov, Doğan, Avrutin, Cho and Morkoç2 its electrically active impurities and defects,Reference Look3, Reference Janotti and Van de Walle4 as well as its processing and doping.Reference Pearton, Norton, Ip, Heo and Steiner5 Of particular interest is the difficulty of p-type doping.Reference Avrutin, Silversmith and Morkoç6 Challenges in binary doping are commonly encountered in wide band gap materials. While Schottky and heterojunction devices have been possible for some time, ZnO homojunction LEDs remain in their infancy.Reference Choi, Kang, Hwang and Park7
The ability to characterize both n-type and p-type doping with certainty is of value. Additionally, an understanding of carrier transport is useful in general for the fabrication of devices. Carrier mobility in ZnO and its magnetotransport characterization will be reviewed. Particular attention will be paid to the nature of the surface conductivity channels on the various faces of ZnO, as this can be a major obstacle to the understanding of the electronic properties of ZnO if not properly accounted for.
II. SURFACE CONDUCTIVITY
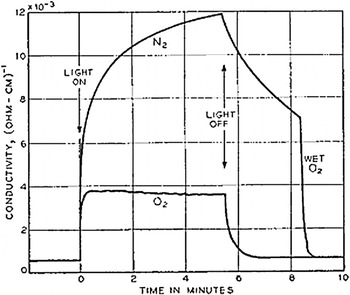
It has long been known that ZnO can exhibit a surface conducting layer with a sheet conductivity on the order of 10−4 Ω−1. It is created or exposed by heating above 500 K in vacuum or inert gasReference Schmidt, Kiesel, Van de Walle, Johnson, Nause and Döhler8 or by exposure to above band gap UV without heating. Exposure to oxygen, particularly in the presence of humidity, quenches this conducting layer, as shown in Fig. 1. The adsorbed oxygen atoms were believed to act as acceptors, creating a negative surface charge layer of trapped electrons, inducing a depletion region near the surface of a typical n-type crystal and decreasing the conductivity. The size of the depletion region alone is not enough to account for this drop in conductivity, which is measurable even when the thickness of the sample is much greater than that of any depletion region. Rather, some highly conducting surface layer is eliminated or masked by the oxygen.Reference Collins and Thomas9 Heat or UV exposure was found to thermally desorb or photodesorb oxygen through photogenerated holes.Reference Shapira, Cox and Lichtman10
The photoconductivity of ZnO single crystal in 1 atm of O2 or N2 when illuminated with 170 μW/cm2 of 313 nm radiation from a mercury arc lamp. Humid oxygen causes a more rapid decay. Reprinted with permission from Ref. Reference Collins and Thomas9. (Copyright 1958 by the American Physical Society.)

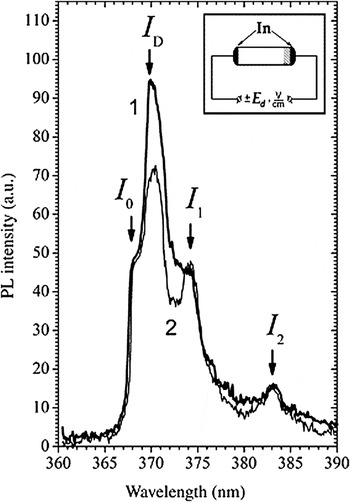
The layer may result from defects such as oxygen vacancies with a higher density near the surface, perhaps created there by ambient illumination. UV exposure was found to produce defects with an Electron Paramagnetic Resonance (EPR) signal identical to that produced by CO exposure and subsequent CO2 desorption.Reference Göpel and Lampe11 Yet it is possible that negatively charged adsorbed oxygen can cause preexisting positively ionized donors from the bulk to accumulate near the surface, forming a conducting layer, which can be detected when the oxygen is later desorbed. Preexisting unintentional background donors in ZnO are mobile under the influence of an electric field, as was demonstrated by tracking the changes in photoluminescence (PL) intensity of a shallow donor-bound exciton after voltage is applied on a nearby electrode.Reference Markevich, Kushnirenko, Borkovska and Bulakh12 We see in Fig. 2 that the line ID, associated with n-type impurities such as Ga, Al, and H,Reference Look, Christen, Jagadish, Look, Yao and Bertram13 can move under the influence of an applied voltage.
Donor-bound exciton (I D) luminescence spectra of ZnO single crystal at 77 K measured for the same sample region on an m-plane face near an indium electrode. (i) After the action of an applied 50 V/cm electric field at 600 K while the adjacent electrode acted as the cathode or (ii) while it acted as the anode. Reprinted from Ref. Reference Markevich, Kushnirenko, Borkovska and Bulakh12 with permission from Elsevier.

The donors that are drawn toward the surface may be defects, or they may be impurities such as hydrogen, which is likely to be a mobile donor. The hydrogen possibility is suggested by the presence of the O–H bond in x-ray Photoemission Spectroscopy (XPS), with a fractional coverage, which increases along with the surface conductivity during annealing in inert gas. Electron irradiation with a 1-MeV beam reduced the surface conduction, which is also consistent with near-surface accumulation of H donors.Reference Look, Mosbacker, Strzhemechny and Brillson14 Alternatively, group III impurities (Al, In, Ga) were found via Secondary Ion Mass Spectroscopy (SIMS) to segregate at the surface during 900 K anneals. The concentration, 5 × 1013 cm−2, corresponded to the apparent surface concentration found with Hall measurements at 20 K where the bulk electrons should have been frozen out.Reference Look, Claflin and Smith15 This SIMS study, unlike the others in this section, was specified to have occurred on the polar surfaces of ZnO, which will be covered shortly.
Under normal conditions, UV exposure desorbs oxygenReference Shapira, Cox and Lichtman10 and leaves a detectable conducting layer, which slowly decays with oxygen readsorption. Yet it appears that the surface conductivity can be virtually eliminated by annealing at 750 K, providing a brief UV exposure to desorb oxygen, and then rapidly cooling in an inert atmosphere. After cooling, the conducting layer does not return, with or without oxygen exposure. It was suggested that the conducting surface layer must first be created near room temperature by oxygen adsorption and donor attraction before it can be exposed by oxygen desorption at a later time.Reference Markevich, Kushnirenko, Borkovska and Bulakh12 Interestingly, this process of eliminating the surface conductivity also results in a decrease in overall photoconductive response. It was suggested that there are near-surface sensitizing centers, which have a greater effect when the near-surface electron density is high.Reference Markevich, Kushnirenko and Bulakh16 That is, there may be near-surface acceptor-like recombination centers with a capture cross section, which is very asymmetric with carrier type.Reference Rose17 Although, this overall decrease in photoconductive response could be due instead to the new lack of surface conductivity to expose through photodesorption of oxygen.
III. POLAR SURFACES
When a crystal face was specified, the aforementioned surface studies were generally performed with the m-plane surface exposed, often on the sides of hexagonal needle-shaped crystals. The two polar surfaces may display some differences in behavior.
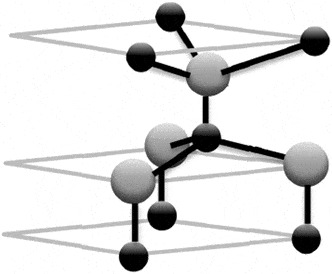
The hexagonal close-packed (HCP) lattice is formed from stacked planes of hexagonally arranged lattice points, where even-numbered planes are positioned so that their points each have three nearest neighbors with the odd-numbered plane beneath. These stacked pairs of planes repeat, and the c-axis is normal to the planes. Wurtzite ZnO consists of a HCP lattice with a basis of ZnO molecules arranged so that the Zn–O bond lies along the c-axis. This structure lacks inversion symmetry; the direction leading along a bond from Zn to O is considered the positive c-axis. When the crystal terminates along this direction, the resulting face is a Zn-polar or (0001) surface. A termination occurring in the opposite direction is an O-polar surface (Fig. 3).
The wurtzite structure of ZnO. The black spheres represent Zn, and the gray spheres represent O. The top surface represents the Zn-polar face, and the bottom surface represents the O-polar face.

A plane normal to the c-axis that coincides with a row of nearest neighbor lattice points in a c-plane is known as an m-plane ( ) surface. The Zn–O bonds are coplanar with the m-plane, meaning that Zn and O sites are equally present on the m-plane surface, making it a nonpolar surface. ZnO grown by Molecular Beam Eptaxy on c-plane sapphire will tend to be O-polar, though this can be changed with GaN or MgO buffer layers.Reference Katoa, Sanoa, Miyamotoa and Yao18
Crystals cleaved at the c-plane in ultrahigh vacuum (UHV) at 90 K initially exhibit no surface conductivity on either polar face. Briefly heating in UHV to 570 K does not introduce O-polar conductivity, but it results in a Zn-polar conductivity of 10−4 Ω−1. As with m-plane surfaces, air exposure rapidly reduces this Zn-polar conductivity.Reference Heiland and Kunstmann19 While an ideal Zn-polar termination is expected to produce a metallic surface state, a triangular reconstruction pattern is energetically favorable on a clean Zn-plane.Reference Wander, Schedin, Steadman, Norris, McGrath, Turner, Thornton and Harrison20 The reconstructed surface is not expected to produce mobile surface charge, so it is difficult to reconcile the appearance of Zn-polar surface conduction during annealing under UHV. It may be that the unreconstructed Zn-polar face holds a charge that draws mobile donors to the surface after cleaving but before the reconstruction has formed.
In the presence of moisture, it is energetically favorable for the Zn-polar face to chemisorb hydroxyl groups up to a half monolayer of coverage, and a metallic conduction layer is not expected.Reference Kreese, Dulub and Diebold21 This would indicate that moist oxygen is more likely to eliminate the surface conductivity layer than oxygen alone. This is consistent with a finding that an evaporated silicon oxide passivation layer alone does not destroy the conducting layer and is even able to preserve it upon exposure to the surrounding air.Reference Schmidt, Kiesel, Van de Walle, Johnson, Nause and Döhler8 A different study suggested that such an oxide passivation treatment resulted in a more rapid decay of photoconductivity. However, in that case, the UV exposure was carried out after the passivation layer was deposited.Reference Murphy, Moaazami and Phillips22 Thus, it is possible that the passivation layer simply blocked the UV photodesorption of oxygen or hydroxyl groups, negating a pathway for a slowly decaying surface conductivity to occur.
On the O-polar face, the opposite is expected, that metallic conduction will form when hydroxyl groups are adsorbed from the air.Reference Wander and Harrison23 The free exciton PL peak was weaker on the O-polar face, and this was attributed to a higher carrier concentration/downward band bending on that face.Reference Yamamoto, Moriwaki, Hattori and Yanagi24
Conversely, there is evidence that the Zn-polar face tends to have a higher surface carrier concentration. Room temperature PL found that the Zn-polar face had a weaker overall near band edge intensity.Reference Chevtchenko, Moore, Özgür, Gu, Baski and Morkoç25 Furthermore, the room temperature Zn-polar band bending was determined to be ∼200 meV deeper than the O-polar bending in XPS and Kelvin probe measurements. The band bending of the nonpolar surfaces was intermediate between that of the two polar faces.Reference Allen, Swartz, Myers, Veal, McConville and Durbin26 The deeper band bending would suggest that Zn-polar faces should have a lower Schottky barrier height, as near-interface donors will typically lower such a barrier.Reference Schmeits27 However, use of the O-polar face results in inferior Schottky contacts.Reference Allen, Miller, Reeves and Durbin28 This is probably the result of the O-polar face more easily forming oxygen vacancies as a metal barrier is deposited.Reference Allen, Mendelsberg, Reeves and Durbin29
IV. PERSISTENT PHOTOCONDUCTIVITY
The rate of Persistent Photoconductivity (PPC) decay observed in ZnO is dependent on the ambient atmosphere, as was shown in Fig. 1. It is thus at least partially the result of gradual readsorption of oxygen passivating the surface conducting layer.Reference Krusemeyer30 Subband gap near infrared illumination was shown to speed up PPC on p-doped ZnO:N.Reference Polyakov, Smirnov, Govorkov, Belogorokhov, Kozhukhova, Markov, Osinsky, Dong and Pearton31
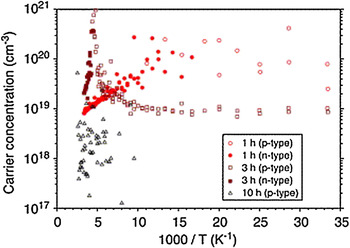
PPC was also investigated in vacuum by photo-Hall measurements on p-doped ZnO:P. Photoconductivity during light exposure has a n-type mobility near 1000 cm2/Vs at 77 K. When the illumination is turned off, this mobility falls below 10 cm2/Vs, but it remains n-type for many hours. Warming and cooling cycles allow one to observe a bulk p-type Hall coefficient at low temperatures and a slowly decaying n-type PPC at higher temperatures, with a n–p transition temperature that gradually rises (Fig. 4).Reference Claflin, Look, Park and Cantwell32 It was suggested that mobile electrons or mobile donors were confined to a conducting layer on the surface and were escaping thermally, over the total course of 10 h at 400 K in high vacuum. This study, which was performed on RF-sputtered ZnO:P on c-plane sapphire with an unknown polar face exposed, stands in contrast with previous studies on nonpolar m-plane ZnO, which indicated an increase rather than a decrease in surface conductivity during 500 K anneals in UHV.Reference Göpel and Lampe11
Effect of 400 K vacuum annealing of 1, 3, and 10 h total, on the carrier concentration of rf-sputtered ZnO:P. The initial domination by an n-type surface-related PPC gradually shifts to higher temperatures as the carrier sign becomes more consistently p-type. Reprinted from Ref. Reference Claflin, Look, Park and Cantwell32 with permission from Elsevier.

Li-doped ZnO exhibits a PPC decay on the order of 1 min at room temperature. PPC is to be expected since Lithium on a zinc site (LiZn) is an acceptor that requires a lattice relaxation to become ionized.Reference Schirmer and Zwingel33 The decay rate has a thermal activation energy of about 280 meV, and it is believed to be related to LiZn acting as an acceptor-like deep trap.Reference Lopatiuk, Chernyaka, Osinsky and Xie34 This was verified using EPR, which found a charge state that could be assigned to neutral LiZn during illumination. The charge state, much like the photoconductivity, decayed on the order of 1 min at room temperature, considerably faster than surface-related PPC. Li-related PPC decay rates could be slowed to several hours by cooling to 77 K.Reference Barzola-Quiquia, Esquinazi, Villafuerte, Heluani, Pöppl and Eisinger35
V. n-TYPE BACKGROUND
A. Native defects
It is well known that ZnO tends to be n-type, typically dominated by a donor with an activation energy of 30 meV. No impurity detected by SIMS appears to scale with the n-type background.Reference Schmidt, Kiesel, Ehrentraut, Fukuda and Johnson36 Originally, VO was assumed to be a dominant donor, due in part to the reduction of n-type surface conductivity with oxygen or oxygen plasma exposure. But calculations continue to predict that VO is a deep donor. That is, it can compensate p-type doping attempts but should not be able to account for the room temperature n-type background. ZnI complexes have been suggested as a possibility for the 30-meV donor. Irradiation by a 1-MeV electron beam appears to have introduced 30 meV donors at roughly the predicted rate for the displacement of Zn atoms,Reference Look, Farlow, Reunchan, Limpijumnong, Zhang and Nordlund37 but the results are difficult to interpret in light of the surface conductivity layer as this may contain hydrogen donor complexes, which would be broken up by high energy electrons.Reference Look, Mosbacker, Strzhemechny and Brillson14
B. Impurities
Group III impurities (In, Al, Ga) are donors with an activation energy of about 70 meV. These can account for many of the donors often seen in temperature-dependent Hall measurements. Hydrogen substitutionals (HO) were recently put forward as a likely dominant shallow donor. They are predicted to more stable than interstitial hydrogen (HI), which would explain the general trend of decrease in donor density with increased exposure to oxygen.Reference Janotti and Van de Walle38 This mixture of HI and HO would also account for the confusing array of diffusion behaviors observed for H.Reference Nickel39
C. Exposure to hydrogen
Exposure to molecular hydrogen at room temperature has no effect on electrical properties, but Hydrogen cracked with a heated tungsten filament causes a conducting layer to form. The O-polar side more rapidly increases than the Zn-polar side, but the saturation values reach the same 10−4 Ω−1.Reference Heiland and Kunstmann19 Later experiments showed that the Zn-polar face formed Zn clusters with exposure to atomic hydrogen, while the O-polar face formed a neatly O–H-terminated surface, which is expected to be semimetallic.Reference Losurdo and Giangregorio40
If a forming gas anneal is instead carried out, conductivity increases overall, yet paradoxically, surface conductivity appears to decrease, judging by the results at 20 K. It is only the bulk conductivity that increases.Reference Look, Claflin and Smith15
VI. CHARACTERIZATION OF MAGNETOTRANSPRT MEASUREMENTS
Dopants both intentional and background are mainly characterized through magnetotransport measurements. Through measurement of the Hall coefficient R H and the resistivity ρ, the Hall mobility and carrier concentration can be found through m H = R H/ρ and n H = 1/qR H with q as the electron charge. The carrier concentration can be accounted for through the charge balance equation, and the mobility can be explained by a variety of scattering mechanisms. Parameters such as the donor and acceptor concentrations N d and N a can then be extracted through fitting.
A. Scattering mechanisms in nondegenerate ZnO
The scattering or recombination times in nondegenerate ZnO are determined by the following effects:
Acoustic phonons inducing a deformation potential,

Acoustic phonons inducing a piezoelectric potential,
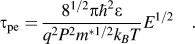
As well as defects and impurities, both uncharged,

And charged,
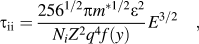
where  is a screening term with a parameter
 , while
 is a screening length.Reference Look41
Also, scattering from polar optical phonons, while inelastic, can still be expressed by an effective elastic scattering time,

Provided that the temperature range is well below T po.Reference Gelmont, Shur and Stroscio42 As temperatures become comparable to T po, modeling the inelastic polar optical scattering as an effective elastic relaxation rate in closed form becomes increasingly difficult.Reference Look41
These scattering effects depend upon an agglomeration of physical parameters. The high frequency and static dielectric constants ε∞ = 3.72ε0 and ε = 8.12ε0 are typically used,Reference Rode43 though more recent spectroscopic ellipsometry results suggest ε is closer to 7.77ε0.Reference Ashkenov, Mbenkum, Bundesmann, Riede, Lorenz, Spemann, Kaidashev, Kasic, Schubert, Grundmann, Wagner, Neumann, Darakchieva, Arwin and Monemar44 The longitudinal elastic constant is c l = 210 GPa, the piezoelectric coupling coefficient is P = 0.21, and the polar optical phonon Debye temperature is T po = 750 KReference Yang and Giles45, Reference Cattia, Noelb and Dovesi46
The effective electron mass in ZnO is m * = 0.24me.Reference Shokhovets, Gobsch and Ambacher47 The polaron effective mass m p* = 0.29me is sometimes inserted, but the m *s appearing in most of the scattering expressions above are related to the effective density of states, rather than the effective inertial mass that m p* represents. The m * appearing explicitly in the expressions for  and
 should be the standard rigid lattice effective mass. The mass appearing in the subexpression for y could however be replaced with m p*.Reference Singh48
In addition, the conduction band deformation potential E 1 is the coefficient relating strain to conduction band energy shift in eV. Unlike the band gap deformation potential,Reference Chen, Liu, Shao, Xu, Liu, Wang, Liu and Zou49 this is difficult to measure directly. It was previously estimated to be 3.8 eV,Reference Rode43 and later, first-principles calculations would yield 3.1 eV.Reference Janotti and Van de Walle50 Much higher values such as 15 eV have typically been used to provide a better fit to higher temperature mobility data, as the primary goal has generally been to determine the ionized impurity scattering that dominates lower temperatures.Reference Look, Reynolds, Sizelove, Jones, Litton, Cantwell and Harsch51 Yet these higher values of deformation potential should be unnecessary if neutral impurity scattering is included, as neutral impurity scattering has a weak dependence on temperature, which allows it to effectively explain the room temperature mobilities without such ad hoc assumptions.Reference Yang, Xu and Giles52 The neutral impurity density N n and the ionized impurity density N i may be used as fitting parameters. One can then assume N i = 2N a + n and  by charge neutrality when all acceptors are filled (negatively ionized), as expected in n-type material.
The physical parameters given above might vary a few percent over the normal temperature range of a transport measurement but can be assumed constant. The values given apply only to current flow perpendicular to the c-axis where magnetotransport measurements are usually made. The charge state Z has a value of 1 for H impurities, but it would become 2 in the case of oxygen vacancies (VO) or zinc interstitials (ZnI).
Note that the scattering rates/times are given in terms of electron energy E above the bottom of the conduction band, mainly in the form of a monomial E −S. The simplest way to compare the scattering mechanisms to the measured mobility is to average each scattering time  over the distribution of electrons in the conduction band,
 , where N(E) is the conduction band density of states. Fortunately, the monomial energy dependence of the scattering times
 makes the averaging integral effectively a replacement of E −S with
 to form the energy averaged
 . The lone exception is the f(y) term, which may be set at its maximum in the integral,
 .Reference Look41 The total scattering rate can then be found from Mathieson’s Rule.

Using this lengthy but fairly straightforward set of expressions, the mobility resulting from a given scattering time is 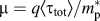 ,Reference Hutson53 and the mobilities and concentrations at each temperature can be the found from the measured quantities by
 and
 , where r H is a factor approximately equal to 1.1. The remaining free parameters N d and N a can thus be fit to the mobility.
For improved accuracy, one may find  at each temperature, where
 is found by squaring the scattering time and replacing the monomial
 with
 .Reference Look41 The mobility may then be iteratively refit using the new value of
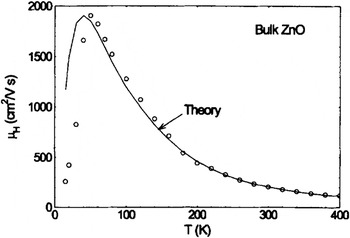
 . A prototypical example of fitting the mobility mechanisms is shown in Fig. 5.
A prototypical result of temperature-dependent mobility measurements on a single crystal grown by seeded chemical vapor transport. The theoretical fit used the scattering mechanisms given in the text, though the effects of neutral impurity scattering were ignored. Reprinted from Ref. Reference Look, Reynolds, Sizelove, Jones, Litton, Cantwell and Harsch51 with permission from Elsevier.

For temperatures well in excess of room temperature or near T po, a full numerical simulation of electron concentration as a function of energyReference Rode54 or a Monte Carlo simulation of electrons moving in crossed electric and magnetic fieldsReference Bertazzi, Bellotti, Furno and Goano55 would be desirable.
An additional consideration for heteroepitaxial film growth on lattice-mismatched substrates is charged dislocation scattering.Reference Look and Sizelove56 The temperature dependence is largely indistinguishable from that of ionized impurities, so a separate measurement of dislocation density is likely required to resolve the two mechanisms.
Epitaxially grown films that are polycrystalline should be analyzed in terms of grain size. Assuming that the grain distribution is homogeneous and isotropic, the mobility within the crystals can be roughly approximated by the measured mobility times a factor (1 + 100β), where β is twice the Debye screening length λ divided by the grain size.Reference Sun, Lu, Liu, Shen, Zhang, Li, Zhang, Yao, Zhao and Fan57
B. Carrier concentration in nondegenerate ZnO
Additionally, the carrier concentration n as a function of temperature may be fit to the charge balance equation,

where,

and N(T) is the conduction band’s effective density of states (as distinct from the density of states N(E)). The degeneracy ratio g is assumed to be 2 for hydrogenic donors. The summation allows for the possibility of multiple donors with activation energies  and concentrations
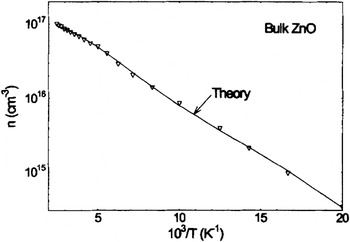
 , as shown in Fig. 6.Reference Look, Reynolds, Sizelove, Jones, Litton, Cantwell and Harsch51
A prototypical set of carrier concentration measurements carried out concurrently with the measurement in Fig. 5. The theoretical fit used the charge balance equation while assuming two donors. The least squares fit yielded donor activation energies of 30 and 60 meV. Reprinted from Ref. Reference Look, Reynolds, Sizelove, Jones, Litton, Cantwell and Harsch51 with permission from Elsevier.

C. Degenerate surface and interface conductivity
The surface conductivity must also be dealt with to properly characterize magnetotransport whenever a sheet conductivity of 10−4 Ω−1 would draw a significant amount of current away from the material of interest. This situation can result from low conductivity material or simply from the study of thin films. For temperature-dependent experiments, the requisite removal of ambient air is capable of increasing the surface conductivity. Finally, the treatments mentioned previously which might reduce or eliminate surface conductivity on one crystalline face may not work on others.
Fortunately, several methods exist to work around the existence of a conducting layer. One method is to cool the sample until the temperature dependence of electrical properties is minimal (usually 20 K). Then, assume that the carrier concentration at that point is entirely due to a degenerate surface or interface layer (n surf = nH(20K) d/dsurf) whose concentration is not temperature dependent. The temperature dependence of the layer’s mobility is surely dominated by ionized impurity scattering due to the large carrier concentration in such a layer. Thus, the mobility can be set to  with a new degenerate screening parameter,

where d is the sample thickness, and dsurf is the unknown thickness of the degenerate conducting layer, which can be introduced as a fitting parameter. The measured mobility must then be fit as the combination of the two parallel layers.Reference Look58


An alternative treatment for transport characterization in the presence of surface conductivity is the variable field Hall effect (VFH) technique. At any given temperature, R H and ρ are measured at a series of magnetic fields B ranging up to 10 T. The results are converted to the conductivity tensor components.


A pair of layers can be assumed, so that N = 2, and i = 1 and i = 2 refer to the bulk and surface layers, respectively. The four parameters n, n surf, μ, and μsurf are then found through fitting the tensor components. This provides a direct measurement of the bulk mobility and concentration at each temperature without sophisticated assumptions about the temperature dependence of the conducting layer. Characterization of a film on a conducting substrate, such as homoepitaxial ZnO, also becomes feasible with VFH.Reference Bisotto, Granier, Brochen, Ribeaud, Ferret, Chicot, Rothman, Pernot and Feuillet59
Unfortunately, powerful (∼10 T) magnetic fields are necessary to improve the mobility–magnetic field product to make VFH useful in ZnO. Even such fields leave difficulties in resolving the surface mobility itself, which is expected to be about 10 cm2/Vs on the polar surfaces from time of flight measurements.Reference Yamaguchi, Komiyama, Chonan, Ishidsuka, Ito and Aoyama60 Also, the electronic properties must be exceptionally stable over the field ramping time, while PPC and slight changes in the ambient or temperature can cause changes in conductivity.
Interfacial conductivity on heteroepitaxial films is common on both sapphire and GaN because of misfit dislocations and because diffused Al and Ga are n-type dopants in ZnO.Reference Tampo, Yamada, Fons, Shibata, Matsubara, Iwata, Nakahara, Takasu and Niki61 These layers are likely degenerate and may be characterized in the same way as the surface conductivity.Reference Petukhov, Stoemenos, Rothman, Bakin and Waag62
D. Fully degenerate ZnO films
Intentional, heavy n-type doping of ZnO layers is often studied as a possible method to fabricate transparent conducting oxides (TCOs) for solar cells and displays. The characterization is greatly simplified in this case, as very heavily doped semiconductors have minimal temperature dependence for either concentration or mobility. The expression for mobility is similar to that for μsurf given in the preceding section but without energy averaging to obtain the temperature dependence. Instead, the mobile electrons are all in the vicinity of the Fermi level. Thus, the energy E −S is replaced by the Fermi level  , relative to the bottom of the conducting band, and r H is set to 1.Reference Look, Scott, Leedy and Bayraktaroglu63 As TCO layers are often very thin, there may be significant boundary scattering. This can be simulated by a mechanism with a scattering time set equal to the one quarter the distance between the film boundaries divided by the Fermi velocity,Reference Look, Leedy, Tomich and Bayraktaroglu64

E. Difficulties in the characterization of p-ZnO
In theory, p-type material can largely be analyzed through the above methods and scattering mechanisms, with an effective mass of m * = 0.66me Reference Look65 and a valence band deformation potential of E 1 = 0.2 eV.Reference Janotti and Van de Walle50 In practice, there are many impediments to the reliable analysis of p-type conductivity in ZnO. In addition to the n-type PPC and atmosphere-dependent surface behavior already covered, self-compensating n-type defectsReference Marfaing and Lusson66 reduce the mobility and material quality. Low mobilities reduce the ratio of Hall voltage to Ohmic voltage during transport measurements, making the carrier sign hard to detect. Poor ohmic contacts to p-ZnO contribute to the noise.
In early doping studies for any material, some inhomogeneity of the electrical properties is possible. In inhomogeneous samples, it has long been known that abnormally high mobility values can result from van der Pauw measurements, values that are not necessarily an average over the sample.Reference Wolfe and Stillman67 Recently, it has been shown that the use of pin contacts that are not on the periphery can even result in an opposite carrier type reading in such samples.Reference Bierwagen, Ive, Van de Walle and Speck68
A particularly vexing effect is that of inversion layers at ZnO–Si heterojunctions. If oxygen adsorbates or intrinsic surface states cause an upward band bending at the ZnO–Si interface, a p-type inversion layer can easily result within a Si substrate if a ZnO film is grown on it. This occurs in spite of the fact that both materials are actually n-type, that Zn is not a shallow acceptor in Si, and that Si is not an acceptor in ZnO.Reference Zhao, Li, Krtschil, Krost, Yu, Zhang, Gu and Gao69
VII. CONCLUSIONS
Annealing of ZnO in vacuum has long been known to create conductivity on the Zn-polar and nonpolar faces. UV illumination results in PPC, which also occurs largely, though not entirely, through oxygen desorption enhancing the conductivity of this surface layer. Exposure to the air quenches the conductivity of the layer. The general inverse relationship between conductivity and the presence of oxygen would suggest that VO or possibly excess Zn is responsible. VO has however been largely ruled out as a major shallow donor, although ZnI complexes have not. More recently, H donors, particularly in the form of HO, have become a leading possibility for the origin of the background conductivity, and the accumulation of mobile H is a prominent candidate for the origin of surface conductivity. Alternatively, SIMS measurements suggest an accumulation of group III donors may instead be the cause of the surface conductivity.
The Zn-polar faces of ZnO are expected to form a reconstruction, which eliminates intrinsic surface conductivity, but it remains possible for mobile donors to accumulate in the near-surface region. Exposure to ambient air erodes that conductivity. Yet the situation appears to be reversed on the O-polar face, with exposure to ambient air creating surface conductivity and vacuum annealing reducing it. The changes, at least on the polar faces, are thought to result from the adsorption of hydroxyl groups due to the presence of moisture in the air, not simply the adsorption of oxygen. Downward conduction band bending manifests on all crystalline faces in ambient at room temperature, with the greatest on the Zn-polar face. It remains unclear what is the “natural” state of pure terminated ZnO and what is the effect of atmosphere.
An exhaustive systematic study of surface conductivity in ZnO has yet to be carried out. As with ZnO in general, the surface phenomena are in a perennial state of being forgotten and rediscovered. Care must be taken to characterize each specific crystalline face, with attention to oxygen, moisture, illumination, and temperature. UV illumination is known to not only trigger oxygen desorption but to affect surface hydroxyl groups, even to change aqueous wetting angles.Reference Lüa, Huang, Chen, Zhu, Meng, Song and Sun70 Some researchers find that heating to 750 K and exposing to a UV lamp followed by rapid cooling will virtually eliminate surface conduction on the m-plane face. It would be desirable to attempt this technique on the polar faces.
A variety of scattering mechanisms have been used to explain magnetotransport measurements in ZnO. As higher quality crystals with lower n-type backgrounds become available, the techniques given above will be needed more often to deal with PPC and surface and interfacial conductivity.