INTRODUCTION
Recent declines in the extent and thickness of summer sea ice in the Arctic have raised concerns about the future status of ice-dependent and ice-associated species. Predicting the impacts of ice loss on Arctic marine organisms is difficult. All Arctic research to date has been conducted while sea ice cover was relatively high or, in recent decades, during a period of rapid change (Walsh et al., Reference Walsh, Fetterer, Scott Stewart and Chapman2017). Little is known about the structure and function of biological systems in the Arctic when sea ice cover is low. Historical ecology has emerged as an important tool for gaining information about past ecosystems (Swetnam et al., Reference Swetnam, Allen, Betancourt, Applications and Nov1999; Lotze and Worm, Reference Lotze and Worm2009). Rick and Lockwood (Reference Rick and Lockwood2013, pp. 46–47) define historical ecology as “the use of historic and prehistoric data (e.g., paleobiological, archaeological, historical) to understand ancient and modern ecosystems, often with the goal of providing context for contemporary conservation.” Studies of historical ecology rely on reconstruction of past conditions using archived or preserved specimens and can therefore capture variability in biological systems across broad time spans (e.g., Dyke and Savelle, Reference Dyke and Savelle2001; Newsome et al., Reference Newsome, Etnier, Kurle, Waldbauer, Chamberlain and Koch2007; Misarti et al., Reference Misarti, Finney, Maschner and Wooller2009; Alter et al., Reference Alter, Newsome and Palumbi2012; Wiley et al., Reference Wiley, Ostrom, Welch, Fleischer, Gandhi, Southon and Stafford2013; Sherwood et al., Reference Sherwood, Guilderson, Batista, Schiff and McCarthy2014; Ostrom et al., Reference Ostrom, Wiley, James, Rossman, Walker, Zipkin and Chikaraishi2017). This approach can provide otherwise unobtainable information about the responses of plants and animals to large-scale changes not observed within the era of modern scientific inquiry. The result is a more complete understanding of natural systems that allows contemporary data to be compared with a variety of historical ecosystem states.
Stable isotope analysis is commonly used in studies of historical ecology, as isotope ratios in preserved hard tissues typically remain unchanged after an animal's death and can be measured in a variety of tissue types (Fry, Reference Fry2006; Newsome et al., Reference Newsome, Clementz and Koch2010). Stable carbon (δ13C) and nitrogen (δ15N) isotope compositions are versatile tools for studying animal diet, with δ15N indicating trophic position of the consumer and δ13C the sources of primary production at the base of the food web (Hobson and Welch, Reference Hobson and Welch1992; Goericke and Fry, Reference Goericke and Fry1994). Additionally, changes in δ13C and δ15N may reflect shifts in baseline isotope ratios and can provide important information about primary production including the type of producers at the base of the food web, rates of production, and nutrient utilization (Fogel and Cifuentes, Reference Fogel, Cifuentes, Engel and Macko1993). Bones are among the few biological structures that are commonly preserved in archaeological assemblages; thus bone collagen is often analyzed for these studies (Hedges et al., Reference Hedges, Stevens, Koch and Leng2006). The slow metabolic turnover of bone tissue means that isotope ratios of bone collagen represent a long-term average of animal diet, often encompassing an animal's entire life (Manolagas, Reference Manolagas2000). Seasonal and short-term variability are not typically represented, making bone collagen particularly valuable for investigating changes in stable isotope ratios over long time periods.
Arctic marine mammals are ideal candidates for studies of historical ecology, as they have been an important subsistence resource for native peoples in this region for thousands of years, and their discarded remains preserve well in frozen northern soils (Misarti et al., Reference Misarti, Finney, Maschner and Wooller2009). Pacific walrus (Odobenus rosmarus divergens) bones are commonly recovered from archaeological sites in Alaska, and many specimens are available in museum collections. Walruses rely on sea ice as a platform for giving birth, molting, and resting between foraging bouts (Fay, Reference Fay1982), likely making these animals vulnerable to reduced sea ice coverage associated with Arctic warming (Jay et al., Reference Jay, Marcot and Douglas2011). With the loss of summer sea ice in the Chukchi Sea, the frequency of large, terrestrial walrus haulouts in Alaska has increased, leading to trampling events, increased juvenile mortality, and, presumably, local resource depletion (Garlich-Miller et al., Reference Garlich-Miller, MacCracken, Snyder, Meehan, Myers, Wilder, Lance and Matz2011; Jay et al., Reference Jay, Marcot and Douglas2011; MacCracken, Reference MacCracken2012). Sea ice also plays an important role in maintaining benthic-pelagic coupling in the Bering and Chukchi Seas, resulting in the export of large amounts of organic carbon to the benthos and supporting rich benthic communities (Grebmeier et al., Reference Grebmeier, Bluhm, Cooper, Danielson, Arrigo, Blanchard and Clarke2015a; but see Arrigo et al., Reference Arrigo, Perovich, Pickart, Brown, van Dijken, Lowry and Mills2012; Arrigo and van Dijken, Reference Arrigo and van Dijken2015). Walruses primarily forage on benthic invertebrates (Fay, Reference Fay1982; Sheffield and Grebmeier, Reference Sheffield and Grebmeier2009); therefore, the weakening of benthic-pelagic coupling associated with sea ice loss is expected to reduce availability of preferred walrus prey, possibly driving shifts in walrus diet (Jay et al., Reference Jay, Marcot and Douglas2011; Grebmeier, Reference Grebmeier2012). Changes in the accessibility of preferred prey could lead to longer, more energetically expensive foraging trips, which may have negative effects at the population level (Jay et al., Reference Jay, Fischbach and Kochnev2012; Noren et al., Reference Noren, Udevitz and Jay2012, Reference Noren, Udevitz and Jay2016).
Despite concerns about the future of the Pacific walrus population, the effects of ice loss remain largely unknown, and there are some indications that impacts to the health of walruses have so far been minimal. For example, Alaska Native subsistence hunters report that although sea ice conditions have changed and access to walruses has become more difficult, average walrus body condition has not changed in recent years (Huntington et al., Reference Huntington, Quakenbush, Nelson and Huntington2016). In 2014–2016, hunters from the communities of Gambell and Savoonga, on St. Lawrence Island, Alaska, indicated on biomonitoring data sheets accompanying harvested animals that walruses appeared healthy and were generally in good body condition. In 2017, the U.S. Fish and Wildlife Service (USFWS) came to the decision not to list the Pacific walrus as endangered or threatened under the Endangered Species Act. This decision was based on the conclusion that regional warming and increased use of the Arctic by humans did not pose a serious threat of extinction to the species (MacCracken et al., Reference MacCracken, Beatty, Garlich-Miller, Kissling and Snyder2017). The purpose of this study was to investigate how sea ice loss affected Pacific walruses in the past, so that we might better understand how current and future climate change will affect this species. To accomplish this, we measured δ13C and δ15N of walrus bone collagen sampled from archaeological assemblages, historical collections, and modern Alaska Native subsistence harvests to assess how changing sea ice conditions over the last ~4000 years affected walrus diet.
METHODS
Sample collection and radiocarbon dating
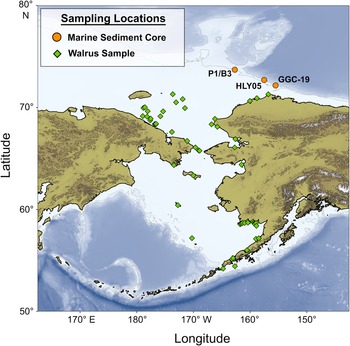
Pacific walrus bones were identified from archaeological faunal assemblages, historical museum collections, and present-day Alaska Native subsistence harvests (Fig. 1). Bone samples from the 2014–2016 (n = 76) subsistence harvests in the communities of Gambell and Savoonga on St. Lawrence Island, Alaska, were obtained through agreements with Alaska Native subsistence hunters, the Eskimo Walrus Commission, the Alaska Department of Fish and Game, and the USFWS. Bone samples were transferred to the University of Alaska Fairbanks for sample analysis under a letter of authorization from the USFWS to Dr. L. Horstmann. The North Slope Borough Department of Wildlife Management in Utqiaġvik (formerly Barrow), Alaska, provided additional modern samples collected in 2012, 2014, and 2015 (n = 9; permit #NSB-DWM USFWS MA134907-2). Historical specimens (n = 142) were sampled from collections at the University of Alaska Museum in Fairbanks, Alaska, and spanned the period from 1928 to 2007. Additional historical specimens (n = 18) from the U.S. Museum of Natural History, Smithsonian Institution, Washington, D.C., dated from 1880 to 1973 and were sampled to fill gaps in the chronology (Supplementary Table 1). Only adult and juvenile walruses were included in analyses. Calves and fetuses were removed because of expected differences in δ13C and δ15N associated with gestation and nursing (Newsome et al., Reference Newsome, Clementz and Koch2010)
Map of the study area indicating sampling locations of marine sediment cores (P1/B3, GGC-19, and HLY05; orange circles) and walrus specimens (green diamonds).

Archaeological specimens (n = 212) were compiled from multiple collections housed at the University of Alaska Museum and UIC Science, Utqiaġvik, Alaska. Samples originated from 12 archaeological sites along the Bering and Chukchi Seas and 2 sites in the North Pacific, on the southern side of the Alaska Peninsula. Timing, methodology, and written documentation of excavations varied widely among sites. Samples used for this study were those that could be identified as belonging to distinct individual walruses and confidently assigned date ranges based on radiocarbon dating and site stratigraphy. Distal limb bones (carpals, tarsals, and phalanges) were excluded from analysis because of the tendency of their stable isotope ratios to be unrepresentative of the rest of the skeleton (Clark et al., Reference Clark, Horstmann and Misarti2017). Radiocarbon dating of marine samples is inherently problematic because of complications associated with the marine carbon reservoir (Stuiver et al., Reference Stuiver, Pearson and Braziunas1986). For this reason, the most likely date range of each sample was established using radiocarbon dating of directly associated terrestrial material, where available (mostly caribou [Rangifer tarandus] bone collagen; Supplementary Table 2). In instances where directly associated terrestrial dates were not available for a specimen, most likely date ranges for walrus samples were estimated using bracketing terrestrial dates from directly above and below a specimen, information about the provenience of each bone, limiting dates, and temporally diagnostic artifacts (Supplementary Table 3). The 2σ range was used for each radiocarbon date, except where it could be further constrained using additional information such as well-dated stratigraphy and known dates of site occupation. Dating of terrestrial samples was conducted at the University of Georgia Center for Applied Isotope Studies using accelerator mass spectrometry. Archaeological walrus samples used for this study originated from ~4084 to 0 calibrated years before present (cal yr BP).
Pacific walruses exist in a single, mixed population, with little evidence of stock structure (Fay, Reference Fay1982; Cronin et al., Reference Cronin, Hills, Born and Patton1994; Scribner et al., Reference Scribner, Hills, Fain, Cronin, Dizon, Chivers and Perrin1997; Lindqvist et al., Reference Lindqvist, Bachmann, Andersen, Born, Arnason, Kovacs, Lydersen, Abramov and Wiig2009; Shitova et al., Reference Shitova, Kochnev, Dolnikova, Kryukova, Malinina and Pereverzev2017; but see Jay et al., Reference Jay, Outridge and Garlich-Miller2008; Sonsthagen et al., Reference Sonsthagen, Jay, Fischbach, Sage and Talbot2012). Individual walruses move widely across the species' geographic range, foraging as they travel (Fay, Reference Fay1982; Jay et al., Reference Jay, Fischbach and Kochnev2012; Beatty et al., Reference Beatty, Jay, Fischbach, Grebmeier, Taylor, Blanchard and Jewett2016). For these reasons, the location at which an animal was harvested was not deemed an important factor for this study. Walruses sampled at any location within the species' geographic range were considered representative of the population as a whole. That said, the annual walrus migration is sex segregated, with females and juveniles following the retreating ice northward into the Chukchi Sea in summer, and males moving to coastal areas of the Bering Sea and Gulf of Anadyr (Fay, Reference Fay1982). Thus, it is nearly impossible to disentangle sex-related differences in stable isotope ratios (i.e., diet) from geographic variations in baseline stable isotope values between the Bering and Chukchi Seas. To account for the potential impacts of sex/region on the results of this study, the sex ratios and sex-related differences in δ13C and δ15N of samples from the historic and modern periods were considered in relation to observed changes in mean isotope ratios between these periods. Sex data were not available for archaeological samples, so the role of sex-related and regional differences could not be quantified. Location of sample collection alone is not a good proxy for sex, as male and female walruses spend much of the year together in the Bering Sea and because the degree of sex-segregation during migration may have changed over time (Fay, Reference Fay1982; Garlich-Miller et al., Reference Garlich-Miller, MacCracken, Snyder, Meehan, Myers, Wilder, Lance and Matz2011).
Bone collagen extraction and stable isotope analysis
Collagen extractions were conducted using the methods described in Misarti et al. (Reference Misarti, Finney, Maschner and Wooller2009), as modified from Matheus (Reference Matheus1995). Briefly, ~0.4 g of cortical bone was sampled from walrus bones using handheld cutting tools, submerged in ultrapure water, and placed in a sonic bath for cleaning. Lipids were extracted by soaking the bone in 2:1 chloroform/methanol for 8 hours. The mineral component of the bone was subsequently removed using a mixture of 6N hydrochloric acid (HCl) and ultrapure water. Demineralization was conducted at ~2°C, and the length of time required varied by sample (ranging from 1 to 3 weeks). For archaeological specimens, the demineralized samples were then rinsed to neutral with ultrapure water, soaked in a solution of ultrapure water and 5% potassium hydroxide (KOH) for 8 hours to remove any contamination from soils, and rinsed to neutral again with ultrapure water. For all samples, the organic component of the bone was gelatinized by placing it in 5 mL of ultrapure water, adding 0.05 mL of 3N HCl, and then agitating it at 65°C. The gelatinized product was filtered through a 0.45 µm filter to remove any insoluble particles and noncollagen organic compounds, and freeze-dried for 48 hours to yield purified collagen. A subsample of this collagen (0.2–0.4 mg) was submitted for stable isotope analysis.
Stable carbon and nitrogen isotope ratios of bone collagen samples were analyzed in the Alaska Stable Isotope Facility at the University of Alaska Fairbanks, using a Costech ECS 4010 elemental analyzer and ThermoScientific Conflo IV, interfaced with a ThermoScientific DeltaV mass spectrometer. Stable isotopic compositions were calibrated relative to Vienna Pee Dee belemnite and atmospheric nitrogen gas (air) scales using USGS40 and USGS41 as calibration standards. Results were reported in parts per thousand (‰) using δ notation. A commercially available peptone standard (No. P-7750 bovine-based protein, Sigma Chemical Company, lot #76f-0300 [δ13C, −15.8‰; δ15N, 7.0‰]) was analyzed as a check standard after every 10 samples to estimate uncertainty. Precision of these analyses was determined to be ±0.2‰ for δ13C and ±0.2‰ for δ15N, based on repeated measurements of this standard across all analytical runs (n = 144). Measurements were accurate to within less than ±0.01‰ for δ13C and less than ±0.02‰ for δ15N, based on differences between observed and known values of the check standard. Collagen yield (percent of dry bone weight) and sample composition (weight percent carbon, weight percent nitrogen, and C/N ratio) were assessed to evaluate the quality of the collagen samples (Supplementary Table 4). Only collagen samples with ~15% nitrogen, ~45% carbon, and a C/N ratio of ~3.2 were used for analyses (Tuross et al., Reference Tuross, Fogel and Hare1988; Koch et al., Reference Koch, Fogel, Tuross, Lajtha and Michener1994; Hedges et al., Reference Hedges, Stevens, Koch and Leng2006; Szpak et al., Reference Szpak, Metcalfe and Macdonald2017).
To account for the global decline in δ13C associated with the combustion of fossil fuels since 1850, known as the Suess effect, a mathematical correction was applied to the δ13C values of the historic and modern samples. This correction was adapted from Misarti et al. (Reference Misarti, Finney, Maschner and Wooller2009) to provide values specific to the Bering Sea. A Bering Sea correction was used for this study, as walruses spend much of their time in this basin, and because large amounts of Bering seawater carrying nutrients and carbon are advected northward into the Chukchi Sea through the Bering Strait (Grebmeier et al., Reference Grebmeier, Cooper, Feder and Sirenko2006). Atmospheric CO2 concentrations from the Mauna Loa Observatory (Keeling et al., Reference Keeling, Piper, Bacastow, Wahlen, Whorf, Heimann, Meijer, Baldwin, Caldwell, Heldmaier, Jackson, Lange, Mooney and Schulze2005) and yearly Bering Sea surface temperature estimates (Huang et al., Reference Huang, Banzon, Freeman, Lawrimore, Liu, Peterson, Smith, Thorne, Woodruff and Zhang2015) from 1854 to 2016 were incorporated into this correction. The mean sea surface temperature for the period from 1854 to 1874 was used to approximate values for the years between 1850 and 1853. Salinity was assumed to remain constant at 32 practical salinity units (Woodgate et al., Reference Woodgate, Weingartner and Lindsay2012). Laws et al. (Reference Laws, Popp, Bidigare, Kennicutt and Macko1995, Reference Laws, Popp, Cassas and Tanimoto2002) showed that changes in water temperature, salinity, and aqueous CO2 concentrations also affect δ13C discrimination by phytoplankton. Thus, they developed an additional δ13C correction to account for these changes. The maximum correction factor for the period from AD 1850 to 2016, including both the atmospheric Suess effect and the correction developed by Laws et al. (Reference Laws, Popp, Bidigare, Kennicutt and Macko1995, Reference Laws, Popp, Cassas and Tanimoto2002) for changes in phytoplankton δ13C discrimination, was 1.4‰ (Supplementary Table 5).
Developing a Chukchi Sea ice index
Estimates of ice cover in the Chukchi Sea over the last ~4000 yr were compiled using data from marine sediment cores. Dinocyst assemblages from three sites in the northeastern Chukchi Sea (Fig. 1) were used for quantitative sea ice reconstructions (Supplementary Tables 6 and 7). Cores included in this analysis were HLY0501-05 (HLY05; McKay et al., Reference McKay, de Vernal, Hillaire-Marcel, Not, Polyak and Darby2008; de Vernal et al., Reference de Vernal, Rochon, Fréchette, Henry, Radi and Solignac2013), HLY0205-GGC19 (GGC-19; Farmer et al., Reference Farmer, Cronin, De Vernal, Dwyer, Keigwin and Thunell2011), and P1-92-AR-P1/B3 (combined piston/box cores, P1/B3; de Vernal et al., Reference de Vernal, Hillaire-Marcel and Darby2005). To improve intercore comparability, age models for these cores were rerun with the Bacon approach (Blaauw and Christen, Reference Blaauw and Christen2011) using the rBacon R package, version 2.3.3. The Bacon software used the Marine13 calibration curve (Reimer et al., Reference Reimer, Bard, Bayliss, Beck, Blackwell, Bronk Ramsey and Buck2013), and we applied a regional marine reservoir correction (ΔR) of 447 ± 123 based on seven measurements from the Chukchi Sea (McNeely et al., Reference McNeely, Dyke and Southon2006). To generate an index of regional sea ice conditions, data were interpolated along each of the cores to provide yearly sea ice estimates. Cores GGC-19 and P1/B3 spanned the entire study period (4150–0 cal yr BP), whereas HLY05 covered the period from 4150 to 672 cal yr BP. Yearly ice cover data were converted to ice cover anomaly by subtracting the mean ice estimate for each core from the yearly ice estimates along the core. The resulting ice cover anomaly estimates were then scaled by dividing the data from each core by the absolute value of the largest deviation from the average ice condition within that core, such that the maximum or minimum value for each core was 1 or −1. This normalization process removed differences in the magnitude of fluctuations in ice and allowed each core to contribute equally to the ice index. A 101 yr centered moving average was applied to the resulting index, providing an average sea ice anomaly in the Chukchi Sea for the interval extending from 4100 to 50 cal yr BP. Times when this average was greater than 0 were classified as high-ice intervals, and times when it was less than 0 were classified as low-ice intervals. Transitions lasting fewer than 25 yr were not considered to represent a switch between ice states (Supplementary Table 8).
A validation was conducted to test whether sea ice reconstructions from sediment cores in the northeastern Chukchi Sea could provide information about the climate of the broader region. To accomplish this, a sea ice index was generated for 1979–2016, the period of high-resolution satellite passive microwave coverage. Monthly ice cover was calculated for a 1° by 1° area above each core location, and the number of months/year with >50% ice cover was determined for these locations. The methods outlined previously were then used to generate the satellite-era ice index. The correlation between this index and the total annual ice cover in the Chukchi Sea from 1979 to 2016 was investigated using linear regression. Because the annual ice cover data for the Chukchi Sea represent a proportion (thus were bounded by 0 and 1), these data were logit transformed prior to analysis.
Testing for differences through time
Archaeological walrus samples were assigned to high- and low-ice states based on the proportional overlap of their radiocarbon date estimates with intervals of high- and low-ice cover (Supplementary Table 3). Individual walruses were assigned to whichever ice state was more prevalent (>50%) during their estimated radiocarbon date range. A resampling approach was used to examine the potential impacts of improper assignments. For this exercise, each individual was assigned to a high or low sea ice state based on the proportional overlap of that animal's estimated radiocarbon date range and the ice index. Thus, a walrus with an estimated radiocarbon date range that overlapped with a high-ice interval for 70 yr and a low-ice period for 30 yr was given a 70% probability of being assigned to the high-ice group and a 30% chance of being assigned to the low-ice group. After all animals had been assigned, mean δ13C and δ15N values were calculated for high- and low-ice animals. This process was repeated 10,000 times, and the resulting data were used to generate 95% confidence intervals for mean δ13C and δ15N of walruses from high and low sea ice states. Time spans covered by the archaeological (4084–0 cal yr BP) and the historic (70 cal yr BP/AD 1880–2007) samples overlapped by ~70 yr, and it is likely that there is some temporal overlap between the most recent archaeological specimens and the oldest historical museum collections; however, the potentially problematic period included only 20 archaeological animals, averaging 28% overlap between their most likely date ranges and the historic period. Removing these animals did not affect the results, so they were included in analyses. Archaeological walruses were assigned to high and low sea ice states using the ice index, whereas historical samples with known collection dates were assigned to the historic period.
Analyses of variance (ANOVAs) were used to test for differences in δ13C and δ15N among archaeological walruses from intervals of high and low sea ice, as well as walruses from the historic and modern periods. Shapiro-Wilk normality tests indicated both δ13C and δ15N data were nonnormally distributed (δ13C: W = 0.923, P < 0.001; δ15N: W = 0.948, P < 0.001); however, ANOVAs were used for this analysis because visual examination of the data showed the deviations from normality to be relatively minor, and because ANOVAs are generally robust to nonnormality (Blanca et al., Reference Blanca, Alarcón, Arnau, Bono and Bendayan2017). The δ13C and δ15N data from these four time periods had unequal variances, so data were analyzed using White-adjusted one-way ANOVAs, which are robust to heteroscedasticity (White, Reference White1980; Long and Ervin, Reference Long and Ervin2000). Dunnett-Tukey-Kramer (DTK) pairwise multiple comparison tests adjusted for unequal variances and unequal sample sizes were used for post hoc analyses, as this test does not assume equal variances (Dunnett, Reference Dunnett1980). Results of the ANOVAs were compared with those of Kruskal-Wallis tests to confirm their robustness (Supplementary File 1). Differences in variability in δ13C and δ15N between archaeological walruses from intervals of high and low sea ice cover were examined using Stable Isotope Bayesian Ellipses in R (SIBER, version 2.1.3; Jackson et al., Reference Jackson, Inger, Parnell and Bearhop2011), which are robust to differences in sample size. Modern and historic walruses were not included in comparisons of δ13C and δ15N variability, as these animals were collected during much shorter time spans (5 and 127 yr, respectively) and were therefore unlikely to incorporate the same sources of variability expected of the archaeological samples, which spanned thousands of years. Standard ellipse areas corrected for small sample sizes (SEAc) were compared to examine differences in stable isotope variability of archaeological walruses from high and low sea ice intervals. Decadal differences in the δ13C and δ15N of male and female walruses from the historic and modern periods were examined using two-way ANOVAs. Males and females had unequal variances in δ15N, so a White-adjusted ANOVA was used for this comparison. For δ13C, variances were equal across decades and between sexes, so the White adjustment was not applied to the ANOVA. An alpha level of 0.05 was used for all statistical tests.
Known collection dates of historic and modern walruses and more refined sea ice estimates during the last 150 yr allowed for more direct examination of the correlation between sea ice cover and walrus stable isotope ratios. For comparisons with historic and modern walrus samples, yearly September Chukchi Sea ice estimates, expressed as percent ice cover, were extracted from the Scenarios Network for Alaska and Arctic Planning (SNAP) Sea Ice Atlas (http://www.snap.uaf.edu). This data set extends from AD 1850 (100 cal yr BP) to present, with its earliest ice estimates reconstructed from commercial whaling ship logbooks (Mahoney et al., Reference Mahoney, Bockstoce, Botkin, Eicken and Nisbet2011). Linear regressions were used to compare δ13C and δ15N with average September sea ice cover during the 16 yr (average estimated age of walruses used in this study based on age estimates from annuli in cementum layers of walrus teeth conducted by Matson's Laboratory LLC, Manhattan, MT; Garlich-Miller et al., Reference Garlich-Miller, Stewart, Stewart and Hiltz1993) prior to the animal's year of death. September sea ice cover was chosen for these analyses as this month typically represents the annual sea ice minimum and is therefore a sensitive indicator of climate changes.
RESULTS
The sea ice index indicated the presence of eight high-ice and seven low-ice intervals between 4100 and 50 cal yr BP (Fig. 2, Table 1). These high- and low-ice intervals closely matched Heusser et al.’s (Reference Heusser, Heusser and Peteet1985) reconstruction of air temperature in Southcentral Alaska (Fig. 2). They also aligned well with known climate anomalies such as the Little Ice Age (ca. 500–100 yr; cf. Grove, Reference Grove1988), Medieval Warm Period (ca. 1150–750 yr; cf. Broecker, Reference Broecker2001), Roman Warm Period (ca. 2500–1600 yr; cf. Wang et al., Reference Wang, Surge and Mithen2012), and Neoglacial period (ca. 3300–2500 yr; e.g., Porter and Denton, Reference Porter and Denton1967; Matthews and Dresser, Reference Matthews and Dresser2008; Wang et al., Reference Wang, Surge and Mithen2012). The satellite-era sea ice index generated using the three core locations had a strong, positive linear relationship with the annual percent ice cover in the Chukchi Sea from 1979 to 2016 (R 2 = 0.86, F 1,37 = 233.2, P < 0.001; Supplementary Fig. 1).
The Chukchi Sea ice index (thin blue line), overlaid by a 101 yr centered moving average (thick blue line), across the study period (4150–0 cal yr BP). For reference, the dashed orange line represents the Southcentral Alaska air temperature anomaly adapted from Heusser et al. (Reference Heusser, Heusser and Peteet1985). Positive values of the ice index indicate higher than average ice conditions. Negative values indicate lower than average ice conditions.

Date ranges (cal yr BP) of low and high sea ice intervals as defined by the Chukchi Sea ice index.

Assignment of archaeological walruses to high and low sea ice intervals resulted in 124 individuals from high-ice intervals and 88 individuals from low-ice intervals. The resampling approach used to investigate the possible impacts of incorrectly assigning walruses to high or low sea ice intervals demonstrated that improper assignments had little effect on the results of this study (Supplementary Fig. 2). The 95% confidence intervals for the mean δ13C and δ15N values from high (δ13C, −12.97‰ to −12.88‰; δ15N, 13.50–13.71‰) and low (δ13C, −13.17‰ to −13.05‰; δ15N, 13.48–13.72‰) sea ice intervals were narrow, indicating that improper assignments were unlikely to cause mean δ13C and δ15N to shift by more than ~0.1‰ and ~0.2‰, respectively, which is within the range of instrumental error.
The δ13C and δ15N values of walrus bone collagen in this study were consistent with published values for modern and archaeological walrus bone collagen in Alaska (Szpak et al., Reference Szpak, Buckley, Darwent and Richards2018). Results of the White-adjusted ANOVAs indicated significant differences in both δ13C (F 3,453 = 25.56, P < 0.001) and δ15N (F 3,453 = 41.98, P < 0.001) in walruses from high and low sea ice intervals, as well as the historic and modern periods. Post hoc tests revealed differences in δ13C among all periods except between modern individuals and archaeological walruses from low sea ice intervals, historic walruses and archaeological individuals from high sea ice intervals, and between archaeological walruses from intervals of high and low sea ice (Fig. 3, Table 2). For δ15N, post hoc tests showed significant differences among all groups except archaeological walruses from high and low sea ice intervals (Fig. 3, Table 2). Though the δ13C differences were significant, they were relatively small (maximum difference = 0.5‰, historic vs. modern walruses). The differences in δ15N were larger, with those between modern and archaeological walruses from both high and low sea ice intervals exceeding 1.0‰. SIBER demonstrated substantially larger niche width for archaeological walruses during intervals of low sea ice cover (SEAc = 2.94) as compared with high sea ice intervals (SEAc = 1.39). Ellipses are generated through an iterative, Bayesian process (Jackson et al., Reference Jackson, Inger, Parnell and Bearhop2011), and the proportion of these iterations in which the sizes of the ellipses differed can be used to evaluate the strength and consistency of these differences. In this study, low sea ice ellipses were larger than high sea ice ellipses 100% of the time. Despite the difference in ellipse size, there was 98% ellipse overlap, with the high-ice ellipse existing almost completely within the boundaries of the low-ice ellipse (Fig. 4).
Walrus bone collagen δ13C (left, blue) and δ15N (right, orange) from low-ice (4100–0 cal yr BP), high-ice (4100–0 cal yr BP), historic (AD 1880–2007), and modern (AD 2012–2016) periods. Dashed lines represent means, and shaded areas show the relative frequency and distribution of the data.

Scatter plot of δ13C and δ15N values of archaeological walrus bone collagen from intervals of high (blue circles) and low (red triangles) sea ice, as defined by the Chukchi Sea ice index. Stable Isotope Bayesian Ellipses in R (SIBER) indicate the niche width of each group, as quantified by the standard ellipse area corrected for small sample sizes (SEAc).

Mean differences in δ13C and δ15N in walrus bone collagen among intervals of high sea ice (4100–0 cal yr BP), intervals of low sea ice (4100–0 cal yr BP), and historic (AD 1880–2007) and modern (AD 2012–2016) periods. Bold values indicate significant differences (P < 0.05).

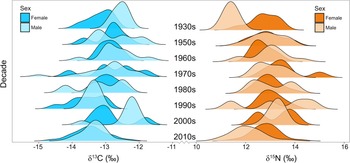
The results of the two-way ANOVA testing the effects of sex and decade on δ13C indicated that δ13C differed significantly among decades (F 7,208 = 11.56, P < 0.001), but not between sexes (F 1,208 = 2.63, P = 0.11). A Tukey's honest significant difference post hoc test revealed that these differences were primarily driven by the 1990s, which were different from all other decades except the 1930s and the 2010s, and by the 2010s, which were different from all other decades except the 1930s and 1990s (Fig. 5, Table 3). The results of the two-way ANOVA testing the effects of sex and decade on δ15N revealed that both the main effects (sex: F 1,201 = 29.71, P < 0.001; decade: F 7,201 = 23.99, P < 0.001) and the interaction term (sex × decade: F 7,201 = 4.01, P < 0.001) were significant. Because the interaction was significant, the main effects were not examined directly. To examine the simple main effects, the data were divided by sex, and one-way ANOVAs were run to test for differences among decades for males and females. Males had unequal variances among decades for δ15N, so a White-adjusted ANOVA and DTK post hoc test was used. The ANOVA indicated differences in male δ15N among decades (F 7,107 = 26.79, P < 0.001). The post hoc test showed that these differences were driven by the 1930s, which were significantly different from all other decades except the 1990s, and by the 2010s, which in turn were significantly different from all other decades except for the 1980s and 1990s. Female walruses had equal variances in δ15N among decades, so the White adjustment was not applied to the ANOVA. Results of the ANOVA were not significant (F 7,94 = 1.97, P = 0.07), indicating that female δ15N did not differ among decades (Fig. 5, Table 3).
Walrus bone collagen δ13C (left, blue) and δ15N (right, orange) from the 1930s, 1950s, 1960s, 1970s, 1980s, 1990s, 2000s, and 2010s. Darker colors represent females, and lighter colors represent males. The shaded areas show the relative frequency and distribution of the data for each decade.

Decadal differences in mean bone collagen δ13C for pooled samples of male and female walruses and δ15N split by sex. Bold values indicate significant differences (P < 0.05).

Linear regressions showed positive correlations between δ13C and September Chukchi Sea ice cover in the 16 yr prior to each animal's year of death for both male and female walruses. In contrast, δ15N was only correlated with September Chukchi Sea ice cover in male walruses (Fig. 6). The regression parameters between δ13C and sea ice were nearly identical for male (y = 0.01x − 13.50, R 2 = 0.16, F 1,116 = 21.86, P < 0.001) and female (y = 0.01x − 13.66, R 2 = 0.15, F 1,100 = 17.68, P < 0.001) walruses. Female δ15N values were not correlated with September Chukchi Sea ice cover (F 1,100 = 1.79, P = 0.18), whereas male δ15N had a positive correlation with sea ice (y = 0.02x + 11.82, R 2 = 0.22, F 1,116 = 32.75, P < 0.001).
Linear regressions of male (light-colored circles) and female (dark-colored triangles) walrus bone collagen δ13C (left, blue) and δ15N (right, orange) and September Chukchi Sea ice extent. Regression equations and R 2 values are given in the graphs for significant (P < 0.05) linear relationships.

DISCUSSION
The Chukchi Sea ice index
The validity of the ice index generated using dinocyst data from three Chukchi Sea sediment cores is supported by an inverse relationship with Heusser et al.’s (Reference Heusser, Heusser and Peteet1985) palynological reconstruction of air temperature in Southcentral Alaska (Fig. 2). Heusser et al. (Reference Heusser, Heusser and Peteet1985) indicated that the variability in their air temperature reconstruction likely resulted primarily from changes in the Aleutian Low pressure system, a dominant driver of weather patterns in the North Pacific. The strength and longitudinal position of the Aleutian Low strongly influence Bering Sea ice conditions (Rodionov et al., Reference Rodionov, Bond and Overland2007) and the flow of water through the Bering Strait (Danielson et al., Reference Danielson, Weingartner, Hedstrom, Aagaard, Woodgate, Curchitser and Stabeno2014) and thus are directly linked to sea ice extent in the Chukchi Sea. Furthermore, the strong, positive correlation between the satellite-era ice index and the annual percent ice cover in the Chukchi Sea supports the use of these sediment cores as proxies for the broader regional climate (Supplementary Fig. 1). Given the strong links between Chukchi Sea ice cover, the Aleutian Low pressure system, and the Bering Sea climate, it is likely that the ice index is also correlated with environmental conditions (though not necessarily sea ice cover) in the Bering Sea. This supports the assertion that the ice index is an indicator of climatic conditions across Pacific walruses' geographic range and, thus, an appropriate tool for examining the effects of past environmental change on the species.
The sea ice index aligns closely with established global climate anomalies during the last ~4000 yr. For example, the Little Ice Age, a cold period extending from ~500 to 100 yr (Grove, Reference Grove1988), is represented in the ice index as an interval of relatively high sea ice cover between 430 and 270 cal yr BP. Another relatively recent global climate anomaly, the Medieval Warm Period (~1150–750 yr; Broecker, Reference Broecker2001), overlapped substantially with an interval of sustained low sea ice cover in the ice index extending from 1311 to 828 cal yr BP. The expressions of the Little Ice Age and the Medieval Warm Period in the ice index also closely match the timing of these two climate anomalies in North America (Ljungqvist, Reference Ljungqvist, Simard and Austin2010). The Roman Warm Period extended from ~2300 to 1550 yr in North America (Viau et al., Reference Viau, Gajewski, Sawada and Fines2006), corresponding with generally lower than average ice conditions in the index from 2452 to 1385 cal yr BP, though this period was interrupted by a high-ice interval from 1978 to 1732 cal yr BP. Finally, sustained high sea ice conditions from 3346 to 2453 cal yr BP matched the timing of glacial advances associated with the Neoglacial period in North America (Kaufman et al., Reference Kaufman, Axford, Henderson, McKay, Oswald, Saenger and Anderson2016).
These consistencies with global and hemispheric climate anomalies captured by the ice index are not surprising, as regional variability in the Bering and Chukchi Seas is inherently linked to the processes driving global climate patterns. The atmospheric dynamics of the North Pacific and North Atlantic are directly connected by those of the Arctic. The Arctic Oscillation, an index describing variations in sea level pressure across the Arctic region (Thompson and Wallace, Reference Thompson and Wallace1998), is strongly correlated with both the North Atlantic Oscillation (Dickson et al., Reference Dickson, Osborn, Hurrell, Meincke, Blindheim, Adlandsvik, Vinje, Alekseev and Maslowski2000) and Pacific Decadal Oscillation (PDO; Sun and Wang, Reference Sun and Wang2006). The PDO is, in part, determined by the strength and position of the Aleutian Low, which is correlated with major North Atlantic circulation features (Kutzbach, Reference Kutzbach1970). The changes in Chukchi Sea ice cover during the last ~4000 yr recorded in the ice index are thus a product of these global and hemispheric climate drivers, as modulated by regional and local conditions.
Walrus dietary shifts across broad time scales
Mean δ13C and δ15N of walruses that lived during intervals of high and low Chukchi Sea ice cover over the last ~4000 yr were remarkably similar, with differences in isotopic compositions falling within instrumental error (~0.2‰; Table 2). Despite the similarity in the mean isotope values between high- and low-ice conditions, however, the variability in δ13C and δ15N was greater for walruses that lived in low sea ice conditions. Though the minimum and maximum values of δ13C and δ15N (δ13C, −15.8‰ to −11.9‰; δ15N, 11.1–16.3‰) were similar during low- and high-ice intervals, the standard deviations were greater when sea ice cover was low. This resulted in differences in the shapes of the δ13C and δ15N distributions, with most individuals tightly clustered around the mean values during high-ice intervals, in contrast to the broader spread of data during low-ice intervals. Taken together, this information indicates that the walrus population generally occupied the same trophic space (overall range of δ13C and δ15N) during intervals of high and low sea ice; however, diet was more variable among individuals when sea ice cover was low. This can be seen in Figures 2 and 3, which show a tighter distribution in δ13C and δ15N values during high-ice intervals.
There are a variety of possible reasons for the observed differences in walrus δ13C and δ15N variability among high and low sea ice intervals. Perhaps the most likely explanation is a shift in prey abundance that increased intraspecific competition for preferred prey species during low sea ice intervals. Optimal foraging theory (OFT) predicts that when preferred food resources are scarce or absent, individuals will broaden their diet to include resources that were previously unused and/or consume higher proportions of lower-ranked resources (Stephens and Krebs, Reference Stephens and Krebs1986). Increased diet breadth alone, however, would not necessarily result in differences among the stable isotope ratios of individuals. For variability in δ13C and δ15N among individuals to increase, walruses would need to exhibit some degree of dietary specialization, such that different individuals consumed isotopically distinct diets. This between-individual variation can be driven by numerous factors, including phenotypic differences that allow individuals to better exploit certain types of resources (Svanbäck and Bolnick, Reference Svanbäck and Bolnick2007), different dietary preferences and optimization criteria (Schoener, Reference Schoener1971), and factors such as social hierarchies that differentially affect the abilities of individuals to access resources (Sol et al., Reference Sol, Elie, Marcoux, Chrostovsky, Porcher and Lefebvre2005). Though it is often considered to be a sign of resource scarcity (Bolnick et al., Reference Bolnick, Svanbäck, Fordyce, Yang, Davis, Hulsey and Forister2003; Tinker et al., Reference Tinker, Bentall and Estes2008), OFT suggests that increased dietary specialization can result from a decrease in the availability of preferred prey, even when lower-ranked prey items are plentiful (Stephens and Krebs, Reference Stephens and Krebs1986). For walruses, decreased availability of their preferred benthic bivalve prey because of environmental shifts or increased walrus abundance during previous low sea ice intervals might have led to increased dietary specialization among individuals at these times. Sea ice allows walruses to easily access offshore benthic hot spots, typically rich in benthic bivalves (Grebmeier et al., Reference Grebmeier, Bluhm, Cooper, Danielson, Arrigo, Blanchard and Clarke2015a); thus, reduced availability of preferred walrus prey during low sea ice intervals may have resulted from a change in the ability of walruses to access these prey resources, rather than a shift in the abundance of benthic invertebrates.
Although it is possible that the observed increase in diet variability among individual walruses in this study resulted from resource stress, this seems unlikely for two reasons. First, though walruses consume a wide variety of prey items even when food resources are plentiful (Fay, Reference Fay1982; Sheffield and Grebmeier, Reference Sheffield and Grebmeier2009), if food became severely limiting, it would be expected that their diet would broaden further and that the observed ranges of δ13C and δ15N values would increase. However, archaeological walruses from high and low sea ice intervals had similar ranges of δ13C and δ15N (Fig. 4). Second, in a situation where food resources were limiting and animals were in a state of chronic nutritional stress, we would expect to see an increase in δ15N (Hobson et al., Reference Hobson, Alisauskas and Clark1993), at least for animals experiencing starvation. The δ15N values of walruses from high and low sea ice intervals were similar and had a slightly lower maximum during low-ice intervals, so chronic nutritional stress is unlikely. It is important to remember when interpreting these results, that δ13C and δ15N from bone collagen represent a lifetime average of walrus diet (Manolagas, Reference Manolagas2000); thus, for a distinct isotopic signal to be preserved in the collagen, changes in diet would need to last for many years. Marine mammals are highly adapted to extended fasting and can survive on lipid reserves for long periods without having to catabolize muscle proteins (Castellini and Rea, Reference Castellini and Rea1992). Given this, it is possible that walruses experienced some degree of resource scarcity and nutritional stress during low-ice intervals; however, it is unlikely that this would leave a detectable signal in bone collagen δ13C and δ15N.
Mean δ13C and δ15N of walruses from the historic and modern periods differed markedly, in contrast to the stable isotope values of archaeological walruses. Most notably, δ15N was lower in the historic samples than in past intervals of high and low sea ice cover and decreased further in the modern samples, which were significantly distinct from all other periods. These results indicate that the Pacific walrus population is currently occupying a lower average trophic position than at any point in the last ~135 yr, and possibly even in the last ~4000 yr. Though the mean δ15N of modern specimens was lower than that of archaeological walruses from either high or low sea ice conditions, the range of modern values fell within the ranges of both ice states (Fig. 3). This indicates that walruses may have occupied a similarly low trophic position at other times in the past. Regardless of whether the diet of modern walruses is unprecedented in the last ~4000 yr, it is clear that walruses harvested in the 2010s had eaten proportionally more lower-trophic-level prey than animals at most other times in the past. These low δ15N values likely mean that these walruses foraged primarily on benthic bivalves, which are typically primary consumers and have low δ15N values as compared with other benthic invertebrates (Dehn et al., Reference Dehn, Sheffield, Follmann, Duffy, Thomas and O'Hara2007; Tu et al., Reference Tu, Blanchard, Iken and Horstmann-Dehn2015). It has been suggested that the proportion of higher-trophic-level prey (e.g., ice seals and seabirds) in walrus diet has increased as a result of Arctic sea ice loss (Seymour et al., Reference Seymour, Horstmann-Dehn and Wooller2014b). The results presented here indicate no difference in the average trophic position of the Pacific walrus population between past intervals of high and low sea ice conditions. Instead, they suggest that most modern walruses have decreased their lifetime consumption of higher-trophic-level prey.
Regional and sex-related differences in δ15N cannot be ruled out as sources of variation in this study. Because male and female walruses spend their summers foraging in different regions (Fay, Reference Fay1982), the effects of location and sex on walrus stable isotope ratios are difficult to disentangle. The sex ratio of walruses from the modern period (27 females/48 males) was weighted more toward males than that of the historic period (74 females/67 males), whereas the sex ratio of the archaeological samples remains unknown. Sex-related differences in δ13C observed in this study were small (<0.2‰); however, it is likely that some of the observed differences in δ15N among time periods in this study resulted from sex-related differences and unequal sex ratios. From the historic to the modern period, mean δ15N declined by 0.6‰. During this same period, the magnitude of the sex-related difference in δ15N changed as well. In the historic period, male and female δ15N values were identical, whereas in the modern period, mean male δ15N was 0.7‰ lower than that of females. This change, coupled with the difference in the sex ratios between the historic and modern periods, likely accounted for ~0.5‰ of the observed 0.6‰ decline in δ15N in the modern samples. Presumably, similar changes in the δ15N offset between males and females and a difference in the sex ratio of the archaeological samples could be responsible for at least some of the observed differences between the archaeological and historic/modern samples. However, the importance of those factors as sources of variation in δ15N is unknown. Sex information was not available for the archaeological specimens; thus differences in sample sex ratios and changes in the magnitude of sex-related isotopic differences through time could not be estimated. It is important to note that these results do not mean that a change in δ15N did not occur between these periods. Instead, they indicate that the observed change in δ15N from the historic to the modern period was driven almost entirely by males. This also means that males were primarily responsible for the apparent shift to a lower average trophic position in the modern period, and that the diet of females remains essentially unchanged.
Dietary shifts may not have been the only factors driving the changes in δ15N observed in this study. Baseline δ15N values are determined primarily by the sources of nitrogen available to primary producers, which may vary through time and space (Fogel and Cifuentes, Reference Fogel, Cifuentes, Engel and Macko1993). Establishing isotopic baselines can be difficult, particularly for historic and archaeological time frames, where directly sampling primary producers is not possible (Casey and Post, Reference Casey and Post2011). Efforts have been made to infer historical changes in isotopic baselines using preserved animal specimens (e.g., Newsome et al., Reference Newsome, Etnier, Kurle, Waldbauer, Chamberlain and Koch2007; Wiley et al., Reference Wiley, Ostrom, Welch, Fleischer, Gandhi, Southon and Stafford2013; Szpak et al., Reference Szpak, Buckley, Darwent and Richards2018). Misarti et al. (Reference Misarti, Finney, Maschner and Wooller2009) examined modern and archaeological stable isotope ratios of bone collagen from Sanak Island in the northwest Gulf of Alaska (one of the sites from which walrus bones were used in this study). These authors found that δ15N values of sea otter (Enhydra lutris) bone collagen were significantly lower in modern samples compared with archaeological bone; however, no significant declines in δ15N were observed for Steller sea lions (Eumatopias jubatus), harbor seals (Phoca vitulina), northern fur seals (Callorhinus ursinus), Pacific cod (Gadus macrocephalus), or sockeye salmon (Oncorhynchus nerka). Unfortunately, such studies have primarily been conducted on higher-trophic-level organisms, and separating dietary changes from baseline shifts remains difficult. Recently, compound-specific stable isotope analysis of amino acids (CSIA-AA) has emerged as a potential solution to this problem. The δ15N values of some amino acids (the so-called source amino acids) do not experience trophic enrichment. Instead, they reflect the δ15N values at the base of the food chain (Chikaraishi et al., Reference Chikaraishi, Ogawa, Kashiyama, Takano, Suga, Tomitani, Miyashita, Kitazato and Ohkouchi2009; McClelland and Montoya, Reference McClelland and Montoya2017). Thus, by measuring the δ15N values of these source amino acids in preserved specimens, a long-term baseline can be reconstructed. Misarti et al. (Reference Misarti, Gier, Finney, Barnes and McCarthy2017) investigated the feasibility of using CSIA-AA on archaeological shell to reconstruct isotopic baselines. Their samples from Sanak Island did not provide evidence for directional baseline shifts in δ15N in the last ~1500 yr. Recent CSIA-AA conducted on polar bear (Ursus maritimus) bone collagen from Alaska showed no significant changes in δ15N of source amino acids between archaeological, historic, and modern samples (Horstmann et al., Reference Horstmann, Stimmelmayr and McCarthy2017). Though it remains possible that baseline changes in δ15N were responsible for the patterns observed in this study, the results of these studies do not support this hypothesis.
The δ13C values of walruses from the historic and modern periods provided support for the ice state assignments of the archaeological samples. Modern walruses, which lived during an interval of rapidly declining sea ice cover, had δ13C values that were similar to those of walruses from previous low sea ice intervals and different from both the historic walruses and archaeological walruses from intervals of high sea ice. Conversely, δ13C values of walruses from the historic period, an interval of relatively high sea ice cover, were similar to those of animals from previous high sea ice intervals and different from those of modern walruses and animals from previous intervals of low sea ice. Taken together, these results indicate that walrus bone collagen δ13C is changing with sea ice conditions. The exact mechanisms responsible for the observed shifts in δ13C remain unknown. These changes may have resulted from differences in walrus diet during high and low sea ice cover; however, it is perhaps more likely that the correlation between δ13C and sea ice conditions resulted from shifts in baseline δ13C values associated with changing oceanographic conditions and sources of primary production.
Decadal shifts in δ13C and δ15N
Because more information was available for historic and modern samples, including collection year, sex, and estimated age for many animals, we were able to conduct finer-scale investigations of changes in δ13C and δ15N. Additionally, more accurate ice estimates allowed for direct inspection of the correlation between walrus bone collagen stable isotope ratios and Chukchi Sea ice conditions. As with the broader time periods, δ15N exhibited the most substantial differences in the historic and modern samples (Fig. 5). These differences were apparently restricted to male walruses, as female δ15N did not change among decades, whereas males had lower δ15N values in the 1930s and 2010s. Interestingly, there was a shift in the 1920s from a sustained state of high (~75%) September Chukchi Sea ice cover to a state of sustained lower (~60%) September ice cover (Walsh et al., Reference Walsh, Fetterer, Scott Stewart and Chapman2017). Given that walrus bone collagen δ13C and δ15N represent a lifetime average (~16 yr in this study, based on age estimates from tooth annuli) of diet and conditions experienced by an animal, it is possible that the changes observed in the 1930s were a response to the shift from a higher to a lower ice state in the 1920s. The samples from the 2010s showed a similar pattern to those from the 1930s; however, it is difficult to say whether these similarities are driven by changing ice conditions or by other factors, such as changing prey availability in male summer habitat, regionally variable baseline shifts, or changes to migratory behavior of male walruses.
Direct examination of the relationship between walrus δ15N values and September Chukchi Sea ice cover supported the results of the decadal comparisons. Female δ15N values were not correlated with September Chukchi Sea ice cover, whereas male δ15N was positively related to ice cover. Though the nature of the relationship between sea ice and δ15N of male walruses remains unclear, it is likely that September Chukchi Sea ice cover did not directly influence the stable isotope ratios of males and, instead, simply acted as a proxy for other changes that have occurred in the male summer habitat. Male walruses typically spend summers in Bristol Bay, Alaska, and along the Russian coastline (Fay, Reference Fay1982). Chukchi Sea ice cover has declined steadily since the 1980s (Walsh et al., Reference Walsh, Fetterer, Scott Stewart and Chapman2017); thus it can be expected that this measure will be strongly correlated with many other variables associated with changes to regional climate, including Arctic warming and factors associated with the major regime shift that occurred in the North Pacific and Bering Sea in the late 1970s (Ebbesmeyer et al., Reference Ebbesmeyer, Cayan, McLain, Nichols, Peterson, Redmond, Betancourt and Tharp1991). This regime shift has been linked to changes in Bering Sea ice cover (Niebauer, Reference Niebauer1998), as well as alterations in species compositions and abundances in fish communities, changes to benthic invertebrate community structure on the Bering Sea shelf (Coyle et al., Reference Coyle, Konar, Blanchard, Highsmith, Carroll, Carroll, Denisenko and Sirenko2007), and a nearly linear increase in the biomass of noncrab benthic invertebrates in Bristol Bay bottom trawls since the early 1980s (Conners et al., Reference Conners, Hollowed and Brown2002). It is these last two factors that are most likely to have led to the decline in δ15N of male walruses in recent decades, as shifts in the structure of benthic communities and increased abundance of benthic invertebrates likely led male walruses to consume a greater proportion of bivalve prey, thus lowering their average trophic position. The changes in community composition and food web structure attributed to this regime shift may also have been tied to the trend of regional warming that took place at the same time (Grebmeier, Reference Grebmeier2012). Benthic communities in the Chukchi Sea, though undergoing changes, were comparably stable across the same period (Grebmeier et al., Reference Grebmeier, Bluhm, Cooper, Denisenko, Iken, Kedra and Serratos2015b), perhaps explaining why female δ15N did not change as sea ice declined. Finally, it has been suggested that the proportion of male walruses accompanying the females and calves on their northward journey has increased as the Arctic climate has warmed (Garlich-Miller et al., Reference Garlich-Miller, MacCracken, Snyder, Meehan, Myers, Wilder, Lance and Matz2011). A change in summer migratory destination could lead to a decline in δ15N for male walruses; however, if this were the case, male δ15N values would be expected to become more similar to female δ15N values as sea ice declined. Instead, the opposite is true, and average male δ15N has diverged from that of females.
Mean decadal δ13C values did not differ between sexes and remained relatively constant through time, in contrast to δ15N. The exceptions to this general stability in δ13C were the 1990s and 2010s, which had lower values than other decades (Fig. 5). It is unclear why the first decade of the 2000s had significantly less negative δ13C values than the 1990s and 2010s. Perhaps the most interesting feature of the historic δ13C data was not a shift in mean values, but a change in δ13C variability among decades. Fay et al. (Reference Fay, Kelly and Sease1989) reported that the Pacific walrus population reached and possibly exceeded carrying capacity in the late 1970s and early 1980s. At this time, food resources were apparently limiting, and Alaska Native subsistence hunters reported that animals were generally leaner and age at first reproduction increased. In the present study, the δ13C values of both male and female walruses from the 1970s exhibited greater variability and a broader distribution than during other decades. This could be interpreted as an indication of increased variation in diet among individuals resulting from increased competition for food resources, as predicted by OFT (Stephens and Krebs, Reference Stephens and Krebs1986). This, in turn, would support the hypothesis that the greater variability in δ13C among individuals from intervals of low sea ice was driven by limited access to preferred prey items. However, the apparent variability in the diet of walruses in the 1970s could also have resulted from the regime shift that caused major changes to regional ecosystems and food webs around 1976/1977 (Ebbesmeyer et al., Reference Ebbesmeyer, Cayan, McLain, Nichols, Peterson, Redmond, Betancourt and Tharp1991). In either case, these changes appear in the walrus bone collagen stable isotope ratios earlier than would be expected given the timing of these events, as δ13C and δ15N of walruses that lived during the 1970s would be expected to represent an average of diet extending back into the 1960s and, for some individuals, the 1950s. It is worth noting that the walruses from the 2010s had a narrower distribution of δ13C values, evidence that walrus access to preferred prey items has not been limiting in recent years.
The effects of declining ice algal production on δ13C
The mean δ13C of modern walruses in this study was significantly lower than that of walruses from the historic period, and from that of archaeological walruses from intervals of high and low sea ice. A decrease in δ13C values in modern samples was not unexpected. Sea ice algae tend to have less negative δ13C values than pelagic phytoplankton (e.g., Oxtoby et al., Reference Oxtoby, Mathis, Juranek and Wooller2016), and, as sea ice declines, the contribution of sea ice algae to total primary production in the region will decrease. As a result, δ13C values are expected to shift toward more negative (pelagic) values as sea ice in the region continues to decline. This idea was more directly examined by investigating the correlation between September Chukchi sea ice extent and walrus bone collagen δ13C. Though δ13C of both male and female walruses was positively correlated with ice extent, these relationships were weak (Fig. 6). The slope of the regression lines for both sexes was 0.01, meaning that a shift from 100% to 0% ice cover would result in only 1‰ change in δ13C. Additionally, the correlation between sea ice cover and δ13C explained only a small portion of the variability in δ13C, indicating that other factors are more important in determining the δ13C of walrus bone collagen. This is not surprising as many other factors affect δ13C values, including diet, foraging location, and animal physiology (Newsome et al., Reference Newsome, Clementz and Koch2010).
Climate-driven food web shifts
Finally, it has been suggested that sea ice loss in the Arctic will lead to food webs with a greater number of trophic levels, as warming waters and increased atmospheric CO2 concentrations cause shifts toward a system dominated by smaller, pelagic phytoplankton species (Li et al., Reference Li, McLaughlin, Lovejoy and Carmack2009; Kȩdra et al., Reference Kȩdra, Moritz, Choy, David, Degen, Duerksen and Ellingsen2015). This proportional decline in the larger nanoplankton (average cell diameter = 2–20 µm) and increase in picoplankton (average cell diameter <2 µm) is expected to lead to decreased benthic production, as slower sinking speeds and increased grazing cause a greater proportion of primary production in the region to be consumed or degraded before reaching the seafloor (Wassmann and Reigstad, Reference Wassmann and Reigstad2011). The results of this study challenge these hypotheses. A system with longer food webs would be expected to cause walrus δ15N to increase, as the number of trophic steps between walrus prey and the system's primary producers increased. Similarly, diminished benthic-pelagic coupling is expected to lead to depauperate benthic systems, which would lead to decreased availability of benthic bivalves, walruses' preferred prey (Sheffield and Grebmeier, Reference Sheffield and Grebmeier2009), and would likely lead to an increased proportion of higher-trophic-level prey in walrus diet or increased diet variation among individuals, as suggested by Seymour et al. (Reference Seymour, Horstmann-Dehn and Wooller2014a, Reference Seymour, Horstmann-Dehn and Wooller2014b). In this study, we found no difference in mean δ15N of archaeological walruses from intervals of high and low sea ice cover in the Chukchi Sea, though increased variability in δ13C and δ15N during low sea ice intervals may have resulted from changes in prey availability. The only substantial change in δ15N observed in this study was a decline of ~1.0‰ in modern animals. These results suggest that the number of trophic levels in the food webs leading to walruses in the Bering and Chukchi Seas is not increasing. Instead, the low δ15N values in modern walruses and the relatively low degree of δ15N variability among individuals in this time period suggest that walruses are foraging on plentiful, lower-trophic-level prey, a conclusion that is supported by studies of walrus space and resource use in recent years (Jay et al., Reference Jay, Grebmeier, Fischbach, McDonald, Cooper and Hornsby2014; Beatty et al., Reference Beatty, Jay, Fischbach, Grebmeier, Taylor, Blanchard and Jewett2016).
CONCLUSIONS
The ~4000 yr index of Chukchi Sea ice conditions presented herein matches well with known climate anomalies and demonstrates that data from multiple sediment cores can be directly combined to provide a more representative estimate of regional climate. Archaeological walrus specimens assigned to high and low sea ice intervals defined by this index indicated that the trophic space occupied by walruses was similar among ice states; however, diet variability among individuals increased during low-ice intervals, possibly resulting from reduced access to preferred prey at those times. Analysis of the historic and modern samples supported the hypothesis that δ13C values in the Bering and Chukchi Seas have declined as the proportional input of sea ice algae into food webs has decreased; however, results from our walrus data indicate these changes have so far been small. Sea ice conditions were more strongly correlated with δ15N of male walruses, though Chukchi Sea ice was likely not the factor driving these changes and was instead serving as a proxy for concurrent changes in male walrus summer habitats. Overall, variable sea ice did not appear to be a major driver of change in walrus diet during the last ~4000 years. Perhaps most interestingly, the modern walruses examined for this study were isotopically distinct from archaeological walruses that lived in high and low sea ice intervals, as well as during the last ~135 years, suggesting that changes currently underway in this region are unlike any others that occurred during the study period.
Though the results presented here imply little change in walrus diet with past sea ice loss, the environmental changes currently taking place in the Arctic are occurring at an unprecedented rate. This might mean that previous low sea ice intervals, at least within the last 4000 yr, are not appropriate analogs for the current warming of the Arctic. Additionally, the ongoing changes to the Arctic climate are accompanied by other large-scale perturbations not present during previous intervals of warming (e.g., anthropogenic CO2 input, increased intensity of human use of the Arctic, and introduction of chemical contaminants into marine ecosystems). It is likely that high atmospheric and aqueous CO2 concentrations will eventually drive shifts in the physiology of Arctic plants and animals (Kȩdra et al., Reference Kȩdra, Moritz, Choy, David, Degen, Duerksen and Ellingsen2015). Coupled with the associated ocean acidification, these changes are likely to affect primary producers and benthic invertebrate populations (Fabry et al., Reference Fabry, McClintock, Mathis and Grebmeier2009). Large-scale removal of great whales and walruses from the Bering and Chukchi Seas in the nineteenth and twentieth centuries, paired with increasing extent and intensity of fisheries in the North Pacific and Bering Sea have substantially altered ecosystems in these regions in ways that are not well understood (e.g., Springer et al., Reference Springer, Estes, van Vliet, Williams, Doak, Danner, Forney and Pfister2003).
It is important to note that the largest changes in δ13C and δ15N observed during the ~4000 yr reconstruction of walrus diet presented in this article occurred in the last two decades. Though this is likely attributable, in part, to the relatively short window of time represented by these samples, as compared with the broad archaeological time periods, which average a variety of environmental conditions, these isotopic changes may represent a previously unobserved shift in walrus diet. Given the substantial lag between dietary shifts and their impacts on stable isotope ratios in bone collagen, it is likely that the actual changes in walrus diet are more substantial than those captured in the specimens used for this study. Continued examinations of walrus diet and population health should be employed to track the changes that are currently underway. Future studies using compound-specific stable isotope analysis would be especially valuable for gaining further insight into the more complex aspects of walrus dietary changes and potential baseline shifts through time.
ACKNOWLEDGMENTS
Thanks to the Alaska Native subsistence hunters, Eskimo Walrus Commission, USFWS, North Slope Borough Department of Wildlife Management, Alaska Department of Fish and Game, University of Alaska Museum, National Museum of Natural History (Smithsonian Institution), and the Alaska Stable Isotope Facility. This work would not have been possible without field and laboratory support from P. Charapata, C. Heninger, H. Heniff, B. Lyon, C. Markel, Z. Robinson, C. Sessum, H. Starbuck, E. Van Dam, L. Wendling, and C. Winter. Many thanks to B. Konar, P. Lemons, and K. Severin for providing input and feedback on this research. This work was funded by the National Science Foundation Arctic SEES Program, grant no. 1263848, with supplementary funds from the Bureau of Ocean Energy Management. Additional funding was provided by the North Pacific Research Board and the National Institutes for Health Biomedical Learning and Student Training Program at the University of Alaska Fairbanks. Research reported in this publication was supported by the National Institute of General Medical Sciences of the National Institutes of Health under award numbers UL1GM118991, TL4GM118992, or RL5GM118990. The content is solely the responsibility of the authors and does not necessarily represent the official views of the National Institutes of Health. The University of Alaska is an AA/EO employer and educational institution and prohibits illegal discrimination against any individual: http://www.alaska.edu/titleIXcompliance/nondiscrimination.
SUPPLEMENTARY MATERIAL
The supplementary material for this article can be found at https://doi.org/10.1017/qua.2018.140.