

INTRODUCTION
Polychaeta play an important role in the marine environment as they are involved in mineralization, promoting and mixing of sediments, flux of oxygen into sediments and cycling of organic matter (Snelgrove, Reference Snelgrove1998; Heilskov & Holmer, Reference Heilskov and Holmer2001). These organisms show a large variety of feeding type and strategies at many levels of the marine food web (Fauchald & Jumars, Reference Fauchald and Jumars1979). Also, they are one of the most abundant food items for birds, fish and epibenthic invertebrates (Nybakken, Reference Nybakken1993). On the other hand, they are used as indicators for environmental monitoring programmes (Pocklington & Wells, Reference Pocklington and Wells1992).
Generally, seasonal changes in community structure of macrofauna can be related to reproduction activity, predator pressure, food source and competition (Nybakken, Reference Nybakken1993; Mistri et al., Reference Mistri, Fano, Ghion and Rossi2002; Kevrekidis, Reference Kevrekidis2005) but in the Indian Ocean they are related to the monsoon period, as the lowest density and number of species were observed during monsoon (Harkantra & Parulekar, Reference Harkantra and Parulekar1985; Nybakken, Reference Nybakken1993; Nikouyan & Savari, Reference Nikouyan and Savari1999; Ibrahim et al., Reference Ibrahim, Wan Hussin, Kassim, Joni, Zakaria and Hajisamae2006). The intertidal zone is perhaps the best known area of the world's oceans because it is the most accessible to humans (Nybakken, Reference Nybakken1993) but unfortunately, the northern coast of Oman Gulf coast is largely unknown with regard to its polychaete fauna. The purpose of this paper was to study biodiversity and community structure of intertidal sandy beach polychaetes at Chabahar Bay during different monsoon periods.
MATERIALS AND METHODS
Study area
Chabahar Bay, with an area of around 320 km2, is the largest bay in the north-east of Oman Gulf along the Sistan and Baluchestan Province, Iran. The average depth of this bay is 6 m while the deepest part of it is about 20 m. No major rivers exist in the vicinity. This bay has a tropical climate characterized by monsoon (May–September), post monsoon (October–February) and pre monsoon (March–April). Unlike the other places in the Indian Ocean, no rainfall occurs during monsoon in this area and the weather is dry (arid area) with a yearly rainfall of less than 200 mm. Tiss and Konarak are microtidal beaches located in the east and west of Chabahar Bay (Figure 1). The gradient and structure of the intertidal area in sampled sites was uniform and no macroalga was observed. During this study, tidal currents were between −0.2 and 0.2 m while intertidal widths were 75–95 m. Sampling was conducted off Tiss and Konarak in an area defined by coordinates 25°21′49″–60°36′37″E and 25°24′90″–60°25′99″N.
Map of sampling area.

Data collection
Samplings were carried out at low tide during pre monsoon (April), monsoon (May–September) and post monsoon (October–February) at both stations. It is necessary to say that due to some problems we could not sample at Konarak in June. At the beginning of each month, the intertidal zone (between the drift line and the water line) was divided into upper, middle and lower regions and at each region, seven cores (12 cm diameter and 20 ± 1 cm depth) were randomly taken with a distance of 10 m between them totalling 21 cores at each station (Pridmore et al., Reference Pridmore, Thrush, Hewitt and Roper1990; Honkoop et al., Reference Honkoop, Pearson, Lavaleye and Piersma2006). The contents of each core were gently sieved by using a 0.5-mm mesh and retained material fixed in 4% buffered formalin and stained with rose Bengal (Abrantes et al., Reference Abrantes, Pinto and Moreira1999). In the laboratory, polychaetes were sorted under stereomicroscope, identified and counted. Whenever we saw fragmentation of worms, only prostomium-bearing fragments would count (Mistri et al., Reference Mistri, Fano, Ghion and Rossi2002).
For particle size analysis, three sediment samples were taken with a plastic corer of 3 cm diameter to a depth of 10 cm at each sampling. To determine sediment particle size, nearly 200 g of each core sample was submitted to a standard dry-sieve through a series of mesh sizes (from 63 µm to 2 mm) and mechanically shaken for 10 minutes. The sediments retained on each sieve were weighed and the percentage of each granulometric category was determined (Diaz-Castaneda & Harris, Reference Diaz-Castaneda and Harris2004).
Monthly mean of water and air temperatures and speed of wind were obtained from the Iranian National Centre for Oceanography (INCO) at Chabahar, which is located around 4 km west of Chabahar Bay (25°16′820″N 60°39′118″E).
Macrobenthic community structure was described by univariate analaysis based on the following parameters: density, species number (S), diversity (as Shannon–Wiener's, H), richness (as Margalef's, D), and evenness (as Pielou's, J). The mentioned parameter values per square metre were calculated at each beach by averaging all replicates (Velso & Cardoso, Reference Velso and Cardoso2001; Haiyan et al., Reference Haiyan, Xinzheng, Baoquan, Jinbao and Hongfa2006). Prior to analysis, data were tested for normality (using Shapiro–Wilk) and homogeneity of variance (using Levene's test). Significance of all tests was accepted at P < 0.05. Whenever data were normal and homogeneous, two-way analysis of variance (ANOVA) (station × month) was used to test for temporal and spatial differences in the physical parameters (sand and silt–clay per cent) and biological parameters (density, diversity, richness and evenness). Tukey's test was used to assess significant differences between beaches and months. The significance level adopted was P < 0.05. The correlation of these indices with per cent sand and silt–clay, also air and water temperatures were determined using the Pearson's rank correlation coefficient. The frequency of occurrence (F%) of the species was calculated according to Arasaki et al. (Reference Arasaki, Muniz and Pires2004). Based on this, we classified the species as constant (F > 50%), common (10% ≤ F ≤ 50%) and rare (F < 10%). Identified polychaetes were grouped into feeding guilds according to Fauchald & Jumars (Reference Fauchald and Jumars1979) and Rouse & Pleijel (Reference Rouse and Pleijel2001). Four trophic groups were considered: carnivores (CA); surface deposit feeder (SDF); subsurface deposit feeder (SSDF); and grazer (GA). Data on the density of species were employing multivariate statistical methods of classification and ordination. The data were transformed by logarithm. Species with one individual were eliminated. Similarity was calculated using the Ward's method of the minimum variance (Muniz & Pires, Reference Muniz and Pires2000). Non-metric multi-dimensional scaling (nMDS) was used to analyse changes of polychaeta communities over the experimental period according to Euclidean distance (Chessa et al., Reference Chessa, Scardi, Serra, Pais, Lanera, Plastina, Valiante and Vinci2007).
RESULTS
The benthic environment
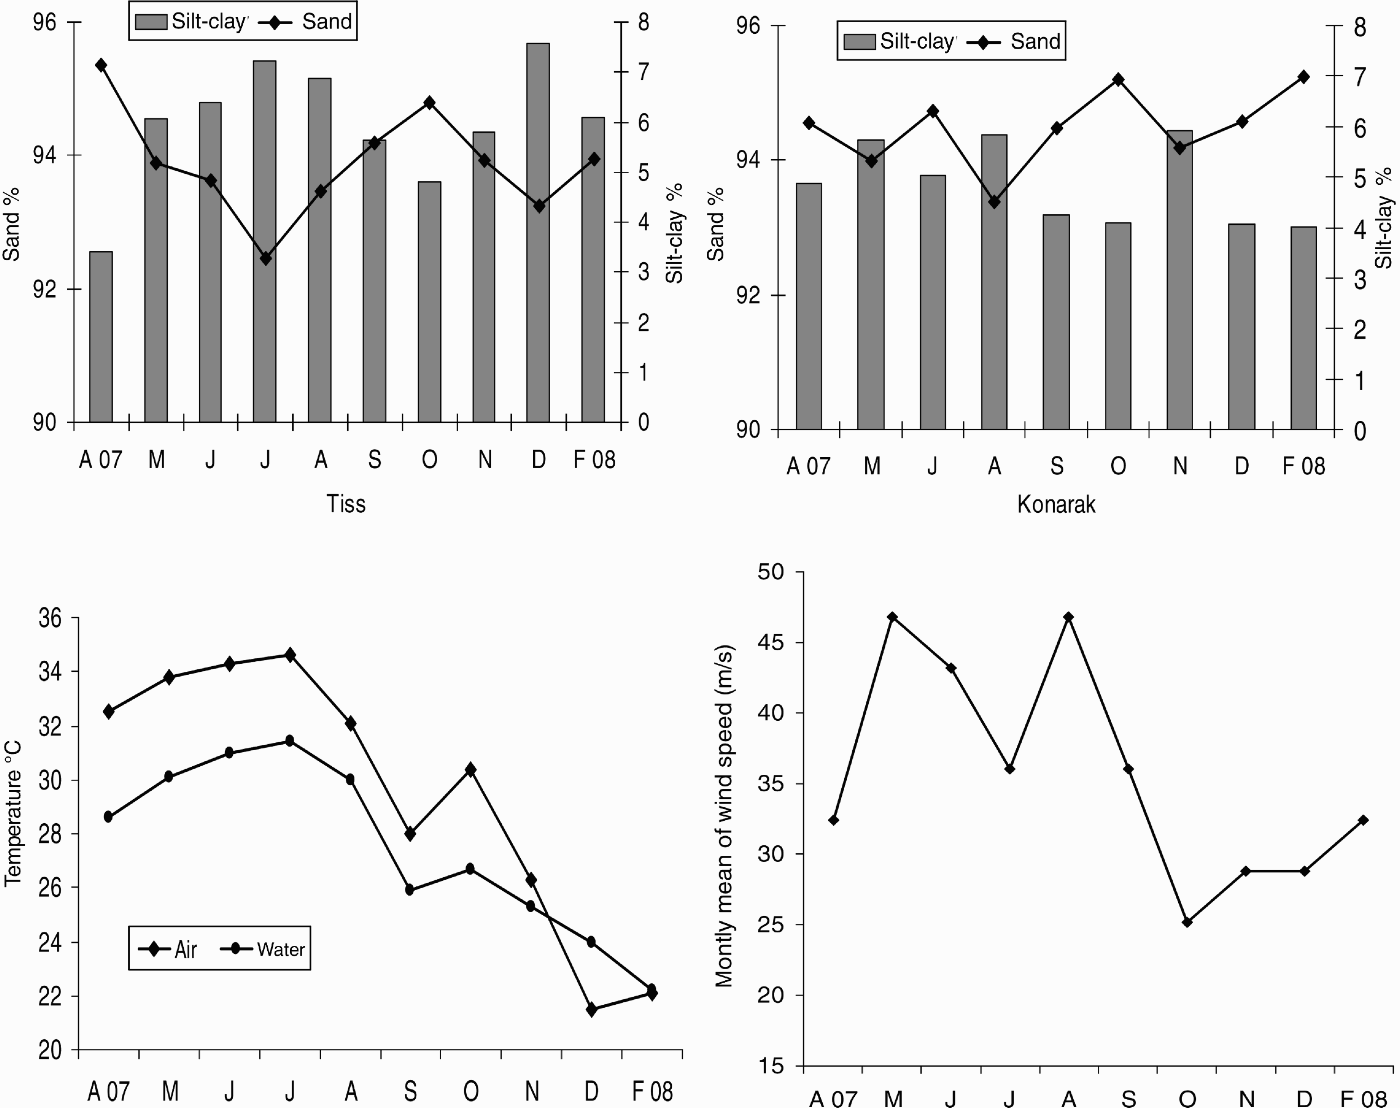
No significant differences were observed in sand and silt–clay per cent between stations and months (ANOVA; Table 1). In both stations, sand was the main component during the study period. Also air and water temperature showed a regular cycle ranging between 21.5 and 34.6. Maximum air and water temperature were obtained in July while minimum values were obtained in December and February, respectively. Maximum wind speed was obtained in March and August (46.8 m s−1) while the minimum wind speed (25.2 m s−1) was obtained at pre monsoon (Figure 2).
Mean environmental condition during present study.

Results of two-way ANOVA (station, season, station × season) on all analyses.

Community structure
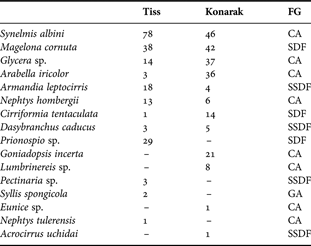
A total of 16 polychaete species belonging to 15 families were observed and identified from 420 cores during this study. From each beach 12 species were obtained. Of these, one family had two species (Nephthidae) and other families had one species (Table 2). According to Table 2, only one species was constant (Synelmis albini, F = 78%) at Tiss, and other species were either common or rare. At Tiss and Konarak, 5–6 species were common while six species were rare at both stations.
Frequency of occurrence (F%) and feeding guilds (FG) of polychaetes.

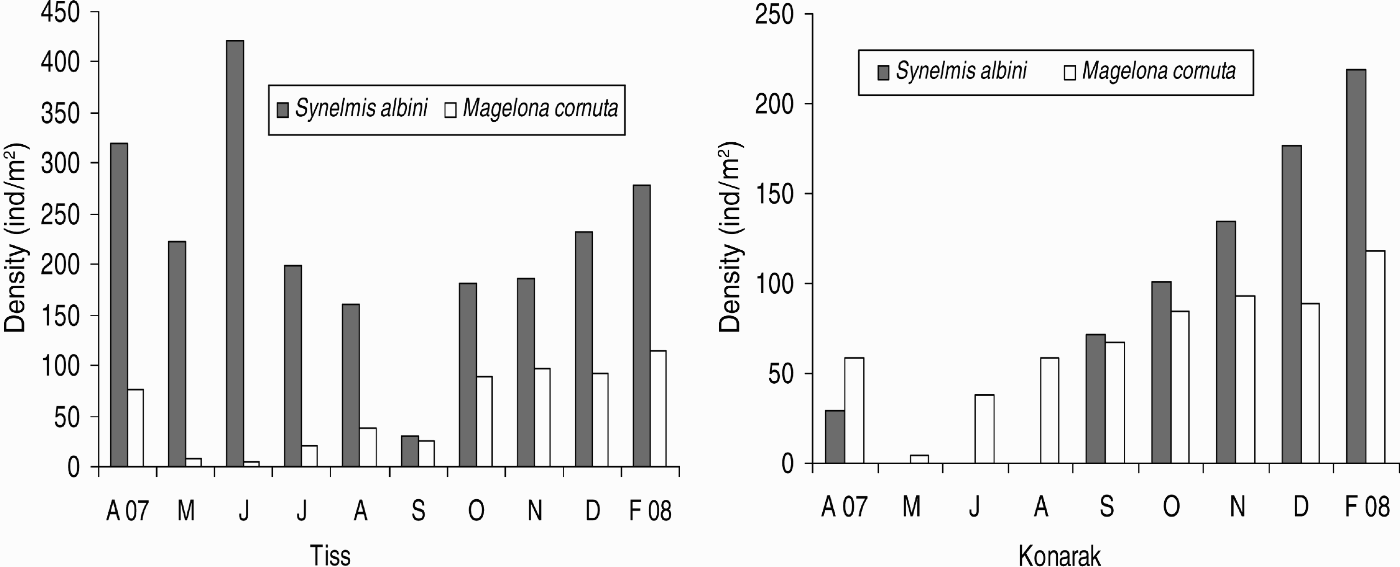
Two species, Synelmis albini and Magelona cornuta, were most abundant at both stations during this study and they had the highest density value of the total polychaeta. Densities of these are shown in Figure 3. The rare species had the lowest density value.
Mean density per m2 of two dominant species at both stations during this study.

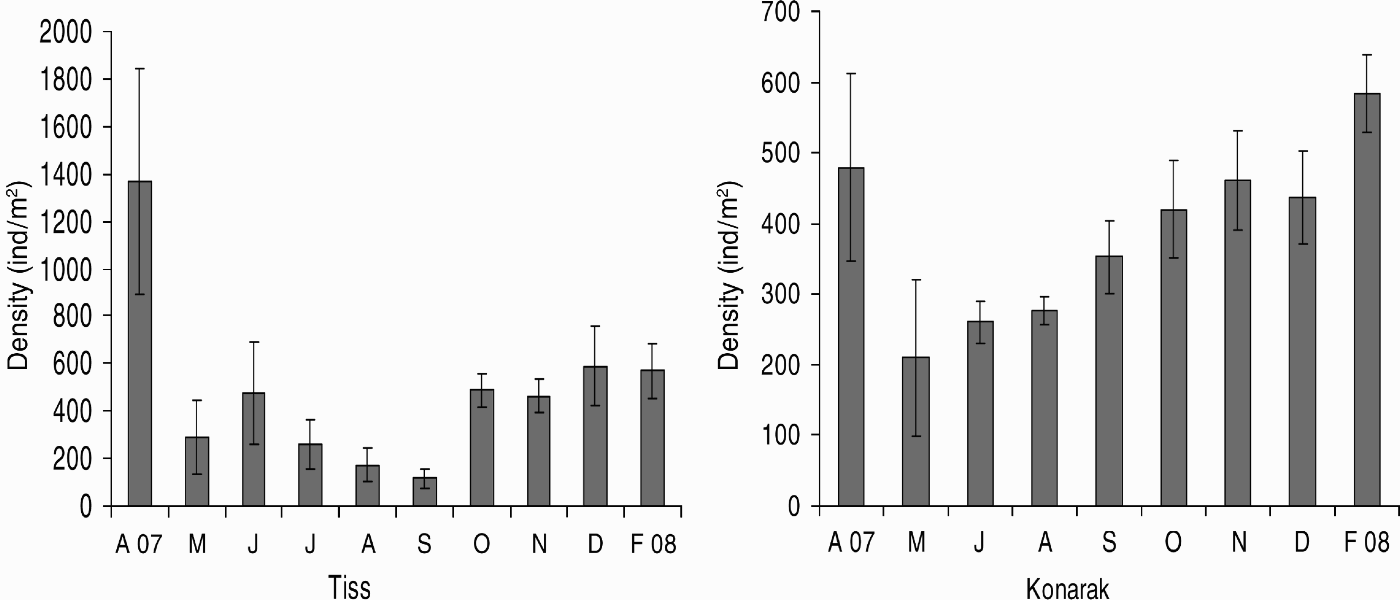
A significant difference in density was observed only among the months (ANOVA; Table 1). According to Tukey's test, maximum density was obtained in April while minimum was observed in May, August and September. Maximum and minimum density at Tiss was obtained 1370.70 ± 476.40 ind m−2 in April and 117.10 ± 40.13 ind m−2 in September, respectively. At Konarak, maximum density was observed 583.25 ± 55.08 ind m−2 in February while minimum was obtained 209.69 ± 111.41 ind m−2 in May (Figure 4). In general, density of polychaeta increased from post to pre monsoon while during monsoon, minimum density was observed.
Mean density recorded per m2 in each month during this study.

Correlations between the density of polychaeta with per cent of sand and silt–clay, air and water temperatures and wind speed are shown in Table 3. Positive and negative correlations were found between density and environmental variable.
Spearman's rank correlation coefficient between density of Polychaeta with environmental variables.

*, P < 0.05; **, P < 0.01.
Feeding guilds
The polychaeta were assigned to four feeding groups: carnivores (CA); surface deposit feeder (SDF); subsurface deposit feeder (SSDF); and grazer (GA). Figure 5 shows the feeding guilds composition of the polychaeta during the whole study period. In both stations, carnivores were the dominant group.
Feeding guilds composition of samples through the study period.

Ecological indices
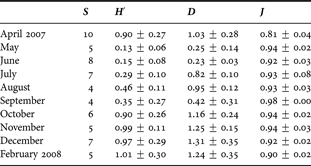
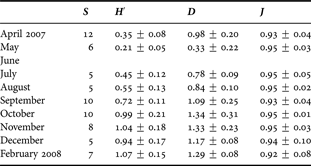
Species number (S), diversity (H′), richness (D), and evenness (J) were calculated at each station (Tables 4 & 5). Significant differences in diversity and richness were observed only among months but no significant difference was observed in evenness between stations and seasons (ANOVA; Table 1). The highest number of species (12) was recovered at Konarak (April) while the lowest (4) at Tiss (August and September). Also, diversity was highest at Konarak (1.07, February) and lowest at Tiss (0.13, May). Richness was highest at Konarak (1.34, October) and lowest at Tiss (0.23, June). Value of evenness was found between 0.81 (April, Tiss) and 0.98 (September, Tiss). In addition, the lowest values of ecological indices were observed during the monsoon.
Species number (S), diversity (H′), richness (D), and evenness (J) during this study at Tiss.

Species number (S), diversity (H′), richness (D), and evenness (J) during this study at Konarak.

Multivariate analysis
The dendogram of dissimilarities shows two main groups A and B (Figure 6). Group A was divided into three subgroups so that it comprised post monsoon (October–February) and pre monsoon (April). Group B was divided into two subgroups so that it comprised the monsoon season (May–September). During monsoon season density has the lowest value and this season separated from other season. In the post monsoon period, density of polychaeta slowly increased and at pre monsoon (April) maximum value of polychaete density was observed. The nMDS ordination plot for the complete data is shown in Figure 7. The groups of stations separated by nMDS are very similar to those generated with the similarity. Stress value of 0.050 was obtained.
Similarity between stations and months of polychaete community. T, Tiss; K, Konarak.

nMDS plot of polychaete communities. T, Tiss; K, Konarak.

DISCUSSION
Despite the intertidal zone being the best known area of the world's oceans (Nybakken, Reference Nybakken1993), the northern part of the Oman Gulf coast has been poorly studied with regard to its intertidal polychaeta. In this study 16 species belonging to 15 families of polychaeta were found. In Qeshm Island (Persian Gulf) 43 genera belonging to 32 families were obtained (Eksiri et al., Reference Eksiri, Emadi, Nabavi and Vosoghi2006). In Kuwait, Mohammad (Reference Mohammad1973) reported 19 species belonging to 11 families of polychaeta. On Goa beach in India, two species belonging to two families of polychaeta were reported (Harkantra & Parulekar, Reference Harkantra and Parulekar1985). At Dabhol, west coast of India, ten species belonging to nine families were obtained (Ingole et al., Reference Ingole, Rodrigues and Ansari2002). In the south of India, ten species of polychaeta from eight families were observed (Ajmal Khan et al., Reference Ajmal Khan, Murugesan, Lyla and Jaganthan2004). In Mosa Creek (Persian Gulf), 69 species belonging to 29 families were reported (Shakouri et al., Reference Shakouri, Savari, Nabavi and Yavari2001). According to these papers, numbers of species in the intertidal and shallow waters of the Indian Ocean regions is very variable. It was also found that the lug worm Arenicola sp. and Diopatra sp. in the study area were of very low density but they were not sampled quantitatively in this study and not included in the analyses.
According to Table 1, two species, Synelmis albini and Magelona cornuta, were most abundant at both stations and they had the highest effect on density changes during this study (Figure 3). On Tiss and Konarak beaches, 5–6 species were common and six species were rare at both stations (e.g. Nephthys tulerensis and Acrocirrus uchidai).
Population density showed significant differences monthly. Maximum and minimum density was observed at pre monsoon (April) and during monsoon (May–September), respectively. In addition, density at Tiss was greater than Konarak. At Tiss, maximum and minimum density was observed at 1370.7 ± 476.4 and 117.1 ± 40.13, respectively, but in Konarak, maximum density was observed at 583.25 ± 55.08 while minimum density was observed at 260.49 ± 29.36 (Figure 4). Wave action and sand percentage perhaps were the most important physical factors governing life on exposed sandy beaches. These factors strongly correlated with density, diversity and community structure of macrofauna (Nybakken, Reference Nybakken1993). In this study, during the monsoon period, velocity of wind and power of wave increased. Wave action can disturb the surface sediment and washes the polychaete at the intertidal zone so that the number of species, diversity, density, and species richness will increase with reducing exposure to wave action (Alongi, Reference Alongi1990; Dexter, Reference Dexter1992, Reference Dexter1993). On the other hand no significant differences were observed in sand and silt–clay per cent during the present study between stations and months. Hence, it can be said that the effect of the monsoon is greater than other factors on density of polychaeta in this area. In Chabahar Bay, maximum and minimum densities of polychaeta were reported at 2398 ind m−2 (March) and 610 ind m−2 (July), respectively (Nikouyan & Savari, Reference Nikouyan and Savari1999). In Qeshm Island maximum and minimum densities were observed at 3006 ind m−2 and 559 ind m−2, respectively (Eksiri et al., Reference Eksiri, Emadi, Nabavi and Vosoghi2006). In other studies Harkantra & Parulekar (Reference Harkantra and Parulekar1985) and Ibrahim et al. (Reference Ibrahim, Wan Hussin, Kassim, Joni, Zakaria and Hajisamae2006) showed that during the monsoon the density of polychaeta was minimum while at pre monsoon the density was maximum.
The analysis of the trophic structure of polychaete communities is important to determine energy flow in marine sediments. In the present study, carnivorous species were dominant at both stations and during all months. It can be related to the kind of sediment (sand) and low organic matter content. Absorption of organic matter is linearly related to grain size so that with decreasing per cent of sand, content of organic matter will increase. This can influence the feeding habitats of the fauna (Paiva, Reference Paiva1993). Although organic matter was not measured in this study, the absence of large macroalgae and algal mats means that there is very little productivity in this study area. Hence, this situation creates favourable conditions for the existence of carnivorousness. Similar results were obtained by Coleman et al. (Reference Coleman, Cuff, Dummond and Kudenov1978) and Muniz & Pires (Reference Muniz and Pires2000). On the other hand, wave action can wash food particles from the sediment around the palps and mouth of the deposit and subsurface deposit feeder before they can get them. Thus these species cannot live easily in the intertidal zone (Fauchald & Jumars, Reference Fauchald and Jumars1979). In this instance, diversity and density of species were low during this study.
During this study, polychaete communities differed by diversity, richness and evenness. Monthly differences between values of these indices clearly related to the monsoon period so that the lowest values of ecological indices were observed during the monsoon. In all periods of this study the H′ value was very low (maximum 1.07) which can indicate that this is not an adequate environment for polychaetes. In Qeshm Island, the maximum of the mentioned indices were obtained 2.80, 3.21 and 0.90, respectively that was more than of present study (Eksiri et al., Reference Eksiri, Emadi, Nabavi and Vosoghi2006). South-west of Thailand, maximum diversity and evenness was observed at 5.2 and 0.85, respectively (Barrio Froján et al., Reference Barrio Froján, Kendal, Paterson, Hawkins, Nimsantijaroen and Aryuthaka2006). In this study, a low amount of these indices can be related to: (i) low number of species of polychaeta; and (ii) existence of common and rare species so that approximately all obtained species belonged to these groups (Table 1).
Multivariate analysis can detect changes in polychaete assemblage in space and time. Cluster analysis separated stations and months during this study so that post monsoon (October–February), pre monsoon (April) and monsoon period (May–September) clearly separated. The MDS analysis corroborated results shown in the dendogram confirming the separation between stations and months. On the other hand, according to the results of two-way ANOVA, there were no significant differences in sand and silt–clay per cent between beaches and seasons. Hence, density bears no relation to sediment characteristics.
The present results show that the monsoon is the main factor that determines the distribution patterns of polychaete species in Chabahar Bay intertidal area. It is the first research on the polychaete fauna at the intertidal zone of Chabahar Bay. Also studies on the intertidal zone are uncommon in the Oman Gulf and adjacent areas; hence any comparison in community structure with other studies is not possible. This study can serve as a framework for future studies on the ecology of the benthic infauna in the Oman Gulf.
ACKNOWLEDGEMENTS
This study was financially supported by the Iranian National Centre for Oceanography (INCO). We are indebted to I. Mohammadi, V. Ataei, A.S. Mokhberi, M. Elahi and A.S. Dehghan for their assistance. We are also thankful to Miss Shima Yazdani and Mr Reza Yazdani for their assistance.