Nomenclature
-
 $R$
-
Cruise range
-
$V$
-
True airspeed
-
$c_T$
-
Thrust-specific fuel consumption
-
$L$
-
Lift force
-
$D$
-
Drag force
-
$L/D$
-
Lift-to-drag ratio
-
$W$
-
Aircraft weight
-
$W_0$
-
Initial aircraft weight
-
$W_1$
-
Final aircraft weight
-
$H$
-
Range factor
-
$S$
-
Wing reference area
-
$\rho$
-
Air density
-
$C_L$
-
Lift coefficient
-
$C_D$
-
Drag coefficient
-
$C_{D0}$
-
Parasite drag coefficient
-
$K$
-
Induced drag coefficient
-
$\dot{m}_f$
-
Fuel mass flow rate
-
$T$
-
Engine thrust
-
$h$
-
Altitude
-
$V_0$
-
Initial airspeed
-
$\mu_k$
-
Mean of $k$th predictor
-
$\sigma_k$
-
Standard deviation of $k$th predictor
-
$\bar{x}_k$
-
Normalized predictor
-
$x_k$
-
Predictor variable
-
$n$
-
Number of samples
-
$p$
-
Number of predictors
-
$y_i$
-
Actual value
-
$\hat{y}_i$
-
Predicted value
-
$\bar{y}$
-
Mean of actual values
-
$R^2$
-
Coefficient of determination
- MSE
-
Mean squared error
- RMSE
-
Root mean squared error
- MAE
-
Mean absolute error
-
$N$
-
Number of observations


1.0 Introduction
The prediction of aircraft range is a fundamental problem in aeronautical engineering that affects fuel efficiency, operational costs and environmental impact. Furthermore, the ability to estimate the cruise range is essential for aircraft design, performance assessment, flight planning and trajectory prediction. Traditionally, range prediction has relied on analytical models such as the Bréguet range equation and range integration methods, which provide simplified approximations for fuel consumption and range performance [Reference Saarlas1]. Although these classical models have been extensively used, they fail to capture the full complexity of real-world flight conditions, including aerodynamic nonlinearities, changing fuel consumption rates and operational constraints. Therefore, more advanced methods must be developed to achieve more efficient flight operations, as they directly inform decisions that optimise fuel consumption and reduce emissions.
Fuel consumption can be thought of as a key determinant of the operational range of an aircraft, which directly influences cost efficiency, emissions and overall performance. The fuel flow rate varies significantly between different flight phases and affects the total fuel required for a given mission [Reference Oruc and Baklacioglu2]. In Ref. [Reference Turgut, Cavcar, Usanmaz, Canarslanlar, Dogeroglu, Armutlu and Yay3], a detailed analysis of fuel flow during the cruise flight has been conducted that emphasises the importance of optimising altitude and speed to minimise fuel burn. In Refs [Reference Baklacioglu4–Reference Fang, Qu and Liu6] machine learning-based neural network models are developed to accurately predict fuel consumption patterns to improve fuel efficiency estimates for commercial aircraft. In particular, the cost index optimisation can lead to a significant reduction in fuel use [Reference Edwards, Dixon-Hardy and Wadud7]. In this regard, the development of an accurate cruise range model would be also beneficial for the convergence capability of fuel consumption prediction models.
On the other hand, aircraft emissions is an important environmental concern, with carbon dioxide (
 $C{O_2}$
), nitrogen oxides (
 $N{O_x}$
) and particulate matter being the main contributors to climate change and local air pollution [Reference Zaporozhets and Synylo8]. Since the fuel consumption of an aircraft is directly related to its range, optimising cruise flight programmes can reduce emissions while extending the maximum cruise range. Therefore, the choice of cruise flight programme plays a crucial role in both fuel efficiency and emissions. Studies have shown that cruise altitude, airspeed and weight all influence the amount of
 $C{O_2}$
released during flight [Reference Cecen9]. In addition, aircraft with improved aerodynamic efficiency and optimised weight distribution emit less
 $C{O_2}$
per unit of range [Reference Graver, Rutherford and Zheng10]. Even unmanned aerial vehicles exhibit variations in emissions based on their flight profile and weight, reinforcing the need for precise fuel consumption modeling [Reference Dinc and Otkur11]. Consequently, a machine learning-based cruise range estimation model is crucial as it can lead to both fuel-efficient and lower-emission flight strategies by predicting optimal flight parameters more accurately than traditional models.
1.1 Literature review on aircraft range estimation
Aircraft range estimation has been widely studied using both classical analytical models and modern computational approaches. Bréguet’s range equation, originally developed in the early 20th century, remains a widely used theoretical framework for estimating range based on lift-to-drag ratio, fuel weight and specific fuel consumption [Reference Cavcar12]. Over the years, several refinements have been made to improve its predictive accuracy. In Ref. [Reference Cavcar13], the Bréguet range equation is extended by incorporating compressibility effects and cambered wing drag polars, making it more applicable to high-subsonic-transport aircraft. In Refs [Reference Cavcar and Cavcar14, Reference Cavcar and Cavcar15], on the other hand, approximate range solutions are further developed for constant altitude and constant speed cruise flights, which are more representative of modern aircraft operations.
There are also studies that focus on improving range estimates by considering real-world operational constraints. In Ref. [Reference Peckham16], the concept of a specific range, which provides an instantaneous measure of distance per unit of fuel consumed, is proposed to offer an alternative to the integrated range equations described in Ref. [Reference Saarlas1]. Cruise performance and range prediction are revisited by incorporating compressibility effects and proposing a non-iterative fuel estimation procedure [Reference Torenbeek17]. In Ref. [Reference Rivas, Lopez-Garcia, Esteban and Gallo18], it is demonstrated that maximum range is highly sensitive to atmospheric conditions, especially the effect of wind. In Ref. [Reference Randle, Hall and Vera-Morales19], flight data recorder (FDR) measurements are used to refine fuel burn estimates. It is shown that traditional range equations underestimate fuel consumption in real-world operations. In Ref. [Reference Atasoy and Cetek20], quick access recorder (QAR) data is utilised to improve the drag polar and thrust-specific fuel consumption models, and subsequently applied the Bréguet range equation for enhanced cruise range prediction. In Ref. [Reference Wislicenus and Daidzic21], on the other hand, the maximum range and airspeed of a commercial aircraft are estimated considering the presence of transonic wave drag, thereby improving prediction accuracy.
It is well known that the weight of an aircraft is a critical determinant of its range, which influences fuel consumption, aerodynamic efficiency and operational flexibility. The takeoff weight, which includes payload, fuel and operating empty weight, directly affects the range calculations. In this regard, many studies have shown that accurate weight estimation is essential for trajectory modeling and fuel burn prediction [Reference Chati and Balakrishnan22]. Traditional range models such as the Bréguet range equation, however, assume a continuous weight reduction due to fuel consumption, yet recent approaches have improved aircraft mass estimation during different flight phases, leading to more precise range predictions [Reference Sun, Ellerbroek and Hoekstra23]. Furthermore, fuel weight estimation models, particularly for military aircraft, demonstrate that the fuel-to-weight ratio significantly impacts endurance and operational efficiency [Reference Marinus and Maison24]. These findings emphasise the need for advanced predictive models that can dynamically estimate aircraft weight and its effect on range. In practice, the specific fuel consumption varies with thrust, airspeed and altitude, and this behaviour plays an important role in determining accurate range predictions. Several studies, such as Refs [Reference Rivas, Lopez-Garcia, Esteban and Gallo18, Reference Parget and Ardema25], discuss these functional dependencies, which are typically simplified or neglected in classical Bréguet-type analyses.
Optimisation-based techniques (especially metaheuristic methods such as genetic algorithms (GA) and particle swarm optimisation (PSO)) have also been employed to improve range estimates. GA and PSO are used to develop non-linear models that estimate the cruise range based on velocity, weight and altitude (see Subsection 2.2 for details) [Reference Oruc and Baklacioglu26]. Although these methods offer improved accuracy compared to analytical models, they are computationally expensive and sensitive to hyperparameter selection. In addition, those models are developed for specific altitudes that do not allow us to predict range values of different altitudes. On the other hand, the potential of machine learning for range prediction is demonstrated in Refs [Reference Kim, Druot and Liem27, Reference Kim, Seth and Liem28] by proposing data-driven optimisation frameworks that integrate real-world flight data into mission analysis algorithms.
Recent advances in machine learning have introduced new possibilities for modeling aircraft performance. For example, in Ref. [Reference Wang, Luiz, Zhang and Lima29], an iterative convex programming approach is developed for the prediction of the range of electric aircraft that outperforms classical models by incorporating battery discharge dynamics. Similarly, in Ref. [Reference Wroblewski and Ansell30], a hybrid electric Bréguet range equation is formulated to predict the range of hybrid electric aircraft. In Ref. [Reference Kim, Seth and Liem28], a data-driven flight simulation framework is proposed to enhance range predictions by using supervised learning techniques. In Ref. [Reference Randle, Hall and Vera-Morales19], a data-enhanced Bréguet range model is introduced using a hybrid approach that combines physics-based models with machine learning corrections.
1.2 Objectives
In light of the literature review, the present study aims to improve aircraft range modeling by using machine learning-based regression models (which have never been used to the best knowledge of the authors) to achieve more accurate and data-driven range predictions. Therefore, it is aimed to use the cruise flight data of Boeing 737–400 given by its Operations Manual [Reference Group31]. In case of absence of FDR or QAR data of an aircraft, developing a highly convergent regression model based solely on the Operations Manual data is extremely vital since the developed methodology would still be valid and accurate. The key objectives can be listed as:
-
• To model, train and validate multiple machine learning-based regression models for range estimation under two different cruise flight programmes, namely the constant speed and constant lift coefficient and the constant altitude and constant lift coefficient.
-
• To determine the best regression model for range estimation regarding certain performance metrics calculated for the validation and test data.
-
• To gain insight into the performance of the present aircraft by performing range predictions for various altitudes with changing velocity and weight parameters.
The last item of the above list is particularly valuable as there is limited information in the Operations Manual of the aircraft.
It should be noted that the study focuses on predicting steady-state cruise range rather than modeling the full evolution of the flight. Unlike analytical range formulations, the proposed machine learning approach does not describe the continuous variation of state variables but instead captures the steady-flight relationships that govern cruise performance.
In addition, in this study, range is modelled rather than optimised; that is, the cruise performance is predicted under prescribed flight conditions without seeking flight profiles that maximise range. Optimisation-based approaches rely on direct or indirect optimal control methods (e.g., Refs [Reference Betts32, Reference Rao33], which are outside the scope of this work.
1.3 Paper structure
The rest of this paper is structured as follows: Section 2 presents the existing cruise range formulations for two different cruise flight programmes. In Section 3, the main contribution of the study is presented. First, the main parts of the regression modeling workflow are introduced. Then, the results of the training and validation phases are presented over the calculated performance metrics and visualisation. In Section 4, the machine learning range predictions are compared with analytical range formulations to provide physical insight and illustrate where the classical equations diverge from real performance due to their simplifying assumptions. In Section 5, the trained machine learning models are used to predict cruise range for unseen operating conditions to evaluate their generalisation capability beyond the training data. In Section 6, the concluding remarks are given along with future research directions.
2.0 Cruise range formulations for different cruise flight programmes
Range is a basic operational requirement and design criterion, especially for transport category aircraft. Due to this importance, range performance has been extensively studied by numerous researchers since the early days of aviation [Reference Cavcar12, Reference Cavcar and Cavcar14, Reference Randle, Hall and Vera-Morales19]. This section presents the fundamental range equations for different cruise flight programmes employed by jet-powered aircraft.
The analytical formulations presented in the following subsection are included to introduce the two distinct cruise flight programmes commonly employed in range analysis and to clarify how key parameters influence the cruise range. Specifically, these formulations serve to highlight the role of velocity, altitude, lift-to-drag ratio and fuel consumption in shaping range performance, thereby offering a physical perspective on the problem addressed in this study.
2.1 Analytical range formulations
The constant velocity and constant lift coefficient cruise, commonly known as climbing-cruise flight, represents the optimal trajectory for long-range, high-subsonic-speed flight. The Bréguet range equation applies to this cruise flight programme:
 \begin{align} R = \frac{V}{{{c_T}}}\frac{L}{D}{\rm{ln}}\frac{{{W_0}}}{{{W_1}}}\end{align}
where
 $R$
is the range,
 $V$
is the true airspeed,
 ${c_T}$
is the specific fuel consumption,
 $L$
and
 $D$
are the lift and drag forces acting on the aircraft, respectively,
 ${W_0}$
is the initial weight of the aircraft and
 ${W_1}$
is the final weight of the aircraft [Reference Cavcar12, Reference Cavcar and Cavcar14].
For constant airspeed, lift-to-drag ratio, and specific fuel consumption during cruise, the equation can be expressed in terms of the range factor
 $H$
:
 \begin{align} R = H{\rm{ln}}\frac{{{W_0}}}{{{W_1}}}.\end{align}
where
 $H$
represents the nominal aircraft performance during cruise and is equal to:
 \begin{align*} H = \frac{{V\left( {L/D} \right)}}{{{c_T}}}\end{align*}
This climbing-cruise flight strategy allows aircraft to maintain optimal lift-to-drag ratio as fuel burns off by gradually increasing altitude, theoretically maximising range. However, it is rarely fully implemented in practice due to existing air traffic control constraints [Reference Cavcar and Cavcar15].
The constant altitude and constant lift coefficient cruise range of a jet-powered aircraft is given by:
 \begin{align} R = \frac{{2\left( {L/D} \right)}}{{{c_T}}}\sqrt {\frac{2}{{\rho S{C_L}}}} \left( {\sqrt {{W_0}} - \sqrt {{W_1}} } \right)\end{align}
or alternatively expressed in a more practical form:
 \begin{align} R = \frac{{2\left( {L/D} \right)}}{{{c_T}}}{V_0}\left( {1 - \sqrt {\frac{{{W_1}}}{{{W_0}}}} } \right)\end{align}
where
 \begin{align*} {V_0} = \sqrt {\frac{{{2W_0}}}{{\rho S{C_L}}}} \end{align*}
is the initial airspeed calculated at the beginning of the cruise [Reference Cavcar13, Reference Randle, Hall and Vera-Morales19]. In these equations,
 $S$
represents the wing reference area,
 $\rho $
is the air density and
 ${C_L}$
is the lift coefficient.
This cruise involves maintaining a constant altitude while the aircraft weight decreases due to fuel burn, resulting in a gradually decreasing airspeed to maintain the constant lift coefficient [Reference Cavcar and Cavcar15, Reference Randle, Hall and Vera-Morales19]. It should be noted that this approach is less favoured in practice due to operational constraints, including fixed schedules and speed requirements.
While the range formulations expressed in (1) and (3) are useful for illustrating how cruise range depends on velocity, altitude, lift-to-drag ratio and thrust-specific fuel consumption (TSFC), several drawbacks limit their applicability. First, the practical use of these equations requires a TSFC model that accounts for variations with altitude, Mach number and engine operating conditions. Deriving such a model with sufficient accuracy for the Boeing 737–400 is highly challenging in the absence of manufacturer data, and generic approximations would introduce inconsistencies. Second, an accurate drag polar model is needed to determine the aerodynamic efficiency
 $L/D$
over the relevant cruise. However, the transonic flight regime of the 737–400 is strongly affected by compressibility effects, wave drag and aerofoil camber, which cannot be captured adequately by conventional quadratic drag polar approximations of the form
 \begin{align} {C_D} = {C_{D0}} + KC_L^2\end{align}
where
 ${C_D}$
represents the drag coefficient,
 ${C_{D0}}$
is the parasite drag coefficient and
 $K$
indicates the induced drag coefficient. These second-order polars are well suited for incompressible or low-speed flows but are known to underestimate drag rise in the transonic regime, thereby leading to optimistic and physically unrealistic range predictions.
Consequently, applying Equations (1) and (3) with such simplified aerodynamic and propulsion models would yield misleading results. To overcome these limitations, the present study adopts a data-driven regression methodology, which directly learns the input–output mapping from the Boeing 737–400 Operations Manual dataset (see Section 3). By doing so, the combined effects of TSFC variation, aerodynamic nonlinearities and operational constraints are inherently embedded in the model, eliminating the need for explicit but often inaccurate analytical approximations. In this respect, Section 4 presents a comparison between the analytical and real range values, illustrating how the analytical formulas begin to deviate from the Operational Manual data due to their underlying simplifications.
2.2 Non-conventional formulations
More recently, an innovative approach has been proposed, which models the range equations introduced in Subsections 2.1 using optimisation-based methods [Reference Oruc and Baklacioglu26]. The proposed method presents two empirical formulas which are
 \begin{align} R = {a_1}V\sqrt W + {b_1}{\rm{ln}}\left( {V\sqrt W } \right) + {c_1}V\sqrt W {\rm{ln}}\left( {V\sqrt W } \right) + {d_1}\end{align}
for the constant altitude and constant lift coefficient cruise, and
 \begin{align} R = {a_2}W{\rm{arctan}}\left( W \right) + {b_2}{\rm{arctan}}\left( W \right) + {c_2}W + {d_2}\end{align}
for constant velocity and constant altitude cruise. These equations require coefficient optimisation for specific aircraft types and flight programmes. Unlike traditional analytical approaches, these models eliminate the need for detailed drag polar specifications while still accounting for the effects of modern transport aircraft’s cambered wings and compressibility.
In Ref. [Reference Oruc and Baklacioglu26], the coefficients of the formulas are found according to the operational data of a jet-powered aircraft using metaheuristic optimisation methods, such as GA and PSO. The error analysis revealed correlation coefficients very close to 1 for both cases. This performance validates these non-conventional approaches as powerful alternatives to traditional analytical range equations [Reference Oruc and Baklacioglu26].
However, these models present several notable limitations. The most crucial limitation is that they are altitude-specific. To be more precise, each empirical formula is derived separately for a given altitude, requiring distinct optimisation of coefficients for each case. As a result, these models lack the ability to generalise across a continuous range of flight altitudes. Therefore, it is not possible to make range predictions for different altitudes, which significantly restricts their practical applicability in real-time flight planning and performance assessment.
In light of the above discussion, our aim is to obtain a unified regression model that captures the full variability of altitude, weight and speed within a single framework. In the next section, the proposed method is explained in detail.
3.0 Regression modeling of the cruise range
Given cruise flight data, the main objective is to model the range dynamics of the aircraft for two different cruise flight programmes. In order to obtain these models, we utilise machine learning-based regression modeling where the associated workflow of this process is illustrated in Fig. 1.
Regression modeling workflow.

We apply the regression modeling workflow whose vital phases are explained in the following subsections. In a nutshell, the process begins with portioning the dataset into training/validation and testing subsets to facilitate model development and generalisation assessment. Then a normalisation is performed, where the predictor inputs are normalised to ensure uniform scaling. Within the validation subset, k-fold cross-validation is applied to evaluate the performance of different regression models. The goal is to choose a few regression models that yield the best validation performance. Then, the performance of the chosen models is evaluated using the test data, which remain completely unseen during training and validation. According to the performance results, the best regression model is chosen. Once the regression is obtained, range values can be predicted for the given input data. It should be noted that the normalisation of validation, test and prediction data is performed according to the normalisation factors of the training data.
3.1 Dataset and assumptions
As in Refs [Reference Cavcar and Cavcar15, Reference Oruc and Baklacioglu26], we consider one of the most widely used jet-powered commercial aircraft – Boeing 737–400, whose technical specifications are given in Table 1. To model the range dynamics of the aircraft, we utilise the cruise flight data given by the Operations Manual [Reference Group31]. The manual lists discrete combinations of range, aircraft weight, altitude and true airspeed. The Operations Manual provides the cruise performance data as direct tabulated values without any accompanying statistical information. These tables are given for the two cruise flight programmes, resulting in two distinct datasets used in this study. The relevant flight data give operational range values for two cruise flight programmes:
-
• Constant velocity and constant lift coefficient: a steady Mach number of
$M = 0.74$
for altitudes from 21,000 ft to 37,000 ft. -
• Constant altitude and constant lift coefficient: the variable Mach numbers for altitudes from 10,000 ft to 30,000 ft.

Specifications of the case study jet-powered commercial aircraft Boeing 737–400

For the constant velocity and constant lift coefficient cruise, it should be noted that the aircraft does not operate at a fixed altitude in real flight. This cruise flight programme corresponds to a climb–cruise, in which the aircraft gradually increases its altitude as fuel is burned while maintaining constant velocity and lift coefficient. The altitude values provided in the Operations Manual therefore do not represent level cruise at a fixed altitude, nor a mean altitude over the entire cruise, but rather discrete reference altitude levels associated with representative climb–cruise conditions. These manufacturer-defined altitude levels are commonly used for practical performance assessment and serve as nominal reference points for range evaluation.
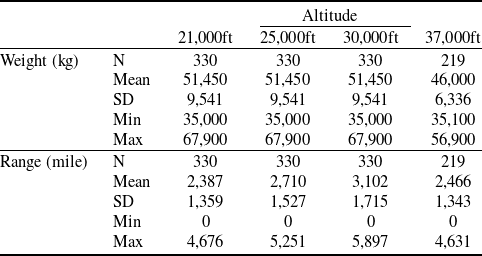
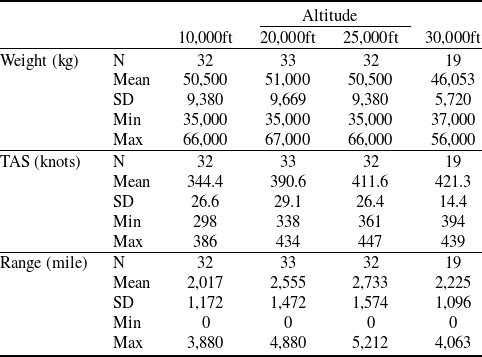
In Tables 2 and 3, the statistical properties of the cruise flight data are given according to two different cruise flight programmes introduced in Subsections 2.1. and 2.2, respectively. It should be noted that the difference in data density, i.e.
 $N$
, is due to the Operations Manual itself; as shown in Tables 2 and 3, the manual provides less data for the constant altitude and constant lift coefficient cruise compared to the constant velocity and constant lift coefficient cruise.
Statistical properties of weight and range data for the constant velocity and constant lift coefficient cruise

Statistical properties of weight, true-air-speed (TAS) and range data for the constant altitude and constant lift coefficient cruise

Note that the values are generated by the manufacturer assuming the following:
-
• International Standard Atmosphere (ISA) conditions
-
• Zero wind and no temperature deviation
-
• Clean configuration (flaps retracted, gear up)
-
• No step-climb or air traffic control constraints
-
• Long-range cruise settings for the constant velocity and constant lift coefficient cruise, and maximum-range cruise settings for the constant altitude and constant lift coefficient cruise
Thus, the dataset represents idealised performance in still-air conditions, without operational factors such as cost-index optimisation or weather effects. By using these manufacturer-provided datasets, the present study ensures that the input–output pairs used for machine learning are internally consistent with a well-defined aerodynamic and propulsion baseline, while avoiding the need to explicitly determine lift, drag, and thrust-specific fuel consumption from separate sources.
3.2 Splitting the dataset
To evaluate the generalisation performance of the regression models on unseen data, the complete dataset must be initially partitioned into two non-overlapping subsets. In this manner, 70/30 split is employed as a common practice, where
 $70{\rm{\% }}$
of the data is allocated for model development (training and validation), and the remaining
 $30{\rm{\% }}$
is reserved exclusively for testing.Footnote
1
To ensure a reliable and unbiased model evaluation during training, the validation phase employs k-fold cross-validation, a well-established resampling technique to estimate the generalisation performance of supervised learning algorithms. In this method, the training dataset is randomly partitioned into
 $k$
approximately equal-sized and mutually exclusive subsets, or ‘folds’.
For each of the
 $k$
iterations, one fold is reserved as the validation set, while the remaining
 $k - 1$
folds are combined to form the training set. The model is trained on the training set and evaluated on the validation set. This process is repeated
 $k$
times, so that each fold is used exactly once for validation.
The performance metric, e.g.
 ${R^2}$
, MSE, RMSE (see Subsection 3.4), is computed in each iteration, and the overall validation score is obtained by averaging the results:
 \begin{align} {\textrm{Validation Score}} = {1 \over k}\mathop \sum \limits_{i = 1}^k {{\mathcal M}_i}\end{align}
where
 ${{\mathcal M}_i}$
denotes the performance metric computed on the
 ${i^{{\rm{th}}}}$
validation fold.
In this study, 10-fold cross-validation is employed. This procedure reduces variance and mitigates the risk of overfitting or underfitting associated with a single, arbitrary train–validation split. It provides a more robust estimate of predictive capability of the model on unseen data and is particularly advantageous when the available dataset is limited in size.
Once the optimal model configuration is selected based on cross-validation performance, it is retrained using the entire
 $70{\rm{\% }}$
training and validation subset and then evaluated on the
 $30{\rm{\% }}$
hold-out test set. This final evaluation provides an unbiased estimate of the predictive accuracy of the model on truly unseen data, simulating real-world deployment conditions.
This two-phase evaluation, i.e. cross-validation for model selection and hold-out testing for generalisation assessment, offers a balanced trade-off between reliable validation and conservative performance reporting.
3.3 Normalisation
A normalisation procedure is utilised on the predictor inputs to ensure consistent scaling and improve model performance. In this sense, z-score normalisation (standardisation) is utilised. This preprocessing step is particularly important for models sensitive to feature magnitudes, i.e. the regression models introduced in Subsection 3.3.
For
 $k = 1,2, \ldots ,p$
, where
 $p$
is the number of predictors, let
 \begin{align*} {{\mathbf{x}}^k} = {\left[x_1^k,x_2^k, \ldots ,x_n^k \right]^T}\end{align*}
denote the vector of the
 ${k^{th}}$
predictor with
 $n$
number of observations. z-score normalisation transforms each predictor vector, i.e.
 ${{\mathbf{x}}^k}$
, to a normalised vector, to be defined as
 $\bar{\mathbf{x}}^k$
, which has zero mean and unit variance. In this regard, for
 $i = 1,2, \ldots ,n$
:
 \begin{align*} \bar x_i^k = \frac{{x_i^k - {\mu _k}}}{{{\sigma _k}}}\end{align*}
where
 ${\mu _k}$
and
 ${\sigma _k}$
are the mean and standard deviation of
 ${{\mathbf{x}}^k}$
. This ensures that all predictors contribute proportionally to model training, regardless of their original units or scales.
In this respect, the z-score normalisation is applied to the weight and speed data of two different cruise flight programmes. Consequently, each observation is normalised using the mean and SD values of the training data.
The response variable is kept in its original units, since normalisation is applied only to the predictor inputs. However, to ensure the validity and generalisability of the regression models, it is essential that the same normalisation procedure, i.e. z-score normalisation, is applied to each predictor input consistently across all phases: training, cross-validation, testing and prediction. Therefore, during the prediction phase (explained in Subsection 3.6), when unseen predictor inputs are provided, the same z-score normalisation will be applied to each predictor value using
 ${\mu _k}$
and
 ${\sigma _k}$
for the
 ${k^{th}}$
predictor of the training data. In this way, it is ensured that consistency between all phases of the process is established.
3.4 Model training and testing
In order to find the most accurate and robust predictive model for aircraft cruise range, multiple machine learning regression methods are trained and compared. This comparative approach is essential due to the varying characteristics of the available data and the different strengths and limitations of individual regression methods. Each model responds differently to nonlinearity, noise, dimensionality and data volume; therefore, evaluating several candidates provides a more reliable path toward optimal generalisation performance. In this phase, four different regression methods have been considered due to their diverse modeling capabilities and their proven effectiveness in previous studies related to engineering system modeling.
-
1. Decision tree regression (DTR) recursively splits data into homogeneous subgroups based on feature values, forming a tree-like structure. The model makes predictions by averaging the target values in each terminal node. By this way, it allows to handle nonlinear relationships naturally. Decision trees are interpretable and require minimal preprocessing. However, DTR is prone to overfitting, which causes instability to small variations in data.
-
2. Support vector regression (SVR) extends support vector machines to regression tasks by fitting a function within a specified
$\varepsilon $
-margin of tolerance. It minimises the error while maximising the margin between predictions and actual values. The use of kernel functions enables SVR to model nonlinear relationships, making it robust to high-dimensional data. However, SVR is computationally expensive and requires careful tuning of hyperparameters. -
3. Gaussian process regression (GPR) is a probabilistic regression method that models a distribution over functions rather than a single function. It provides both predictions and uncertainty estimates. Because of that, it is useful for Bayesian inference. GPR is highly flexible and can capture complex patterns through kernel functions. It is computationally expensive which makes it unsuitable for large datasets.
-
4. Neural network regression (NNR) is a deep learning-based approach that can approximate complex, nonlinear functions by learning hierarchical representations of data. It automatically captures intricate patterns without requiring manual feature engineering. Though NNR is highly powerful and scalable, neural networks are computationally intensive, require large amounts of data, and are often regarded as a black-box model due to their lack of interpretability.
-
5. Training and testing of these models are carried out using MATLAB, which provides a streamlined environment for supervised learning tasks, allowing efficient preprocessing, cross-validation, hyperparameter tuning and performance visualisation [34].

3.5 Model performance evaluation
Evaluating the performance of a regression model is crucial to understanding its accuracy, reliability and generalisation capability. Various metrics are used to quantify how well the predictions of a model align with the actual values. These metrics provide insights into model bias, variance and overall predictive performance. The most commonly used evaluation metrics for regression models are discussed below.
The coefficient of determination, denoted as
 ${R^2}$
, measures the proportion of variance in the dependent variable explained by the model. For
 $n$
samples,
 \begin{align} {R^2} = 1 - {{\mathop \sum \nolimits_{i = 1}^n {{({y_i} - {{\hat y}_i})}^2}} \over {\mathop \sum \nolimits_{i = 1}^n {{({y_i} - \bar y)}^2}}} \end{align}
where
 ${y_i}$
and
 ${\hat y_i}$
are the actual and predicted target values, respectively. Furthermore,
 $\bar y$
is the mean of the actual target values. The value of
 ${R^2}$
can be interpreted as follows.
-
•
${R^2} = 1$
: The model explains all the variance (perfect fit). -
•
${R^2} = 0$
: The model explains none of the variance. -
•
${R^2} \lt 0$
: The model performs worse than predicting the mean.


The mean squared error (MSE) quantifies the average squared difference between the actual and predicted values. MSE can be calculated as
 \begin{align} MSE = {1 \over n}\mathop \sum \limits_{i = 1}^n {({y_i} - {\hat y_i})^2}\end{align}
Therefore, a lower MSE indicates a better fit. Due to the squared error term, MSE is sensitive to outliers.
The root mean squared error (RMSE) is the square root of MSE, and defined as
 \begin{align} RMSE = \sqrt {MSE} = \sqrt {{1 \over n}\mathop \sum \limits_{i = 1}^n {{({y_i} - {{\hat y}_i})}^2}} \end{align}
RMSE represents the typical size of prediction errors which makes it more sensitive to outliers than MAE.
The mean absolute error (MAE) measures the average absolute difference between actual and predicted values, and defined as
 \begin{align} MAE = {1 \over n}\mathop \sum \limits_{i = 1}^n \left| {{y_i} - {{\hat y}_i}} \right|\end{align}
Since MAE gives equal weight to all errors, it is less sensitive to large outliers compared to RMSE.
The selection of the appropriate performance metric depends on the regression model and the characteristics of the dataset. By choosing the right metric, regression models can be effectively evaluated and optimised for real-world applications.
3.6 Final model evaluation
Four different regression models were trained in MATLAB, and the overall computational effort and training time were modest and very similar across all methods. After this training phase, the cross-validation and testing performance of each model was evaluated by calculating the performance metrics introduced in the previous subsection for the two cruise flight programmes.
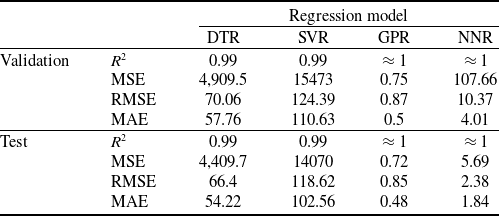
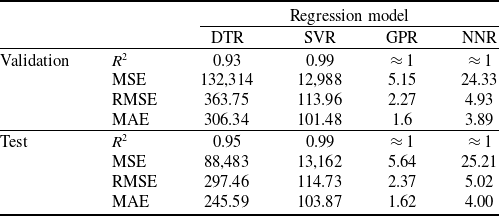
As given in Tables 4 and 5, GPR consistently outperforms the other models across all evaluation criteria. For both cruise flight programmes, GPR achieves near-perfect coefficient of determination values
 $\left( {{R^2} \approx 1} \right)$
in both the validation and testing phases, indicating that it explains almost all of the variance in the observed range data. Furthermore, GPR yields the lowest values in MSE, RMSE and MAE, signifying its superior predictive accuracy and reduced sensitivity to outliers.
Cross-validation and test performance results for the constant velocity and constant lift coefficient cruise

Cross-validation and test performance results for the constant altitude and constant lift coefficient cruise

These results highlight the effectiveness of GPR in capturing the underlying nonlinear relationships between flight parameters and cruise range. The probabilistic nature of GPR allows both accurate prediction and quantification of uncertainty, which is particularly advantageous in aeronautical applications where operational robustness is critical. Considering its consistent and superior performance across both cruise flight programmes, GPR is deemed the most suitable regression model for the aircraft range modeling task undertaken in this study.
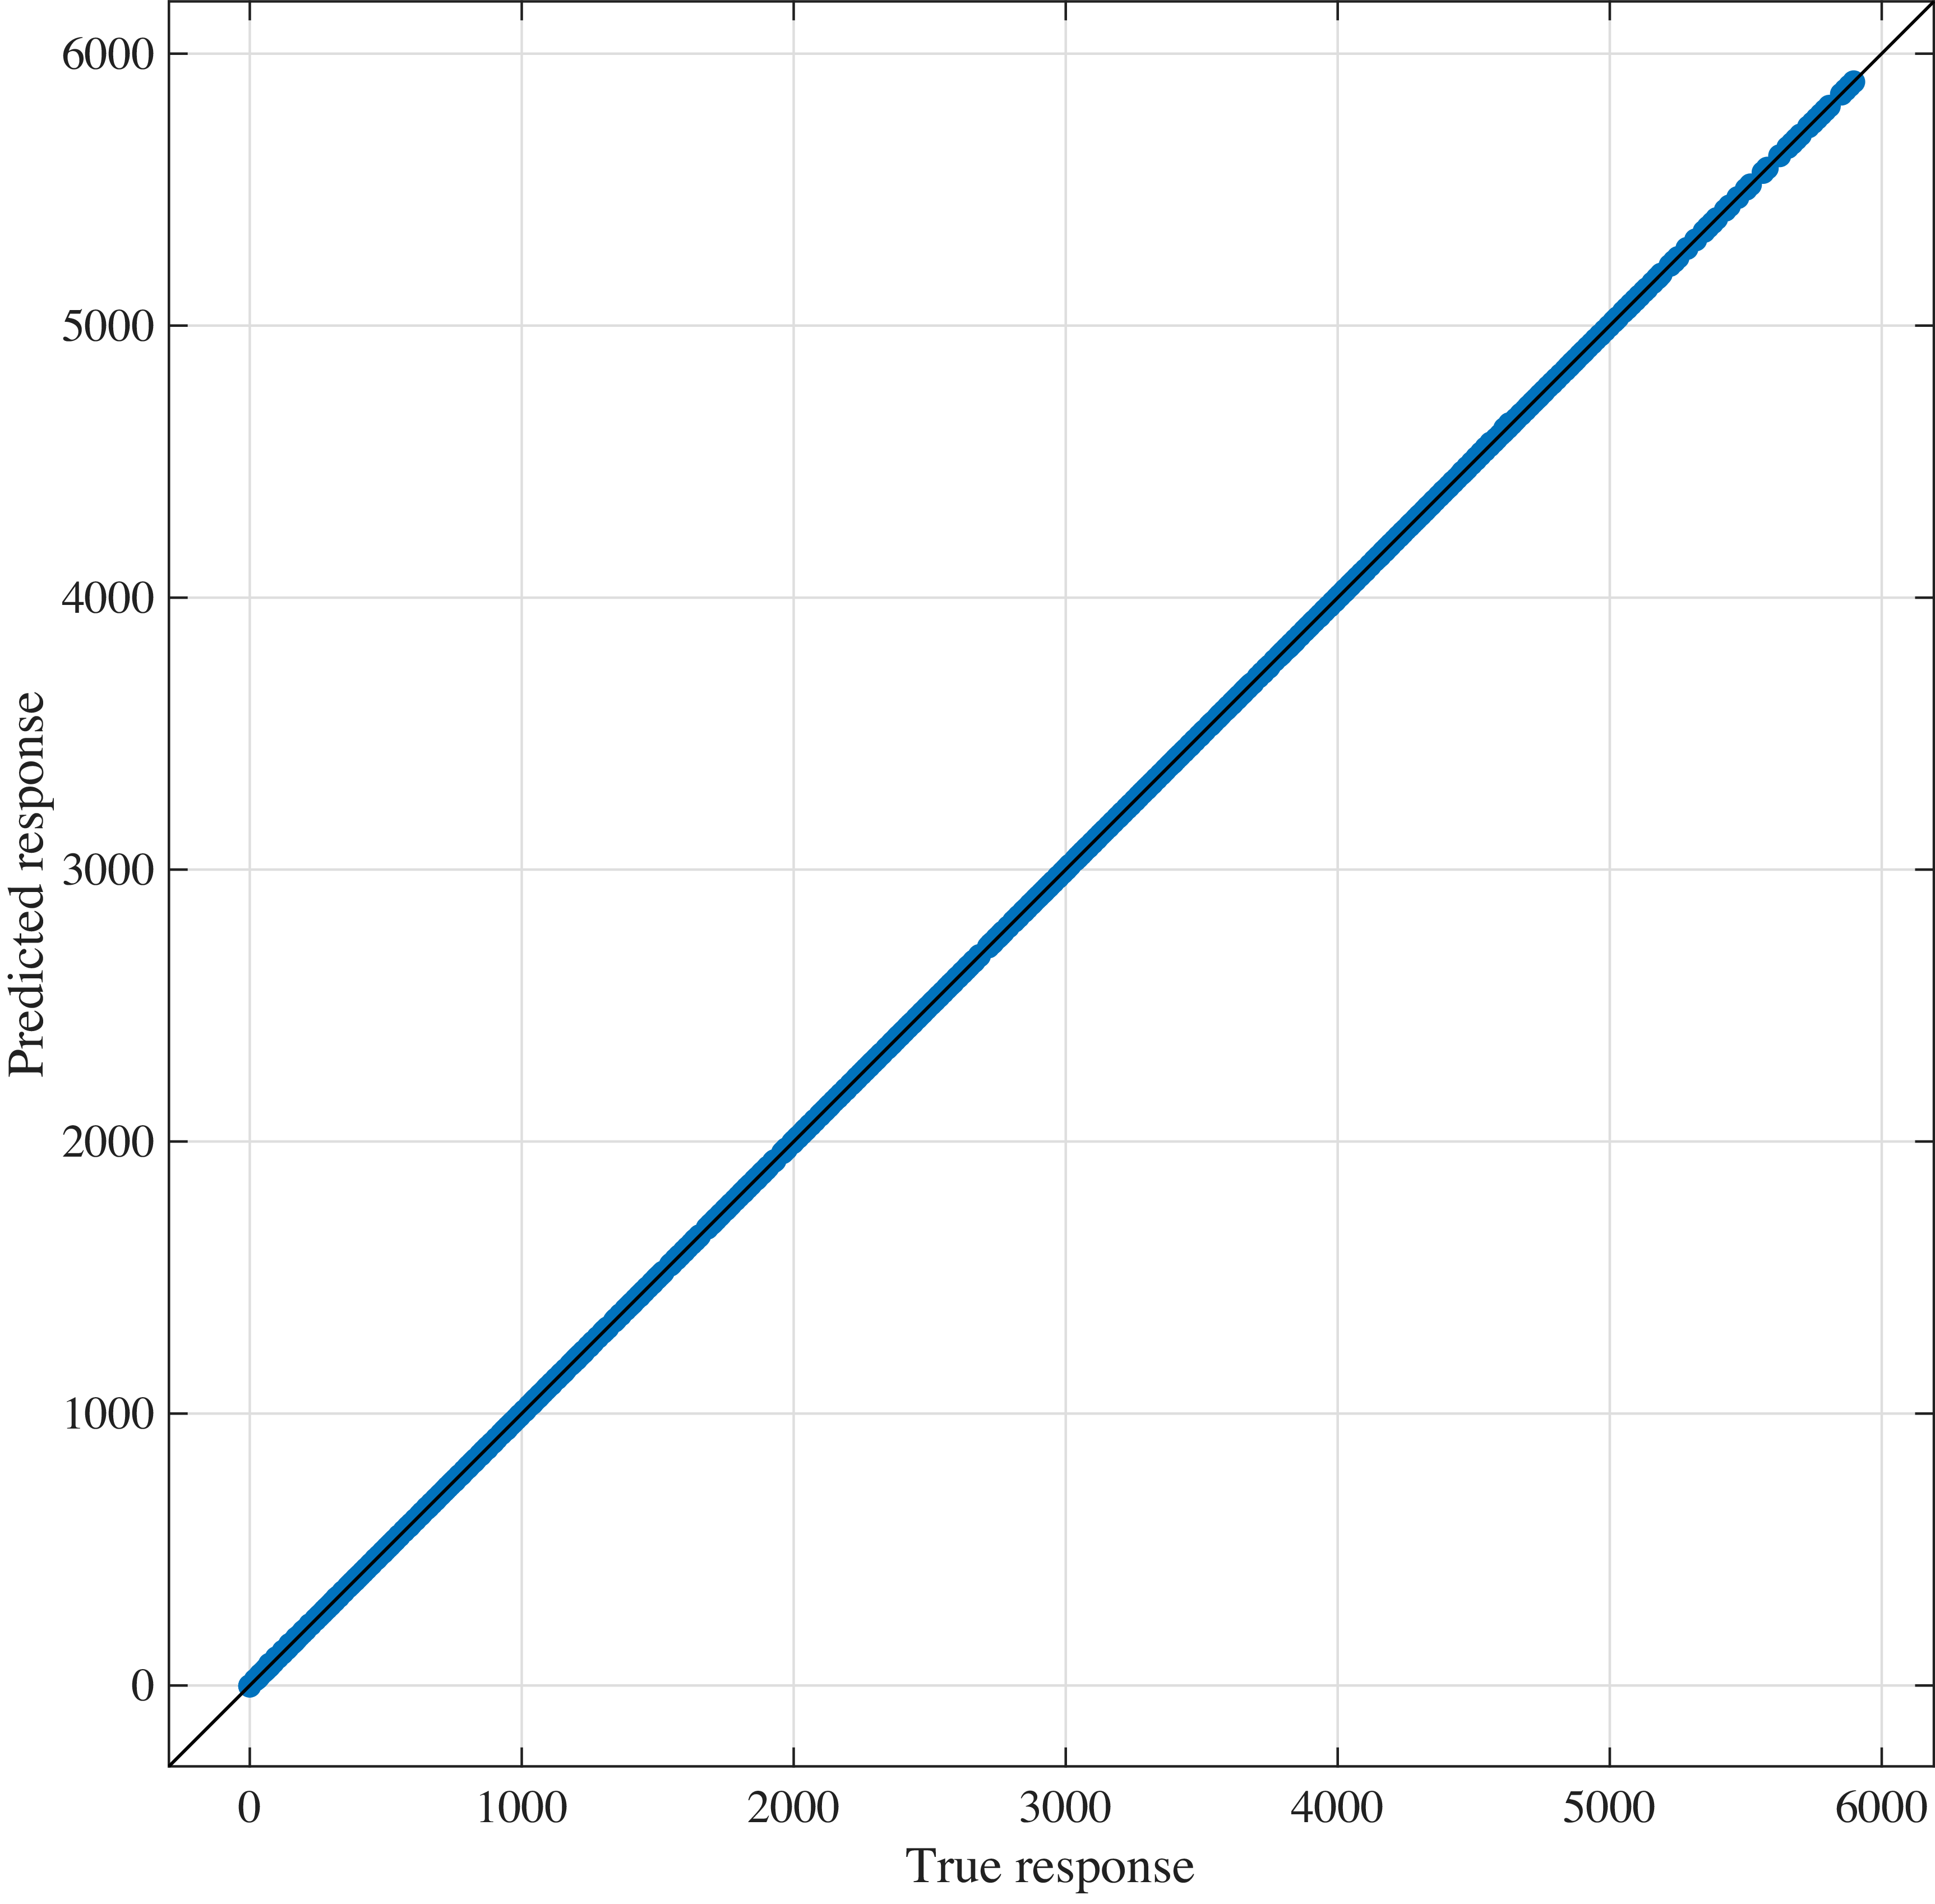
Then, further diagnostic analysis is conducted using predicted vs. actual plots and residuals plots for both the validation and testing phases. These plots serve as essential tools for visually evaluating model performance beyond numerical metrics. The predicted vs. actual plot allows an assessment of overall prediction accuracy; ideally, data points should align closely with the 45-degree line, indicating strong agreement between predicted and true range values. Deviations from this line reveal systematic errors or model bias. The residuals plot, which displays the difference between actual and predicted values (i.e. residuals) against the true values, is used to examine the distribution of prediction errors. A well-behaved model typically exhibits residuals that are randomly scattered around zero without discernible patterns, suggesting that the model captures the underlying structure of the data without systematic bias.
As shown in Figs 2–9, GPR exhibits strong agreement between predicted and actual values during both validation and testing phases, with minimal and homogeneously distributed residuals. This confirms that the model generalises well and does not suffer from overfitting or underfitting. These visual assessments reinforce the conclusion that GPR provides highly satisfactory performance for regression-based modeling of the aircraft cruise range under varying flight conditions.
Cross-validation results of predicted vs actual values with GPR model for the constant velocity and constant lift coefficient cruise.

Cross-validation results of residuals values with GPR model for the constant velocity and constant lift coefficient cruise.

Testing results of predicted vs actual values with GPR model for the constant velocity and constant lift coefficient cruise.

Testing results of residuals values with GPR model for the constant velocity and constant lift coefficient cruise.

Cross-validation results of predicted vs actual values with GPR model for the constant altitude and constant lift coefficient cruise.

Cross-validation results of residuals values with GPR model for the constant altitude and constant lift coefficient cruise.

Testing results of predicted vs actual values with GPR model for the constant altitude and constant lift coefficient cruise.

Testing results of residuals values with GPR model for the constant altitude and constant lift coefficient cruise.

3.7 Model interpretation
While the regression models demonstrate satisfactory statistical accuracy, it is essential to assess whether the learned input–output relationships also reflect known physical dependencies. To this end, Shapley Additive Explanations (SHAP) analysis was applied to the final GPR models to quantify the relative importance of the predictor variables. The mean absolute SHAP values presented in Figs 10 and 11 indicate that altitude and aircraft weight are the dominant factors in the cruise range, while true airspeed has a significantly lower but still notable influence.
Shapley importance values of GPR model for the constant velocity and constant lift coefficient cruise.

Shapley importance values of GPR model for the constant altitude and constant lift coefficient cruise.

These results are fully consistent with aerodynamic expectations. Higher aircraft weight leads to increased fuel consumption and therefore reduced cruise range, a trend clearly captured by the model. Conversely, altitude exerts a strong positive influence up to intermediate values, reflecting the well-known fact that reduced air density at higher altitudes improves aerodynamic efficiency, but with diminishing benefit at very high altitudes where engine performance may degrade. The role of true airspeed is also physically interpretable: range predictions exhibit higher sensitivity in the constant altitude and constant lift coefficient cruise (see Fig. 11), as changes in Mach number directly affect both thrust-specific fuel consumption and drag characteristics.
Overall, the SHAP analysis demonstrates that the machine learning framework does not function as a purely statistical black box. Instead, it embeds meaningful aerodynamic relationships that align with established performance theory. This interpretability confirms that the regression models provide physical insight into the cruise range behaviour of the Boeing 737–400.
4.0 Comparison of machine learning model with analytical range formulas
In this section, a baseline comparison is carried out between the machine learning predictions and the classical analytical range formulas introduced in Section 2. The purpose of this comparison is not to validate the machine learning model in a strict quantitative sense, since the Bréguet-type equations rely on several simplifying assumptions, but rather to provide physical context and to examine whether the overall trends predicted by the regression model are consistent with well-known analytical behaviour. To this end, the analytical range expressions in Equations (1) and (3) are evaluated using the corresponding values of weight, altitude and airspeed taken from the Operations Manual, and the resulting analytical ranges are compared with the machine learning-based predictions.
So as to accomplish the calculations of analytical range formulations, the following procedure is adopted:
i) Obtain the values of altitude, velocity, and initial/final weights of the aircraft from the Operations Manual.
ii) Compute
 $\rho $
at the given altitude.
iii) Compute
 ${C_L}$
from the lift equation.
iv) Compute
 ${C_D}$
from the drag polar, then
 $L/D$
.
v) Compute range with (1) and (3) using an appropriate approximation of
 ${c_T}$
.
(ii) Combining the ISA model pressure and temperature formulas, the air density is given as:
(ii-a) For troposphere (0–11 km),
 \begin{align} \rho \left( h \right) = {\rho _0}{ \left(1 - \frac{{Lh}}{{{T_0}}} \right)^{\left( {\frac{g}{{RL}} - 1} \right)}}\end{align}
where
 ${\rho _0}$
and
 ${T_0}$
denote sea-level air density and temperature, respectively, as given by the ISA model. Furthermore,
 $L$
,
 $g$
, and
 $R$
are the lapse rate, gravitational acceleration and universal gas constant, respectively. Since
 \begin{align*} \frac{g}{{RL}} - 1 = 4.25588,\end{align*}
then
 \begin{align} \rho \left( h \right) = {\rho _0}{ \left(1 - 0.0065\frac{h}{{288.15}} \right)^{4.25588}}\end{align}
with
 ${\rho _0} = 1.225kg/{m^3}$
.
ii-b) For stratosphere (11–20 km),
 \begin{align} \rho \left( h \right) = {\rho _{11}}{e^{\left( { - \frac{g}{{R{T_{11}}}}\left( {h - 11000} \right)} \right)}}\end{align}
with
 ${\rho _{11}} = 0.36391kg/{m^3}$
.
(iii) For steady cruise flight, since lift balances weight (
 $L = W$
), the lift coefficient is computed as
 \begin{align} {C_L} = \frac{{2W}}{{\rho {V^2}S}},\end{align}
where
 $\rho $
is the ambient air density obtained from the ISA model at the corresponding altitude.
(iv) Despite the limitations discussed in Subsection 2.1, a quadratic drag polar of the form (5) is adopted for the analytical range calculations. In Ref. [Reference Sun, Hoekstra and Ellerbroek35], drag polars for several commercial airliners are estimated from ADS-B data and compared with those provided in BADA 3 [36]. For the Boeing 737–400 (B734), the clean-configuration coefficients are reported approximately as
 ${C_{D0}} = 0.021$
and
 $K = 0.0372$
.
The induced drag coefficient is commonly expressed as
 \begin{align} K = \frac{1}{{\pi AR{\rm{\;}}e}},\end{align}
where
 $AR$
denotes the wing aspect ratio and
 $e$
is the Oswald efficiency factor. For the Boeing 737–400 [Reference Roskam and Lan37], reports
 $AR = 9.17$
and
 $e = 0.93$
, which yield a
 $K$
value of the same order of magnitude as the estimate provided in Ref. [Reference Sun, Hoekstra and Ellerbroek35].
In the calculation of
 $L/D$
, the calculated values of
 ${C_L}$
and
 ${C_D}$
are used for both cruise flight programmes. So,
 \begin{align} \frac{L}{D} = \frac{{{C_L}}}{{{C_D}}}.\end{align}
(v) In Ref. [Reference Korba, Balli, Caliskan, Al-Rabeei and Kale38], a detailed energy-exergy analysis for the CFM56-3 series turbofan engines is performed using real engine data. In our study, for the analytical baseline,
 ${c_T}$
during cruise is computed using a conventional thrust-based formulation and a representative calibrated value is chosen:
 \begin{align*} {c_T} = \frac{{{{\dot m}_f}}}{T} \end{align*}
where
 ${\dot{m}_{f}}$
indicates fuel mass flow and
 $T$
is the engine thrust.
The range values computed from the analytical formulations in (1) and (3) are shown in Figures 12 and 13 for the constant velocity and constant lift coefficient cruise, and for the constant altitude and constant lift coefficient cruise, respectively. It should be emphasised that the results of the analytical range formulations serve as a trend baseline, not a high-fidelity performance model. It should be noted that Fig. 12 presents range behaviour at reference climb–cruise altitudes, rather than at a fixed level-flight altitude.
Real (blue line), predicted (red line) and calculated (yellow line) range values for altitude (a) 21,000 ft, (b) 25,000 ft, (c) 30,000 ft and (d) 37,000 ft. The real and predicted curves are almost perfectly aligned, making it difficult to distinguish the two lines despite their different colours.

Real (blue line), predicted (red line) and calculated (yellow line) range values for altitude (a) 10,000 ft, (b) 20,000 ft, (c) 25,000 ft and (d) 30,000 ft. The real and predicted curves are almost perfectly aligned, making it difficult to distinguish the two lines despite their different colours.

As shown in Fig. 12, the Bréguet range results obtained from (1) agree reasonably well with the Operations Manual values at lower aircraft weights. However, as weight increases, the analytical calculations begin to deviate noticeably from the real range data. This trend is expected because higher aircraft weights correspond to lower cruise altitudes where air density is greater. At these altitudes, turbofan thrust exhibits a stronger dependence on true airspeed, hence the simplified and calibrated
 ${c_T}$
model, combined with the quadratic drag polar approximation, cannot fully capture this sensitivity. Consequently, the analytical formulation underestimates the influence of thrust variation and produces increasing discrepancies at higher weights. In contrast, the predicted range values align almost perfectly with the Operations Manual data across the entire weight range, indicating that the data-driven model successfully captures the underlying nonlinear relationships, which are neglected by the analytical formulation.
Beyond the overall agreement, Fig. 12 also reveals a clear altitude-dependent variation in the slope of the range–weight curves. At lower reference altitudes, the range decreases more rapidly with increasing weight, reflecting the higher air density and increased drag sensitivity, a behaviour consistent with classical cruise performance theory and the findings of Ref. [Reference Cavcar12]. This trend is captured by both the Operations Manual data and the machine learning–based predictions.
At higher reference altitudes, the range–weight curves exhibit a reduced slope, indicating improved aerodynamic efficiency due to lower air density, again in agreement with Ref. [Reference Cavcar12]. While the analytical formulation reproduces the general tendency, its reliance on simplified thrust-specific fuel consumption and quadratic drag polar assumptions leads to increasing discrepancies at higher weights. In contrast, the machine learning model preserves the altitude-dependent slope behaviour observed in the manufacturer data, further reinforcing its physical consistency.
A similar behaviour is observed in Fig. 13 for the constant altitude and constant lift coefficient cruise. For a fixed altitude, the deviation between analytical and real range values increases as flight speed rises. This occurs because the thrust required becomes more sensitive to true airspeed at higher velocities, amplifying the limitations of the simplified propulsion and aerodynamic models. The discrepancy is even more pronounced at lower altitudes, where air density is higher and the thrust variation with airspeed is more significant. Again, the machine-learning predictions closely match the Operations Manual values, demonstrating their ability to represent the combined aerodynamic and propulsion effects that are not fully captured by the analytical expressions.
Figure 13 further illustrates the altitude-dependent behaviour of the range and speed relationship. For a given altitude, the slope of the range curve changes nonlinearly with increasing true airspeed, indicating the competing effects of induced and parasite drag. At lower speeds, range is reduced due to higher induced drag, while at higher speeds, increasing parasite drag and fuel flow lead to a steeper reduction in range. This characteristic behaviour is consistent with classical cruise performance analyses and the trends reported in Ref. [Reference Cavcar13].
The altitude dependence of this behaviour is also evident, as lower altitudes exhibit stronger slope variations due to higher air density and increased thrust sensitivity to airspeed. While the analytical formulation captures the general trend, its simplified aerodynamic and propulsion assumptions limit its ability to accurately represent these slope changes across the full speed range. In contrast, the machine learning model closely follows the altitude-dependent range–speed tendencies observed in the Operations Manual data, reinforcing its physical consistency and validity.
5.0 Prediction for unseen data
The prediction workflow, shown in Fig. 14, begins by normalising the unseen predictor inputs using the same z-score parameters (mean and variance) recorded during the initial modeling phase. This step ensures consistency and allows the new input values to be processed in a manner that aligns with the internal representation of the trained model. The normalised input vectors are then fed into the final GPR model to obtain the predicted cruise range values.
Prediction workflow.

To demonstrate the generalisation capability of the developed regression models and to explore the aircraft’s range behaviour under a broader set of conditions, a set of unseen input data has been introduced, consisting of varying weight and speed combinations at three additional cruise altitudes for each cruise flight programmes. Since the GPR model has demonstrated excellent predictive accuracy and generalisation performance, it is well-suited for this exploratory analysis. The purpose of this exercise is to examine the possible range dynamics of the aircraft under different operational scenarios that extend beyond the initially available data.
First, the constant velocity and constant lift coefficient cruise is considered. This flight programme corresponds to a climb–cruise in which the aircraft continuously increases its altitude as fuel is burned, rather than operating at a fixed altitude. However, the Operations Manual reports cruise performance data at discrete reference altitude levels that characterise representative climb–cruise conditions. Based on these reference levels, unseen input data were generated at intermediate altitudes of 23,000 ft, 28,000 ft and 35,000 ft, which lie between the tabulated altitudes in the training set. These altitudes should be interpreted as interpolation points between nominal climb–cruise reference conditions rather than as fixed cruising altitudes. The resulting predictions are shown in Fig. 15, illustrating how range varies with aircraft weight across these intermediate reference altitude levels.
Predicted range values for altitude 23,000 ft (blue crosses), 28,000 ft (red crosses) and 35,000 ft (yellow crosses).

The surface shown in Fig. 15 illustrates how range varies with aircraft weight at different cruise altitudes. The results should be interpreted as range behaviour associated with reference climb–cruise altitude levels, rather than steady level flight at a fixed altitude. As expected, increasing weight (while assuming the same amount of fuel) reduces the achievable range due to higher fuel consumption, while higher altitudes yield improved range efficiency up to a certain level. This trend reflects the aerodynamic advantage of reduced drag at mid-to-high altitudes, consistent with classical performance theory.
Then, the constant altitude and constant lift coefficient cruise is evaluated. A set of unseen cruise flight data is created for altitudes of 15,000 ft, 22,500 ft and 27,000 ft with varying weight and velocity values. The resulting predictions, visualised in Figs 16 and 17, are plotted from different angles. Figures 16 and 17 provide 2D slices of the prediction surface in the constant altitude and constant lift coefficient cruise. The plots clearly demonstrate that range decreases monotonically with increasing weight, while the effect of true airspeed is nonlinear. At lower speeds, range is reduced due to higher induced drag, whereas excessively high speeds also degrade range because of increased parasite drag and fuel flow. The model therefore captures the existence of an optimal speed interval. Taken together, these surfaces confirm that the machine learning model embeds realistic aerodynamic trade-offs between weight, altitude and speed, thereby supporting its physical interpretability.
Predicted range values for altitude 15,000 ft (blue crosses), 22,500 ft (red crosses) and 27,000 ft (yellow crosses).

Predicted range values for altitude 15,000 ft (blue crosses), 22,500 ft (red crosses) and 27,000 ft (yellow crosses).

These predictions provide valuable insight into the range performance of the aircraft in new cruise flight programmes, underscoring the practical applicability of the developed regression model. Furthermore, they also enable a data-driven exploration of how cruise range varies with aircraft weight, speed and altitude, which are the factors that are critical to fuel efficiency, emissions and operational planning as previously emphasised in the introduction.
It should be noted that GPR is primarily an interpolation method and may yield unreliable extrapolations outside the training domain. In the present study, however, the prediction results do not represent extrapolation. The GPR model developed for the constant velocity and constant lift coefficient cruise was trained with altitude values of 21,000 ft, 25,000 ft, 30,000 ft and 37,000 ft, while the predictions, illustrated in Fig. 11, were evaluated at 23,000 ft, 28,000 ft and 35,000 ft. Similarly, the prediction datasets used for the constant altitude and constant lift coefficient cruise were designed in the same manner: while the training data included altitudes of 10,000 ft, 20,000 ft, 25,000 ft and 30,000 ft, the prediction phase was performed for 15,000 ft, 22,500 ft and 27,000 ft, as illustrated in Figs 12 and 13. These lie within the convex hull of the training set, and thus the model is performing interpolation rather than extrapolation. The prediction datasets were also carefully created to be consistent with the flight envelope of the Boeing 737–400, ensuring that all interpolated conditions are operationally meaningful. In addition, the weight ranges used in the latter dataset were explicitly constrained not to exceed the maximum takeoff weight of the Boeing 737–400, thereby ensuring physical realism. As expected, the predicted trends are smooth and physically consistent across these intermediate operating conditions. Nevertheless, we emphasise that caution should be exercised when applying GPR beyond the trained input space, as the associated uncertainty may increase and the predictions may not remain physically reliable.
6.0 Conclusion
This study has demonstrated the efficiency of machine learning-based regression techniques for modeling the cruise range of a jet-powered transport aircraft under two distinct cruise flight programmes. To the authors’ best knowledge, this research introduces the first aircraft range models utilising machine learning in current literature. In contrast to conventional analytical and optimisation-based methods, the proposed data-driven approach offers improved accuracy, robustness and flexibility. Among the tested models, GPR consistently outperformed alternatives in both cross-validation and test phases, yielding near-perfect predictive performance.
In addition, the developed models were also subjected to interpretability analysis using SHAP values. This analysis confirmed that the models reproduce physically meaningful dependencies such as reduced range at higher weights and enhanced efficiency at intermediate altitudes. This outcome is consistent with established aerodynamic principles. Therefore, the proposed machine learning approach provides not only statistical accuracy but also valuable physical insight into aircraft cruise range behaviour.
Using the GPR model, the range dynamics of the aircraft is successfully explored in new flight conditions not present in the original dataset. The results confirm that machine learning regression can serve as a powerful tool in modern aeronautical performance analysis and strategic flight planning. In addition, the comparisons conducted in Section 4 demonstrate that the machine learning predictions capture the physical tendencies expected from classical range theory while also accounting for effects not represented in the analytical formulations.
In addition to the predictions presented in this study, the developed models can be used:
-
• To obtain operational climb-cruise profile by simulating a realistic step climb profile where altitude increases gradually during cruise while maintaining constant velocity and lift coefficient. The predicted range evolution along this path can approximate real-world climbing cruise operations in the case of suitable air-traffic management conditions.
-
• To obtain fuel efficiency mapping across operational envelope, which generates a range-per-fuel-consumed map (i.e. specific range) by combining predicted range with estimated fuel weight differences incorporating an accurate fuel flow rate model. This can guide optimal cruise levels for fuel efficiency.
-
• To obtain operational envelope limits identification by identifying critical points where predicted range starts to degrade sharply, e.g. at very high weights or low altitudes. These boundaries can define the aircraft’s practical cruise range envelope under constant velocity and constant lift coefficient cruise. However, it should be noted that an accurate aircraft thrust model would be needed to combine with the developed range model.
Acknowledgment
The authors acknowledge the use of AI tools (specifically ChatGPT, powered by OpenAI’s language model GPT-5.1; http://openai.com) for language-related improvements, including proofreading, grammar refinement and enhancing the clarity of written English. After using AI tools, the authors reviewed and edited the content as needed and take full responsibility for the content of the published article.