1. Introduction
The migration phenomenon in the Central and Eastern-Europe (CEE) region has quite a long history, being a fairly continuous process, although its intensity has changed a lot over the past two decades. Following a short wave of rural–urban exodus in the 1950s, spatial mobility has been moderate. Moreover, in some large urban centres it has been totally restricted, while international migration was rigorously controlled by the governments.
The political and economic changes that incurred at the beginning of the 1990s have brought about considerable changes in the territorial structure and migration behaviour of the CEE countries, along with a severe economic decline and deepening development differences between the East and the West. One of the possible responses to counteract the increased disparities between core and periphery areas has manifested itself through migration. In 2004 and 2007, the EU’s Eastward enlargement transformed the European space, creating a new geography of migration within and from outside of Europe, contributing to a massive increase of East–West mobility.
The aim of this article is to use spatial autocorrelation techniques to present the current trends and spatial differentiation of migration in CEE countries in the light of EU accession, based on NUTS 3 level available data. The main question is whether we will be able to detect a spatial pattern in the relations of international migration and analyse the main features of the neighbourhood effect.
This article is divided into four parts. The first includes an introduction to the dataset, describing the core hypothesis of the analyses as well as the methodological approach regarding the spatial autocorrelation techniques. The second part describes the conceptual approach regarding migration and core–periphery relations focusing also on transnational and translocal approaches and their relevance in the context of socio-economic development. The third part broadly analyses the migration trends in CEE countries, as well as the possible consequences and challenges of migration, resulting in a comprehensive overview of the current patterns of migratory flows. The final part focuses on the importance of transnational social networks and the effect of translocality in shaping migration patterns and even core–periphery relations in the case of Romanian migrants to Spain and Italy. The findings of the analysis will help bring a new perspective on understanding the continuous changes taking place in core and periphery areas in the context of transnational migration.
2. Data and Methods
The analysis regarding the spatial differentiation of migration is based on existing territorial statistical data obtained from the Eurostat and United Nations database for the NUTS 1 and NUTS 3 levels. The latter consists of 231 NUTS 3 regions for all the 10 CEE countries. The Nomenclature of territorial units for statistics, abbreviated as NUTS (from the French Nomenclature des Unités territoriales statistiques) is a geographical nomenclature subdividing the territory of the European Union (EU) into regions at three different levels (NUTS 1, 2 and 3, respectively, moving from larger to smaller territorial units). The ‘national’ level of the Member State is above NUTS 1.
The identification of representative groups of the territorial concentration of migration is based on the use of spatial analysis techniques, on the use of spatial autocorrelation. The most interesting feature of spatial autocorrelation is its ability to analyse location and attribute information at the same time.Reference Goodchild 1 The analysis of spatial autocorrelation is based on the calculation of Local Moran’s I statistic (cluster and outlier analysis) and Getis-OrdGi* criteria (hot spot analysis). The Local Moran’s I statistic can be used to test whether the variables of the absolute convergence equation are clustered in space. This is calculated as:
 $$I_{i} ={{\left( {x_{i} {\minus}\overline{x} } \right)\mathop{\sum}\limits_{j=1}^n {w_{{ij}} \left( {x_{j} {\minus}\overline{x} } \right)} } \over {\mathop{\sum}\limits_{i=1}^n {\left( {x_{i} {\minus}\overline{x} } \right)^{2} } }}$$
where x
i
is the value of the monitored variable in unit i, x
j
is the value of the monitored variable in unit j,
 $$\bar{x}$$
is the arithmetic average of the monitored variable, and w
ij
is the generic element of contiguity matrix. The Local Moran’s I decomposes the global spatial pattern and indicates to which extent a geographic locality is surrounded by similar/dissimilar values forming a geographical pattern. The null-hypothesis of the test statistic is the absence of spatial autocorrelation, implying that location does not matter.Reference Feldkircher
2
A high positive local Moran’s I value implies that the target value is similar to its neighbourhood, and then the locations are spatial clusters, which include high-high and low-low clusters (high values in a high value neighbourhood and low values in a low value neighbourhood). At the same time, a high negative local Moran’s I value implies a potential spatial outlier, which is obviously different from the values of its surrounding locations. Spatial outliers include high-low (a high value in a low-value neighbourhood) and low-high (a low value in a high-value neighbourhood).
A second way to examine the spatial pattern of the data is by using the Getis and OrdGi* statistic. Unlike the Moran’s I statistic, which is a kind of correlation coefficient between observed values and locations, the Gi* statistic measures the concentration of a spatially distributed variable. This index is calculated as follows:
 $$G_{i}^{{\rm {\asterisk}}} ={{\sum_{j=1}^n w_{{i,j}} x_{j} {\minus}\bar{X}\sum_{j=1}^n w_{{i,j}} } \over {S\sqrt {{{\left[ {n\sum_{j=1}^n w_{{i,j}}^{2} {\minus}\left( {\sum_{j=1}^n w_{{i,j}} } \right)} \right]} \over {n{\minus}1}}} }}$$
where x j is the attribute value for feature j; w ij is the spatial weight between feature i and j; n is equal to the total number of features.
The resultant z-scores and p-values tell us where features with either high or low values cluster spatially. This tool operates by looking at each feature within the context of neighbouring features. If large values of the examined variables are clustered close to region I, Gi* will be large as well (hot spot). The local sum for a feature and its neighbours is proportionally compared to the sum of all features. When the local sum is very different from the expected local sum, and the difference is too large to be the result of a random chance, a statistically significant z-score results. For statistically significant positive z-scores, the larger the z-score, the more intense the clustering of high values (hot spot). For statistically significant negative z-scores, the smaller the z-score, the more intense the clustering of low values (cold spot). This means that Gi* statistic shows solely positive spatial correlation, ‘high-high’ clusters are indicated by positive spatial correlation, and ‘low-low’ clusters by negative ones.Reference Feldkircher 2
The values resulting from the spatial autocorrelation analyses have been calculated and illustrated by means of the GeoDa Software version 1.6.2 and ArcGis software version 10.1.
3. Results and Discussion
3.1. Theorizing Migration: Towards a Transnational Perspective
At the end of the 1980s, most migration researchers noted that a new type of migrating population was emerging, with a migration behaviour that was unlike any other pattern predicted by migration theories at that time: these people have maintained close relations with their friends and relatives from countries of origin for much longer periods than had previously been assumed. Soon enough, a group made up mainly by researchers from the field of anthropology started discussing new ways to conceptualize the new migrant population phenomenon, eventually defining it as ‘transnationalism’. In a broader sense, transnationality represents the connection between migrants and non-migrants across national borders. Some scholars have argued that transnationalism has changed individual’s relations to space mainly by creating ‘social fields’ that position some people in more than one country and allow families to live a transnational life while adopting transnational identities.Reference Glick Schiller, Basch and Blanc-Szanton 3 – Reference Faist 7 The migrants’ transnational way of life has also lead to the creation of a transnational social space, which – according to Faist – consists of a combination of social and symbolic ties, positions within networks and organizations that can be found in at least two distinct places.Reference Faist 8 This means that transnational spaces encompass localities and transnational practices and flows. In this general mobilization of post-modern and globalized societies, national frames of reference have been weakened not only ‘from below’, as a result of emerging local and regional entities, but also ‘from above’ through the process of Europeanization and globalisation, by establishing macro-regional and global networks.Reference Pries 9 Technological advances, the widespread penetration of air-transport and its accessibility, the radically transformed communication assets have all facilitated transnationalism on a large scale and have increased the possibilities for migrants to foster links with their home societies. Discourses about transnationalism tend towards the conclusion that the territorially fixed space as a concept has become less important, as globalization and transnationalization processes have extended social and cultural interdependencies and have dissolved boundaries.Reference Beck 10 , Reference Massey 11 Pries, in his transnational social space concept claims that globalization leads to a de-territorialization (and re-territorialization) of social processes and practices,Reference Pries 9 the latter showing the increased importance of location and characteristics of place for global economic activity (glocalization). In the research of Glick Schiller, these concepts appear as the end of ‘methodological nationalism’. She calls for scholars to recover rather than develop a global perspective on migration, suggesting a ‘locality analysis’ of a global power paradigm.Reference Glick Schiller 12 Empirical studies on transnational migrants have shown that the ‘local sites of global processes do matter’Reference Guarnizo and Smith 13 through the complex interaction between several locations, or, as Latour puts it, a network remains local at all points.Reference Latour 14 Migrants are important factors for reshaping localities both in their countries of origin, by maintaining strong social and cultural bonds with their families (holiday visits, remittances and circular migration patterns) as well as in hosting countries through their encompassed capital and their chosen role within the respective social structures (property values, own business, cultural and consumption patterns). In this process, the existing social networks have developed an increasingly important role as they facilitate both the migration movement, as well as the individual adaptation in the destination country. It has empirically been shown that communities with longer experience in migration have a much more extensive migration network,Reference Elrick and Ciobanu 15 which further contributes to the expansion of their migration chain. The key issue is how migration channels embed some localities in a wider context and rescale their positions at a regional, national or global level.
3.2. Transnational Migration and Core–Periphery Relations
Wallerstein has classified countries according to their positioning within the global market economy,Reference Wallerstein 16 while Skeldon proposed a global regionalization of migratory movements, in which he distinguished five ‘development tiers’: the old (1) and new (2) core countries, characterized by immigration and decentralization (e.g. Western-Europe, North America, Japan); the expanding cores (3), which involves both emigration and immigration and internal centralization (Eastern Europe, Eastern China, Southern Africa); the labour frontiers (4), characterized by emigration and internal centralization (e.g. Morocco, Egypt, Turkey, etc.) and the ‘resource niches’ (5), with weaker forms of migration (e.g. parts of central Asia and Latin America, many sub-Saharan countries).Reference Skeldon 17 Based on the transnational migration approach, core-periphery relations will be analysed from the point of view of emigration–immigration. In this duality, receiving/immigration countries tend to be associated with the idea of centrality, accumulation of human resources and connectedness, while emigration areas can be associated with the idea of periphery, justifying the ideological scheme of dominance and dependence on the centre. Hence, the author suggests understanding the continuous emigration of many CEE regions as a form of peripheralization.
Emigration (peripheral) regions are areas not sufficiently integrated at a given place and time into dominating structures, processes and systems.Reference Schmidt 18 Lagging behind, slow development, passiveness, closeness and marginal, became concepts most frequently associated with high outflow areas.Reference Daugirdas and Burneika 19 Churski argues that peripherality (like emigration) – being a natural phenomenon – cannot always be considered negative, as not all problem regions are peripheral and not all peripheral regions must necessarily be problematic.Reference Churski 20 In this sense, countries with a high emigration rate can benefit from low unemployment, reduction of poverty, increased incomes, and low pressure on the health- and welfare systems.
As Western Europe is usually associated with being the ‘centre’ or ‘core’, very few studies are dealing with problems of decline and shrinkage in core regions, nor with the emergence of some ‘hidden champions in hidden regions’, referring to new forms of peripheries and cores and to some of the changeovers taking shape together, which overlap at different spatial levels.Reference Aring and Reutther 21 From a Western European perspective, Eastern European countries usually appear as peripheries, as countries sending out a high number of the population, although there is always the possibility of finding these ‘hidden champions’ with high levels of population inflow. As peripheries arise at different territorial levels, it depends on the social viewpoint, and on the selected scale, whether some regions are identified and stigmatized as being a periphery (emigration regions perceived as periphery), giving this duality certain multi-scalar characteristics. Inner or outer peripheries, economic, social cultural or environmental peripheries appear in different social and political discussions, although their classification can largely differ based on the perception of the respective society. It is crucial to recognize that processes of centralization and peripheralization are socially constructed phenomena and should not be considered as something given, meaning that the categories mentioned above can be socially changed or reconstructed. Core–periphery relations and peripherality itself cannot be understood as static concepts, neither can modern social changes or the changes in migration be considered as uniform, linear and static processes since they all involve continuous transformation: not all cores or peripheries, emigration and immigration zones will follow similar developmental patterns and no historical movement can permanently determine the eternity of the status of cores and peripheries. This is what gives peripherality the characteristics of temporality. Angus and Shoesmith have pointed out that ‘centres are as much dependent upon their margins as the margins are on the centre’.Reference Angus and Shoesmith 22 This proves that emigration–immigration processes are closely linked and interdependent at all times, which also influences the centrality and peripherality of certain localities.
3.3. Understanding Main Migration Trends in CEE Countries. New Cores – Stable Peripheries
In the late 1980s and early 1990s the collapse of the communist regimes in Central and Eastern Europe has opened the way for new political and economic administration/governance. Analysing the main migration trends in the New Member States, four phases of migration can be distinguished.
At the beginning of the 1990s, when the former communist states had regained their long-lost freedom, western countries started fearing a huge east–west exodus as a reaction to the removal of restrictions for international travel. But, interestingly, the vast migration potential that has accumulated over the communist period has only unfolded gradually. Most Romanian, Bulgarian and other CEE citizens initially chose other neighbouring former socialist states as their main destination, moving west only at a later stage, following EU accession. In this period, the most straightforward causes for migration were – next to the removal of barriers – of ethnic, national and religious origin: hundreds of thousands of people being part of national minorities migrated into and from Eastern and Central Europe.
In the second phase, from the mid-1990s until the 2004 EU accession, labour migration accelerated due to free travel opportunities, coupled with the possibilities of free mobility (although with some restrictions for Romanian and Bulgarian citizens until 2014). As in most CEE countries, economic restructuring had generated high unemployment rates, a great number of CEE citizens have profited from irregular migration – usually with circular character – as well as from regularly organized labour market programmes.
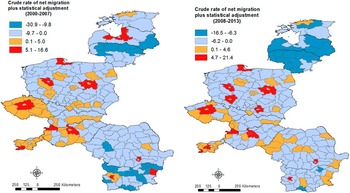
Following the 2004 and 2007 enlargements, the EU labour market has been characterized by intra-EU mobility, fuelling serious concerns related to the potentially massive inflow of cheap labour from the less developed countries. The main concerns were whether this migration would further increase the already high unemployment rates, whether it would abuse the existing welfare system, and if it would contribute to increasing levels of criminality. It must be mentioned that during this period the increment of immigrants in the EU-15 (increasing from 1.6 million to 4.5 million) was also influenced by regularizations, favouring mainly Romanian and Bulgarian citizens, which explain the huge inflows of EU-2 migrants to Italy and Spain.Reference Bélorgey, Garbe-Emden, Horstmann, Kuhn, Vogel and Stubbs 23 Comparing the expectations of east–west migration with the real number of people migrating, the initial scepticism and fear of being ‘flooded’ by migrants from the new members have been somewhat unfounded. This migration pattern is very well illustrated by Figure 1 showing the large difference between the East and the West during the 2004 and 2007 EU accession, when only the more developed countries (compared with other CEE states) such as Hungary, Slovakia and the Czech Republic stood out with a positive net migration rate.
Crude rate of net migration plus statistical adjustment for the period 2000–2013. (Source: the author, on the basis of data obtained from Eurostat. To view this figure in colour please see the online version of this journal.) 24

The fourth phase starts with 2008, a year marked by global financial and economic crisis. One of the most important reactions to the reductions of economic activity among migrants was the return to their home countries. Starting with this year a decline in workers’ mobility has been registered (mainly in the 2008–2009 period), although still far from the initially envisaged mass return migration. Only country reports from Poland and Slovakia have started indicating increasing numbers of returning temporary migrants, whereas in Romania and Bulgaria the slight increase in the number of migrants was mostly due to the economic development of some counties such as Timis, Arad, Bihor and Cluj from the West, Sibiu and Brasov from the Centre, Iasi and Constanta from the East (being the most important tourist Romanian region) along with the capital Bucharest. This is also the case with Bulgaria where in the period 2008–2013 some counties witnessed a positive net migration rate, especially the coastal counties Varna and Burgas, together with Plovdiv and the capital region – Sofia.
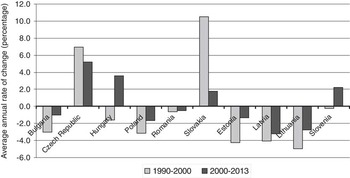
The intensity of migration can be illustrated by the data on net migration rates provided by population statistics which are available for most CEE countries. Analysing the data for an extended period, it can be stated that several countries have strongly been affected by the negative net migration rates. In the initial phase, the Baltic countries – in this particular case due to return migration of ethnic groups – along with Poland, Romania and Bulgaria have become the most important emigration states. According to the calculations of some authors, about 950,000 persons have left Poland during the 2004–2006 period.Reference Grabowska-Lusińska and Okólski 25 Moreover, the migration of Polish citizens to EU countries is often perceived as a temporary migration, counterbalanced by the increased return migration between 2008 and 2009 mentioned above. In this context, the high outflows from the previously mentioned countries could be understood as a peripheralization process with its negative demographic and economic consequences: population decline and lower economic dynamics, demographic ageing, labour shortages and low fertility rate. The unemployment rate has remained high, which further emphasizes the strong peripheralization process.
Several countries from Eastern and Central Europe which have experienced economic growth and political stability (Slovakia, Slovenia, the Czech Republic, Hungary) became the most important destinations for foreign citizens, labelling their status as a net immigration country. Thus, in Hungary, net immigration peaked in 1990 when thousands of ethnic Hungarians came into the country (mainly from Romania).Reference Hars 26 This was shortly followed by a rapid decline during the 1992–1994 period, but a quite visible increase after EU accession. Although the number of people established in Hungary has shown a significant decline over the last few years, followed by a huge emigration of national citizens especially to Germany (41.1%), the UK (17%) and Austria (13%), in comparison to other European countries, Hungary has been a state with a low, but positive, balance of international migration ever since 1990. 27
Another CEE European country has rapidly become the most important immigration country for post-soviet residents (for citizens coming from Ukraine, Slovakia, Vietnam, Russia and Poland) due to the favourable economic situation and growing labour demand. The number of foreigners in the Czech Republic has increased notably after 2000, reaching values of up to 394,000 people, representing more than 3% of the population.Reference Drbohlav, Lachmanova-Medova, Cermak, Janska, Cermakova and Dzurova 28 This trend illustrates its highly attractive character as a destination for immigrants among CEE countries (Figure 2).
Overview on migration flows in new EU member states. (Source: United Nations, Department of Economic and Social Affairs (2013). Trends in International Migrant Stock: Migrants by Destination and Origin.) 30

On the other hand, we can also conclude that in the early years of the twenty-first century Poland, Romania, Bulgaria and the Baltic States were still the net emigration states of the EU. However, immigration to Poland has started to show a small but steady growth due to the growing number of foreigners (from Ukraine, Germany or Belarus) but also because of Polish return migrants, although the country is still quite far from becoming a net immigration state.Reference Drbohlav 29 This migration movement has shown us how an initially semi-peripheral region encompassing a significant outflow could slowly become a core or an immigration country.
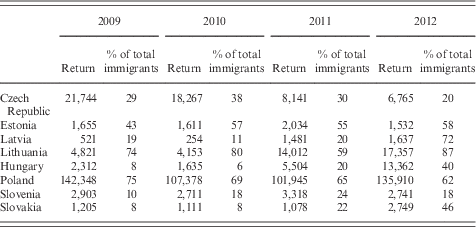
Relevant information on centrality and peripherality could also be highlighted by analysing the ratio between nationals and foreigners in the immigration and emigration processes from and to CEE countries. The highest rate of return migrants in the total number of immigrants can be observed in Poland and Lithuania (more than 60% of the total immigrants) although even here we can notice significant fluctuations in the scale of return migration between 2009 and 2012 (Table 1). More precisely, while Latvia, Hungary and Slovakia underwent a significant increase in the scale of return migrations in this period, the Czech Republic and Poland have recorded a slight decrease. Data also show that in Estonia, Lithuania and Poland return migration has represented the main source of inflow in 2012, while in the other CEE countries, and especially in the Czech Republic, Slovenia, Hungary and Slovakia, the inflow of foreigners was much higher than those of nationals. This evolution of the ratio between foreigners and return migrants can also underline the character of centrality of the countries mentioned.
The evolution of return migrants

Source: Eurostat, Immigration by sex, age group and citizenship 24
As highlighted by the social network theories, both in the pre- and post-accession periods migration has led to the build-up of strong networks of contacts, which made it much easier to analyse the origins of major migrant groups. Looking at the composition of migration, the post-communist heritage can clearly be identified in the evolving patterns. Thus, the most important non-EU immigrants of the Baltic States are from Russia, which can be explained by the considerable size of the Russian minority in this area, as well as family-related migration. But it is not only the Russian minorities that can be explained by historical backgrounds and even by a strong and well-established migration network. While the largest Hungarian migrant community can be found in Germany, there are also large groups of Romanian residents in Hungary deriving from historical movements and kinship ties, as large parts of today’s Romania were once part of Hungary. In addition, the considerable number of Vietnamese people in the Czech and Slovak Republic can be explained by the international division of labour in the former Soviet bloc.Reference Barnickel and Beichelt 31 All these illustrate in fact that the migration patterns in the CEE countries are strongly connected to historic events and kinship networks, and not just to economic factors.
3.4. Spatial Cluster and Spot Analysis
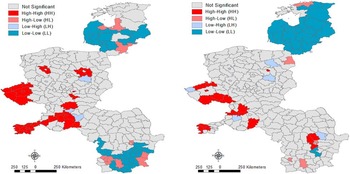
After determining the local Moran’s I and Gi* statistics for each of the communities, the communities can also be classified into homogenous groups – clusters. During cluster identification, the most important aspect is to track down how the migration rate of a certain settlement relates to that of other settlements in the neighbouring areas. The analysis was carried out for both the 2000–2007 period, when the accession of the 10 CEE countries was finished, as well as for the 2008–2013 period, when the direction of migration was perturbed by the global economic crises. After conducting the computations and the graphic representations of the results, we could identify two main clusters both for the 2000–2007 as well as for the 2008–2013 period. In the eastern part of the CEE countries, net migration rate ‘cold spots’ could be found, which correspond to a positive but low-low spatial autocorrelation, indicating spatial clusters of settlements with below-average migration rates. In contrast, in the western part of the analysed area, net migration rate ‘hot spots’ could be identified, which correspond to a positive, high-high spatial autocorrelation indicating spatial clusters of settlements with below-average migration rates (Figuer 3).
Cartogram of clusters representing the net migration rate, period 2000–2007 (left) and 2008–2013 (right) based on Local Moran’s I. High-high represents a high migration rate both in the communities, as well as in their neighbourhood. Low-high represents those communities with low migration rate, but with a high value in the neighbourhood. Low-low represents areas with low migration rate both in the community, as well as in the surrounding areas. High-low shows the communities with high migration rates, but with a low value in their neighbouring areas. (Source: Own elaboration with GeoDa 1.6.2 software on Eurostat database (5% significance level and K-nearest neighbour weight). To view this figure in colour please see the online version of this journal.)

If in the 2000–2007 interval, according to the Local Moran’s index period, a clear east–west difference could be observed: Hungary, Slovakia and the Czech Republic representing the core areas while Romania, Bulgaria and the Baltic States were the periphery, in the second part of the analysed period some ‘new’ cores appear, especially around the two capitals, Bucharest and Sofia, underlining their emerging position and increasing importance, both among the CEE and among the EU countries.
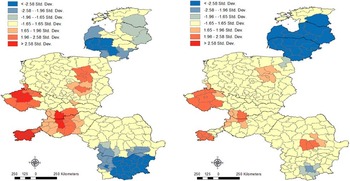
The spatial pattern of migration is also very well illustrated with the help of Gi* statistics revealing almost the same local distribution as the local Moran’s I statistic: a clear difference between the eastern and western part and the outlining of some local centres in the eastern part. Albeit from a broader view, the overall position of Romania and Bulgaria seemed to remain the same, the two statistics reveal that some local changes could influence their embedded spatial status (Figure 4).
Cartogram of clusters representing the net migration rate, period 2000–2007 (left) and 2008-2013 (right) based on Gi* statistic (Source: Own elaboration with ArcGis 10.1 software on Eurostat database. To view this figure in colour please see the online version of this journal.) ≥1.645 represent 90% significant; ≥1.960 represent 95% significant; ≥2.576 represent 99% significant and ≥3.291 represent 99.9% significant.

The above analysis underlines the theoretical background of the paper, focusing on the temporality of peripheries and revealing some hidden champions in hidden regions.
3.5. Migration Trends in Romania after the Accession Period: The Emergence of Locality and Transnationality in Romanian Migration Networks
After Romania’s accession to the EU (along with Bulgaria), its citizens gained the freedom to travel to Europe, which has deeply marked the direction and intensity of the migration process, as well as migrants’ transnationalism. Sharp decreases in economic activity, disappointment regarding the path and speed of transition towards a market economy,Reference Rangelova and Vladimirova 32 increasing prices, closure of industrial plants, and high differences in earnings and living standards have represented the main reasons for people’s international mobility. It is hard to estimate the number of Romanian citizens living abroad in recent years because short-term circular migration represents a large share of total temporary emigrants. According to Romanian National Statistics, there are approximately two million Romanians working abroad, representing about 10% of the total population. Owing to the higher inflow of migrants into the UK and Ireland following the 2004 enlargement, access to the labour market there was restricted for Romanians for the first two years after accession. Thus, the preferred destination areas for Romanian workers have been Southern Europe, especially Spain and Italy and, to a lesser extent, Germany.Reference Boboc, Vasile and Todose 33 According to OECD statistics, 34 more than 500,000 Romanian migrants were present in Italy in the year 2007, although Romanian sources emphasize that currently there are about 968,000 legal Romanian migrants living in Italy, and around 770,000 in Spain. 35 The existing migration networks, the geographic and linguistic accessibility, and the large amounts of seasonal work are all key factors in attracting Romanian workers.Reference Fic 36
Empirical studies have shown that both internal as well as international migrants tend to maintain close ties with their communities of origin for a rather extensive period.Reference McDowell and de Haan 37 As pointed out, the huge emigration originating from Romania has mostly spread along the existing networks. Hence, based on the existing impact studies and policy implications, I will later focus on how migration networks can be analysed from the transnational and translocal perspectives.
As a starting point, it must be mentioned that Romania had well-established social networks even before 1989, mainly through ethnic minorities (Germans and Hungarians) who have secured links to Germany and Hungary. These existing social ties played an important role in facilitating new migration connections, but the experience of some pioneering workers looking for work abroad has further contributed to the development of new economic connections to other countries.
In the first stage, migration from Romania to Spain and Italy was irregular, characteristic for post-socialist migration. In this process, workers from Transylvania and Moldavia were among the first to receive passports right after 1990. In the following period and up until the year 1996, the migration process gained a more regular character as a result of early established migrants building up a large migration network, which connected their communities of origin with different locations in Spain.Reference Elrick and Ciobanu 15 Migration networks were often based on kinship structures, helping people with information through different sources and supporting them throughout the entire migration process; remittances and attending to newcomers being the most common tools for creating social ties. Later, as legal migrants have had the possibility to establish companies and work independently, the process has also contributed not only to the expansion of migrant networks but also to transferring the characteristics of their places of origin. Shops, restaurants and other forms of services have been the forerunners of this approach.
Spanish-Romanian bilateral agreements, with a focus mainly on agriculture, have somewhat managed to weaken the previously established social networks, as they offered a legal background and a more secure environment both in economic and social terms. Due to the complexity and bureaucracy of the procedure, though (after the contracts ended migrants had to personally report back to a public body in Romania if they wanted to benefit from the possibilities offered by the bilateral agreement again), many such migrants have often returned individually to work for better wages. As a result, they have become the new generation of pioneering migrants, helping the communities of origin in building new migration networks. Therefore, in places where migration networks have become widespread, people have chosen not to migrate according to the bilateral agreements.Reference Elrick and Ciobanu 15
One of the key factors in the emerging transnationalism was the high level of remittances that boosted local consumption and had a positive effect on the development of the local activities. According to the World Bank, remittances in Romania reached €484 million in the first quarter of 2014. The highest remittance flow into Romania originates from Italy (29.3%) and Spain (29.2%), but other countries such as Germany (5%), France (1.99%) and the United Kingdom (1.95%) also stand out. The large amounts of money sent back home were used to invest in real estate or have been deposited in Romanian banks. In many parts of the country the phenomenon of people working abroad has clearly left its mark on the local landscape by ‘drawing up’ huge individual houses, in many cases disrupting the initial continuity between migrants and non-migrants, as the former had better living conditions, and were able to afford things that local communities could only dream about. In this case, transnationalism has contributed to the increasing ‘heterogeneity and struggles between conflicting identities and groups that are (re-)negotiated in the local place’Reference Ehrkamp 38 . While analysing the Romanian migrants in Italy, Anghel talks about migration and transnational practices ‘from below’ which have led to a restructuring of the local economy and local social relations in multiple ways.Reference Anghel 39 In a broader context, but also on a local scale, this can be understood as an emerging peripheralization process (in the case of non-migrants), as returning workers or workers’ families could afford to spend more and more on consumption as compared with the rest of the population.
Following the year 2002, when the visa system was abolished for Romanians, migration has become much easier and its characteristics have significantly changed. Previously, only those of a higher level of income and with the necessary social relations could receive a visa. These two factors, economic (in the sense of material resources) and social (in the sense of existing relations), have substantially determined the character of the migration pattern. On the other hand, after 2002 we can effectively talk about a higher migration process and, as a result, the transnational social space between Romania and Spain/Italy has only partially remained dominated by well-established (mostly kin-based) networks while individual short-term or circulatory migration has become the dominant form.
The EU expansion in 2007 influenced the migration pattern even more, increasing the mobility between Romania and other EU countries. This process made it even easier to reach Spain or Italy, even though it has become much harder to obtain a work permit or to find a job. Even so, the level of remittances has remained fairly high, while the EU free movement policy has contributed to intensifying migration and transnational practices even further.
Summing up, according to general theories of transnationalism, the Romanian migrants developed a transnational space based on the kinship network.Reference Anghel 39 The initially brittle social relationships across localities have massively expanded in a very short timeframe, leading to the strengthening of transnational migration networks, thus contributing to the expansion of trans-local and transnational practices. This has further contributed to rescaling some localities’ positions and to deepening the existing centralization-peripheralization process, including through local communities.
4. Conclusions
The rapid transition process from a state-planned to a market economy, taking place simultaneously with what we call Europeanization (European integration) and globalization, has embedded the post-socialist migration dynamics in a totally new context, calling for a new approach in studying East–West mobility, both from a theoretical/conceptual and an analytical point of view. The overview of migration patterns in CEE countries has revealed important changes in their migratory patterns and spatial location. Each country can be considered responsible for shaping its own internal mobility and finding its position within a regional, continental or global context. On a wider scale, the CEE area can be considered at the moment both a global economic semi-periphery and a regional political core (EU membership).Reference Kureková 40 In a proper sense, there is also an internal fragmentation regarding immigration–emigration processes among CEE countries. The concentration of migrants in prosperous regions and the comparatively higher immigration in the Czech Republic, Hungary, Slovenia and Slovakia show that the success of economic transition significantly influences migration flows and spatial locations. In this context, the two eastern gates of the EU, Romania and Bulgaria remain the symbols of periphery, both from an economic and from a labour migration perspective, although with explicit internal differences. It is important to acknowledge that as the centre influences the periphery, the periphery itself contributes to strengthening the position of the core. Many authors have argued that Western and Eastern Europe reciprocally affect each other in the sense that post-socialist countries have acted as a buffer zone at the beginning of 1990s, protecting the countries of Western Europe by absorbing large numbers of refugees from the former Yugoslav countries.Reference Collinson 41 At the same time, the more developed Western and Southern European countries have started liberalizing their labour markets, thus contributing to the emergence of a new economic migration. However, some empirical analyses highlighted the fact that this migration has further contributed to deepening the existing core–periphery differences, and to increasing regional differences by pooling the highly skilled labour force in developed regions and depriving the depressed ones.
In the traditional way of thinking, international migration was supposed to play an important role in reshaping territorial convergence in the long run. In the more recent literature, migration has been considered a cause for further divergence among advanced and backward regions because higher returns to production factors are expected to take place in regions where these factors already show a high level of concentration.
In addition, migration policies have played an important role in shaping migration patterns. The transnational approach of analysing the Romanian migrants to Italy and Spain has revealed how policy implications at EU level have influenced the trans-locality and migrant decision-making ability in taking up all migration opportunities arising from policy changes.Reference Elrick and Ciobanu 15
As this study has revealed, migration processes over the last 10 years have further deepened the existing gap in the core–periphery relations, not only at supra-national (EU and other CEE countries, between CEE countries) but also at local level (between migrants and non-migrants), rescaling the position of certain communities in a wider context. Moreover, the methodology used in this study underlined the existence of spatial pattern of migration distribution and the existence of spatial autocorrelation.
Ibolya Török is a Senior Lecturer at the Faculty of Geography, Babeş-Bolyai University. She is a member of the Regional Studies Association and an external member of the Hungarian Academy of Sciences. Her research focuses upon regional disparities, migration and regional development, including spatial analytical methods.