INTRODUCTION
Beef and sheep production systems are important sectors in Scottish agriculture and elsewhere in Europe, contributing c. 0·34 of total Scottish agricultural output. There are c. 15 000 beef and sheep farms representing a majority (0·91) of farms in Scotland (ERSA 2013). Unlike many European countries, Scotland's beef and sheep sectors are primarily focused on the production of meat as opposed to livestock products based on milk and wool. This means that there is a wide variety of types of beef and sheep farming systems that are often determined by available resources, climactic conditions, topography and management system. Over 0.85 of Scotland's agricultural area is classified as less favoured (ERSA 2013) and due to the lack of alternative agricultural uses for much of the land it means that beef and sheep farming play an important role in sustaining local economies and the environment. Some are efficient producers but many rely heavily on Common Agricultural Policy (CAP) support payments to sustain their farming activities.
Earlier reforms in the CAP have seen changes in beef and sheep production systems in Scotland. During 2004–2007, sheep population decreased by 6% in response to the decoupling of farm payments (Thomson et al. Reference Thomson, Holland, Waterhouse and Morgan-Davis2011). Based on previous experiences, some changes on Scottish farms, particularly from regionalization of the payments, are expected once the latest CAP reform package is fully implemented after 2015, meaning any transition period would give farmers a time-frame with which to plan for future changes to their systems. It is envisaged that farm profit, flock size, stocking density, grazing management and animal health and welfare will be affected by the forthcoming changes. For example, it was reported that reduced animal welfare may be an unintended consequence of such policy change in extensive sheep farms as subsidy decoupled from production may, under some circumstances, reduce incentives to maintain outputs associated with aspects of animal welfare (Stott et al. Reference Stott, Vosough Ahmadi, Dwyer, Kupiec, Morgan-Davies, Milne, Ringrose, Goddard, Phillips and Waterhouse2012).
The CAP support is split into two Pillars: Pillar 1 relates to direct support payments while Pillar 2 supports the Rural Development Programme. The latest CAP reform (European Parliament and Council of the European Union 2013) sees two major changes in Pillar 1 payments which are considered to have potentially significant impacts on Scottish farms. The first of these two changes is the greening of farm payments. This has arguably been one of the most debated components of CAP reform since it was announced in October 2011 (EU Commission 2011). Greening means that in the future 0·30 of a farmer's support (the ‘Basic Payment’) through the CAP must be compliant with the three greening measures proposed by the EU Commission: (i) preserving an ecological focus area (EFA); (ii) crop diversity and (iii) maintenance of permanent grassland (EU Commission 2011). The aim of these measures is to bring increased environmental protection issues into the ambit of Pillar 1 payments. Pillar 1 has in the past been associated with production, not environmental goals.
The second major change in CAP reform is a mandatory move from historical payments to a regionalized payment system. This is a progressive step taken in the reform, as it became increasingly difficult to defend farm payments based on production decisions taken more than a decade ago. Scottish farms, which are currently in receipt of historically based ‘Farm Payment’ support, are expected to experience a substantial redistribution in direct support payments when the regionalization process is fully implemented. It has been suggested that the payments would shift from the intensive and efficient farms towards the small and less efficient farms under flattening of the payment (Buchan et al. Reference Buchan, Matthews, Miller and Towers2010). Previous studies predicted a similar redistribution of payments, for instance in Ireland where the benefits were predicted to move from the South (a region with more efficient farms) to the North (a region with small extensive farms) under regionalization of the single farm payments (Shrestha et al. Reference Shrestha, Hennessy and Hynes2007). One would expect similar redistribution of benefits among Scottish farms with small extensive farms benefiting from it but a number of large farms losing out. It is also envisaged that stock numbers on beef and sheep farms as well as mixed farms will be affected by the regionalization of farm payments. Any increase or decrease in stocking rate will have further impacts on livestock management, such as animal health including occurrence of diseases and impacts on bio-security levels, animal welfare, available labour, grazing and nutritional management of livestock and these will have knock on effects for the farms, up-stream and down-stream industries and wider rural communities.
In the current paper, a farm-level model was developed to explore how Scottish beef and sheep farms would respond under the CAP reform proposals. The objective was to explore the financial and structural impacts of CAP reform on these farms. Farm net margin was considered as a financial indicator and stock number (flock size) as a structural indicator reflecting the impacts. The original CAP greening proposal, as tabled by the EU Commission in October 2011 (EU Commission 2011), was used. Among the three greening measures, Scottish beef and sheep farms would be required to fulfil two measures; first to ensure that at least 0·07 of their eligible farm area came under an EFA and second to maintain at least 0·95 of their permanent grassland. It was assumed that these farms would be exempt from crop diversity, as typically, the majority of the farm land would be used for pasture. For regionalization of the farm payments, Scotland still has to decide upon a specific model to adopt, but options being examined include three main choice sets: (a) ‘region’ scale (e.g., parish or farm level), (b) ‘regional’ basis (e.g., based on land type, land capability, etc.) or (c) ‘regional’ budgets (e.g., based on historic payments, new economic criteria or production based criteria) (Matthews et al. Reference Matthews, Buchan, Miller and Towers2013). In the current paper, however, a national average flat rate of £108·04 per hectare of farming land was assumed, based on Buchan et al. (Reference Buchan, Matthews, Miller and Towers2010); this is justified by the calls from some quarters in the CAP reform debate for convergence of Pillar I support rates. This rate is one of the ten different flattening scenarios used in the Buchan et al. (Reference Buchan, Matthews, Miller and Towers2010) report. Although it presents a much more generalized average payment scheme and could be the least likely regionalization option to be adopted in Scotland, it still provides general indications of how reforms will impact farmers.
MATERIALS AND METHODS
Input data
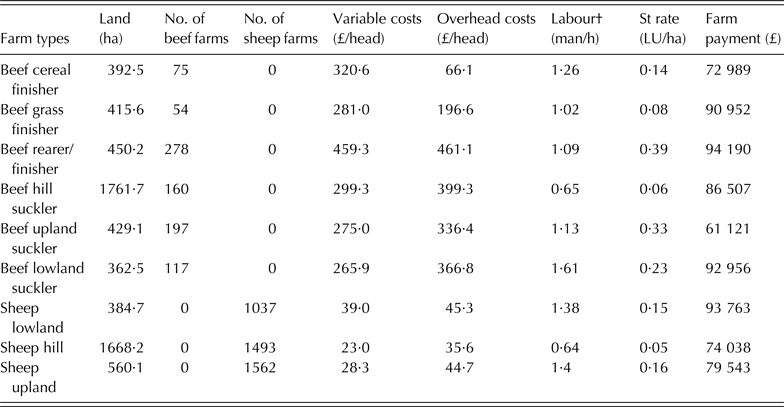
The farm-level data used for the current paper were taken from a database established and maintained by the levy body Quality Meat Scotland (QMS 2012). The dataset consists of a physical description as well as performance and economic data at enterprise level for 69 breeding ewe, 116 beef suckler cattle, 12 lamb finishing and 50 beef finishing enterprises in Scotland. The dataset covers a good geographical and biophysical representation of beef and sheep farm types in Scotland (Thomson et al. Reference Thomson, Holland, Waterhouse and Morgan-Davis2011). A farm-level dataset was established by identifying the associated enterprises to each farm. The farms were grouped into nine different farm types based on the prominent enterprise on the farm. The data were averaged in each of the farm types and used in a farm-level model which is described in the following section. These nine farm types and their characteristics are detailed in Table 1, showing the six categories of beef farms and three categories of sheep farms.
Beef and sheep farm types and their characteristics*

* Source: calculated based on QMS dataset (2012).
† Including family labour only.
Table 1 provides an indication of the variability among different beef and sheep farm types. The Beef Rearer/Finishers are the intensive farms with the largest total production costs (i.e., variable plus overhead costs) per animal and farm payment they receive. The Beef Hill Suckler and Sheep Hill were the largest farm types based on land area but have the smallest farm payment rate per hectare.
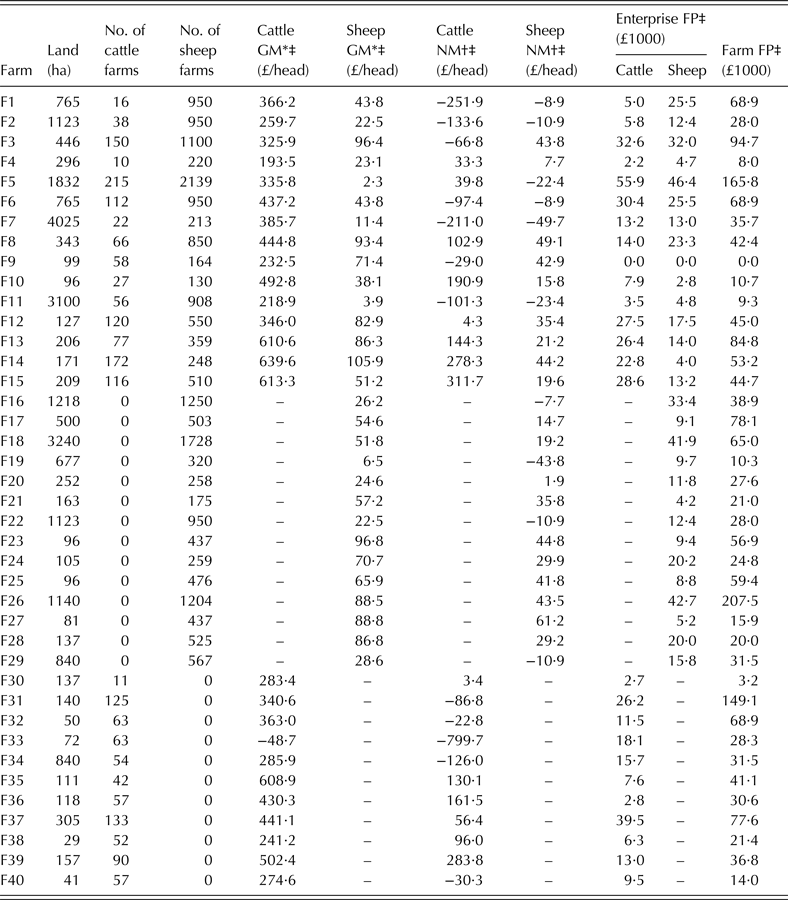
In addition to calculated average figures for the nine identified farm types, farm-specific data including land area, number of cattle and/or sheep, net margins, enterprise and farm-level farm payments related to a sample of 40 farms were used as input to the model to examine the extent of dependency of these farms on farm payments. The selected 40 farms consisted of 14 breeding sheep farms, 11 beef suckler farms and 15 mixed farms (both sheep and beef suckler cattle). These farms belonged to six beef suckler and sheep farm types identified in the dataset (Table 3) excluding three farm types namely: Beef Cereal Finisher, Beef Grass Finisher and Beef Rearer/Finisher. Table 2 provides input figures related to the farms that were used in the model.
Input data for a sample of 40 farms that showed no impact under greening measures (mixed farms F1–F15; sheep farms F16–F29; beef suckler farms F30–F40)
* Cattle and sheep gross margins excluding feed and forage costs. Feed and forage costs were included separately in the model. Calf subsidy (calf scheme) was included to suckler cattle output.
† Cattle and sheep net margins excluding Farm Payments.
‡ ‘–’ denotes no value as there were no sheep or cattle on the related farms.
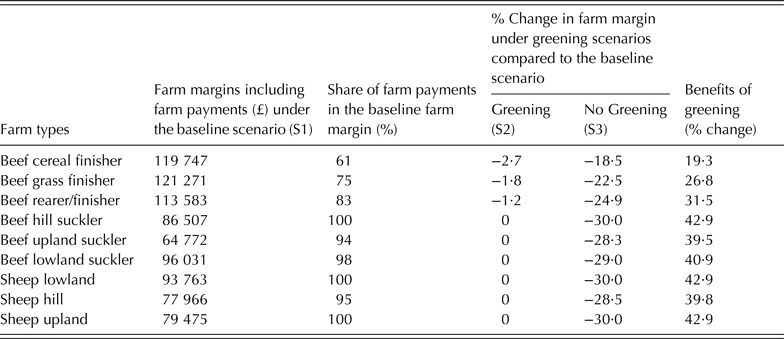
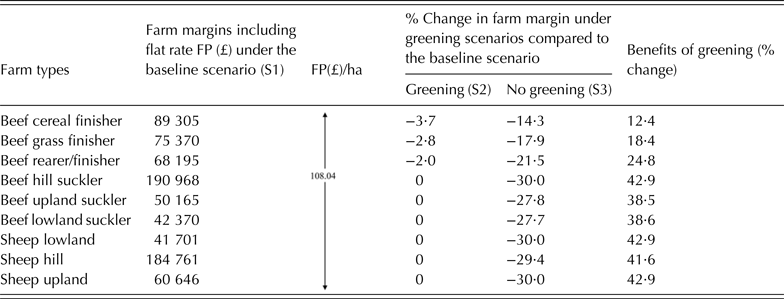
Percentage change on farm margin with greening and no-greening measures under the Historic Farm Payments
Farm-level model
Optimizing farm-level models have been used extensively in policy change impact studies in the EU (Donaldson et al. Reference Donaldson, Flichman and Webster1995; Ramsden et al. Reference Ramsden, Wilson and Gibbons2000; Shalloo et al. Reference Shalloo, Dillon, Rath and Wallace2004; Breen et al. Reference Breen, Hennessy and Thorne2005; Gohin Reference Gohin2006; Bartolini et al. Reference Bartolini, Bazzani, Gallerani, Raggi and Viaggi2007; Hennessy et al. Reference Hennessy, Shrestha, Shalloo and Wallace2009). An optimizing linear programming farm-level model, referred to as ‘ScotFarm’, was developed for the present study. The model has a generic linear programming set up, i.e.:
 $${\rm Max}\; \quad \; z\, = \,(\,p - c)\, \times \,x\, + \,Farm{\rm} Payments$$
 $${\rm Subject \;to}\quad A \,\times \,x \,\le \,R\,\,{\rm and}\,\,x \,\ge \,0$$
where z is farm net margin (NM); x are farm activities; p is a measure of the returns; c are the costs procured for x; Farm Payments is the farm payment per hectare; A is an input–output coefficient for activity x; and R is a limiting farm resource.
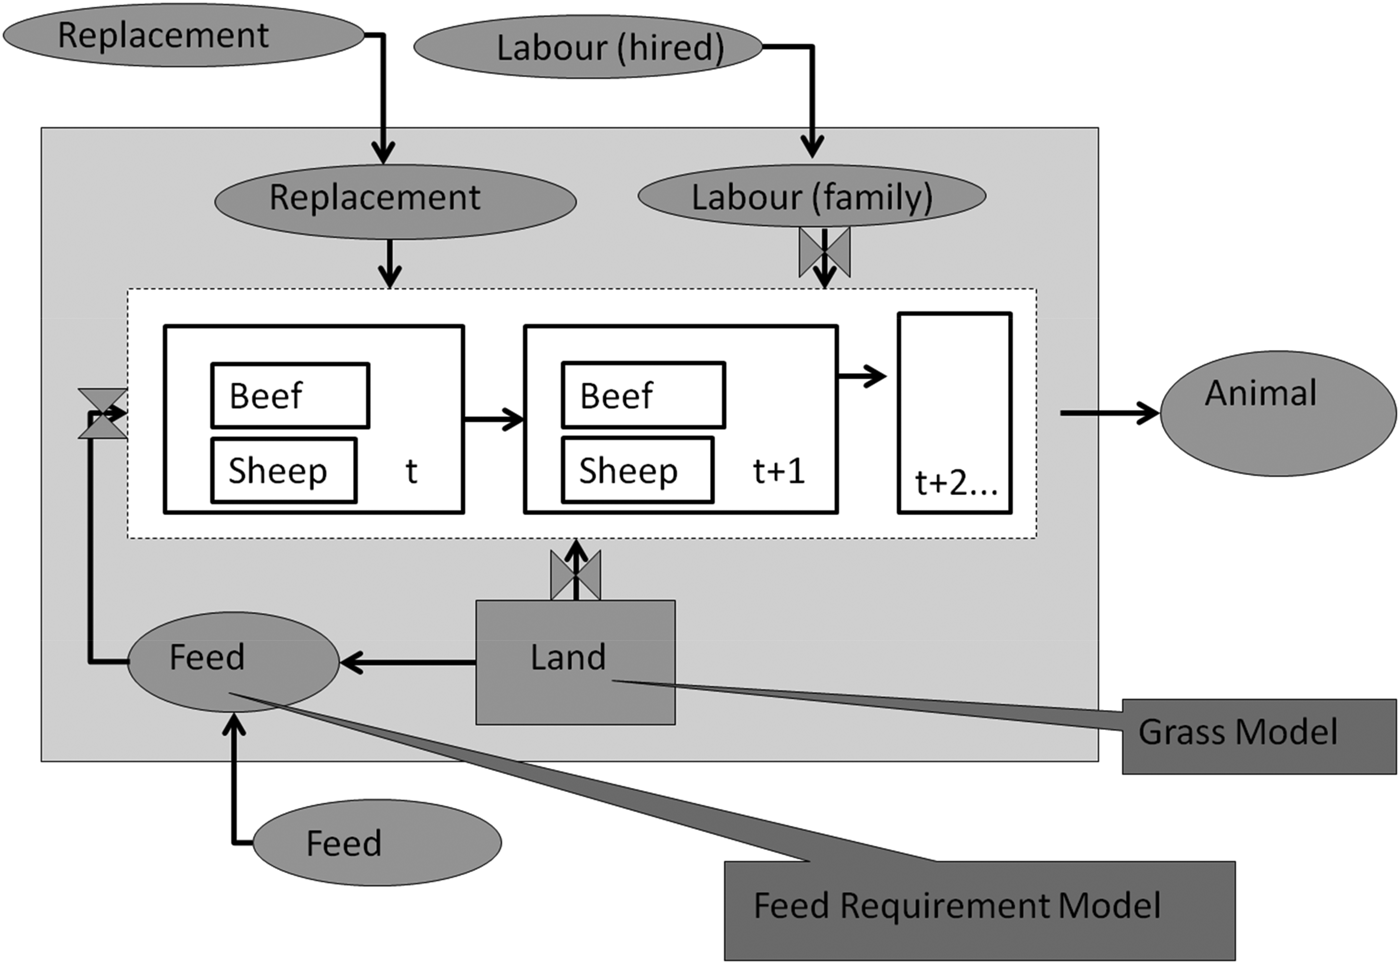
The ScotFarm model draws on and combines features from two earlier models (Shrestha et al. Reference Shrestha, Hennessy and Hynes2007; Stott et al. Reference Stott, Vosough Ahmadi, Dwyer, Kupiec, Morgan-Davies, Milne, Ringrose, Goddard, Phillips and Waterhouse2012). A schematic diagram of the model ScotFarm is provided in Fig. 1, where everything inside the shaded rectangle represents a farm and outside is considered as a market. Beef and sheep production activities are the core of the model. These activities were constrained by land and labour as well as feed and animal replacements available on a farm. However, farms were allowed to buy in feeds, animal replacements and hire casual labour if required. Farm net margins comprised the accumulated revenues collected from the final product of the farm activities less costs incurred for inputs under those activities including the fixed costs plus single farm payment. Fixed costs that include wages, machinery, property, depreciation, land and finance were added as one activity in the model and therefore were not linked to the production activities.
A schematic diagram of optimizing model ScotFarm.
The beef system consists of four categories of animals: calf, suckler, beef under 1 year old and beef under 2 years old. The animals in calf and beef under 1-year-old category can be sold and replaced at the end of year. All beef under 2 years old are sold at the end of the year whereas a maximum 0·25 of the suckler cows are culled and replaced every year. The sheep system consists of two categories of animals: lamb and ewe. A proportion of female lambs are sold and the rest are retained for use as ewe replacers. Cast ewes can be sold and replaced at the end of the year. The animals were replaced by on-farm and off-farm replacement stocks.
A feed requirement model was used to determine monthly feed requirements for each of the animals on a farm based on type, age and production level of the animal. This feed model used animals’ protein and metabolizable energy requirements and dry matter intake by each animal on farm based on Alderman & Cottril (Reference Alderman and Cottril1993). Feeds available to the livestock on farm were fresh grass, silage, hay and concentrate. Feed costs are included in the variable costs for each animal. Grass yield for pasture area of the land in each of the farm types was generated by a dynamic mechanistic crop/grass model ‘COUP’ (Eckersten et al. Reference Eckersten, Jansson and Johnsson1998, Reference Eckersten, Blombäck, Kätterer and Nyman2001; Jansson & Karlberg Reference Jansson and Karlberg2004). This grass growth model simulates plant development and grass yield by accounting for the variation due to changes in location (soil type, local weather conditions, etc.) and key farm-specific decisions, such as fertilizer applications. This model provides a monthly yield for fresh grass assuming it has been grazed daily or put aside for hay or silage (one-cut silage in May) where grass is conserved. The ScotFarm model makes a decision as to how much land would be used for grazing on pasture and hill land, or silage-and hay-based, on optimized number of animals on farm. Grass yield for the hill area of land for each farm was based on the model of Armstrong et al. (Reference Armstrong, Gordon, Grant, Hutchings, Milne and Sibbald1997). Earlier papers provided a more detailed description of the nutritional demand and supply aspect of the model and its application to predict the impact of CAP reform on animal welfare (Stott et al. Reference Stott, Vosough Ahmadi, Milne, Morgan-Davies, Dwyer, Kupiec-Tehan, Ringrose, Phillips and Waterhouse2010, Reference Stott, Vosough Ahmadi, Dwyer, Kupiec, Morgan-Davies, Milne, Ringrose, Goddard, Phillips and Waterhouse2012; Vosough Ahmadi et al. Reference Vosough Ahmadi, Dwyer, Erhard, Morgan-Davies, Waterhouse, Milne, Kupiec-Tehan, Ringrose, Goddard, Phillips and Stott2010). The solution of the model provides a maximized farm net margin, the optimum number of beef suckler cow and/or ewes, a feeding and grazing pattern across different land areas including hill, pasture and forage producing areas along with annual dry matter intake and the monthly casual labour utilized. Since it is envisaged that the greening and regionalization of farm payments will affect both farm economics and optimum stock numbers, the current paper reports particularly on the optimum financial results and stock numbers before and after CAP reform.
The model differs from other farm-level models mentioned earlier in this section because it is a pseudo-dynamic model which runs within a 10-year time frame. This enables the model to represent herd dynamics on a farm much better than previous models. In the current work, a farm activity in a particular year was based on the farm activity in the previous year. For example, the number of beef suckler cattle in year ‘t’ for each of the farm types ‘f’ was based on the number of beef suckler cattle and heifers in year ‘t−1’ as well as number of replacements and culled animals in year ‘t’ as shown in Eqn (1);
 $${\rm dairy}_{t} = {\rm dairy}_{t - 1} + {\rm heifer}_{t - 1} + {\rm replacement} - {\rm cull}_{t} \,\forall \,f $$
From the results of the 10-year run, the first 3 years and last 3 years were discarded to minimize the starting and terminal effects of linear programming (Ahmad Reference Ahmad1997; Shrestha Reference Shrestha2004). Accordingly, the model outputs from the middle 4 years were averaged to provide the final results for both the baseline scenario and the climate change scenario runs. The model used farm-level data for the nine representative farms as stated in Table 1. The data which were not available in the farm dataset, such as livestock units and labour requirements, were taken from the Farm Management Handbook (SAC 2012).
In the current paper, the farm payment was considered to be an area-based payment; hence the payments are included in the farm margin linked with the pasture land on farm. The proposed greening measures were used in the model such that all farms maintained permanent grassland to at least 0·95 of the initial permanent grassland area and also the eligible farm land was reduced to 0·93 to allocate an EFA on each farm. The rate of farm payment per hectare of land was changed in such a way that total farm payment stayed the same as the current figure under these greening measures. For the flattening of the farm payment scenario, the current paper used a flat rate of £108·04 per ha of farmed land, as determined by Buchan et al. (Reference Buchan, Matthews, Miller and Towers2010).
Model runs and scenarios
In the first step, the model was run under three scenarios: Baseline scenario (using full farm payments, S1), Greening scenario (with three greening measures, S2) and No Greening scenarios (no greening measures and 30% reduction in farm payments, S3) under historical farm payments. These three scenarios were repeated under the regionalization of payment condition by replacing historical farm payments with the flat rate of farm payment. Averaged input values for the nine identified farm types (Table 1) were used for these model runs. The objective of these model runs was to estimate the percentage change on farm margin with greening and no-greening measures under farm payments and regionalized flat rate farm payment.
In the second step, additional model runs were conducted at farm level for those farms which showed no impact of greening on their farm margins to determine the extent of dependency of these farms on farm payments (excluding Scottish Beef Calf Scheme subsidy that was already included in the output of suckler cattle). These model runs were categorized under three further scenarios: without Farm Payments scenario (S4), with Historic Farm Payments scenario (S5) and with regionalized Flat Rate Payments scenario (S6). For these scenarios farm-specific data of 40 individual farms (Table 2) were used in the model runs. The hypothetical scenario of ‘without Farm Payment’ (S4) was considered as it was assumed that the results from such a scenario would be able to demonstrate both economic and technical viability of the farms studied and provide an understanding of farm responses when there was no financial support to the farms. The assumption behind scenarios S5 and S6 was that the farm payments were still perceived as coupled by beef and sheep farmers and therefore could affect farm net margin and the optimal decision about the farm size and stock numbers. Therefore, scenarios S5 and S6 compare the impact of the current and future CAP reforms under a coupled assumption.
RESULTS
The results for scenarios S1, S2 and S3 under historical farm payment are presented in Table 3. The second and third columns in the table show farm margins in the Baseline scenario (S1) and share of farm payments in that margin. The fourth column provides percentage changes of farm margin under the ‘Greening’ scenario (S2) and ‘No Greening’ scenario (S3) compared to the Baseline scenario. The last column shows the benefit of complying with greening against non-compliance. This is the percentage difference of farm net margins under ‘Greening’ scenario compared to the ‘No Greening’ scenario.
There was a small but negative impact of greening of the CAP support payments on the farm net margins of both of the Beef Finisher as well as the Beef Rearer/Finisher farm types. However, none of the beef suckler and sheep farm types indicated any impact of greening on farm net margins. The three beef finisher farm types which showed a negative impact of greening (i.e., Beef Cereal Finisher, Beef Grass Finisher and Beef Rearer/Finisher) were the farms which had a lower share of margins coming from farm payments (0·61, 0·75 and 0·83, respectively) compared to the farm groups showing no impact of greening on farm margins. Although these farms had a small reduction in farm margins while implementing greening measures, they had a benefit of c. 20–30% in farm margins when they failed to comply with greening measures.
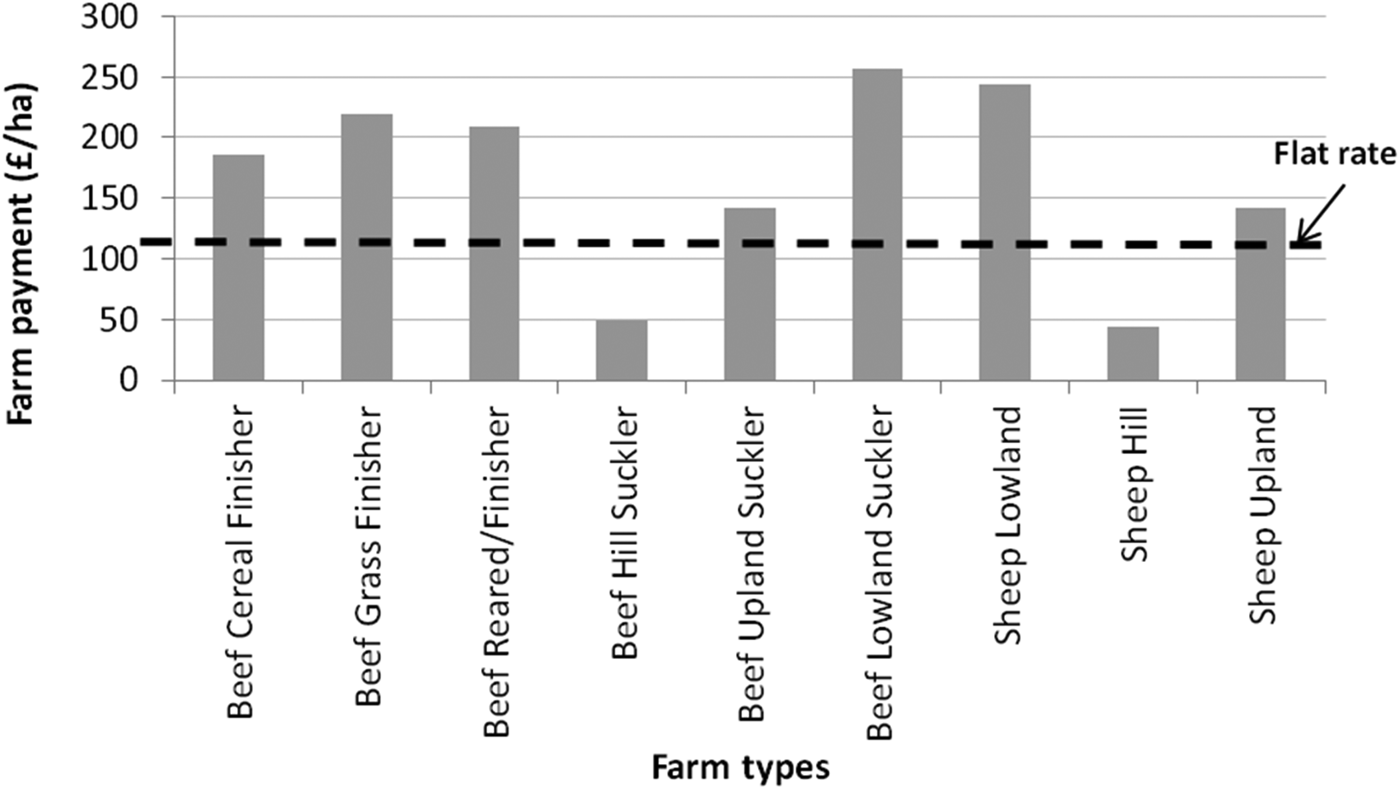
Under the flat rate regionalized payment, farm margins were decreased in the baseline scenario for most of the farm types (Table 4) compared to the baseline farm margins under historical payment, as shown in Table 3. This is obvious as the rate of farm payments per hectare of land was decreased in most of the farm types under the flat rate payment at £108·4 per hectare (Fig. 2). Only Beef Hill Suckler and Sheep Hill farm types would have an increased rate of payments under the flat rate payment. Under the flat rate payment, three farm types (i.e., Beef Cereal Finisher, Beef Grass Finisher and Beef Rearer/Finisher) showed a decrease in farm margins under the greening scenario (Table 4). These are the same farm types which showed a negative impact of greening under the historic farm payment (Table 3).
Historic Farm Payments per hectare of farmed land in each farm types.
Percentage change on farm margin with greening and no-greening measures under Flat Rate Payments
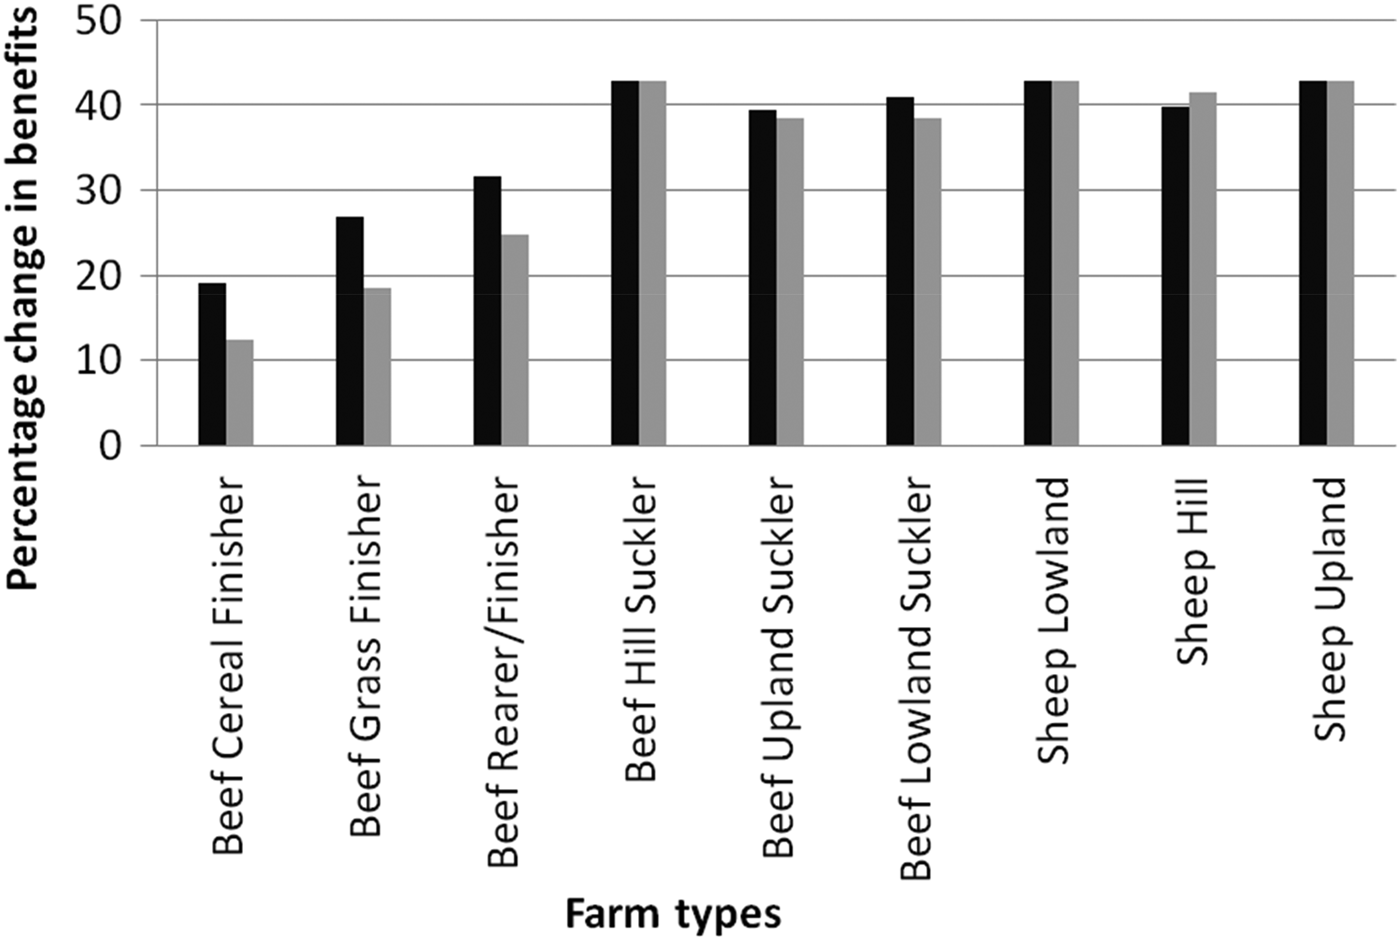
Although all farm types would benefit from adopting greening measures compared to not adopting them, the benefits of adopting greening measures were reduced under the flattening scenario (Fig. 3). Only the farm types with lower farm payments than flat rate payment had better benefits from adopting greening measures under the regionalization scenario (e.g., sheep hill farms).
Benefits of adopting greening measures (S2 scenario) compared to not adopting greening measures (S3 scenario) under Historic Farm Payment (dark bars) and Flat Rate Payment (light bars) for the nine studied farm types.
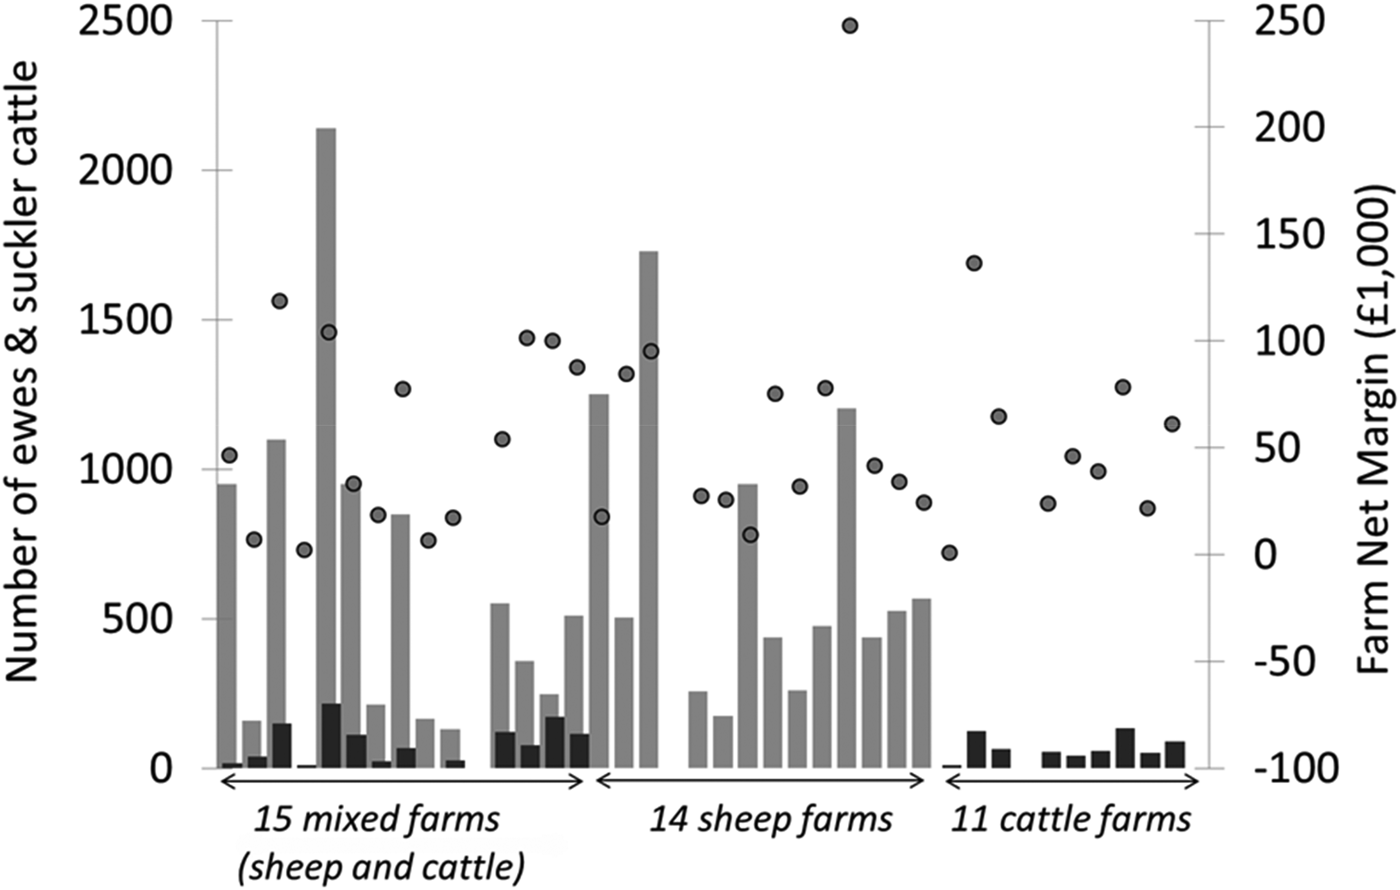
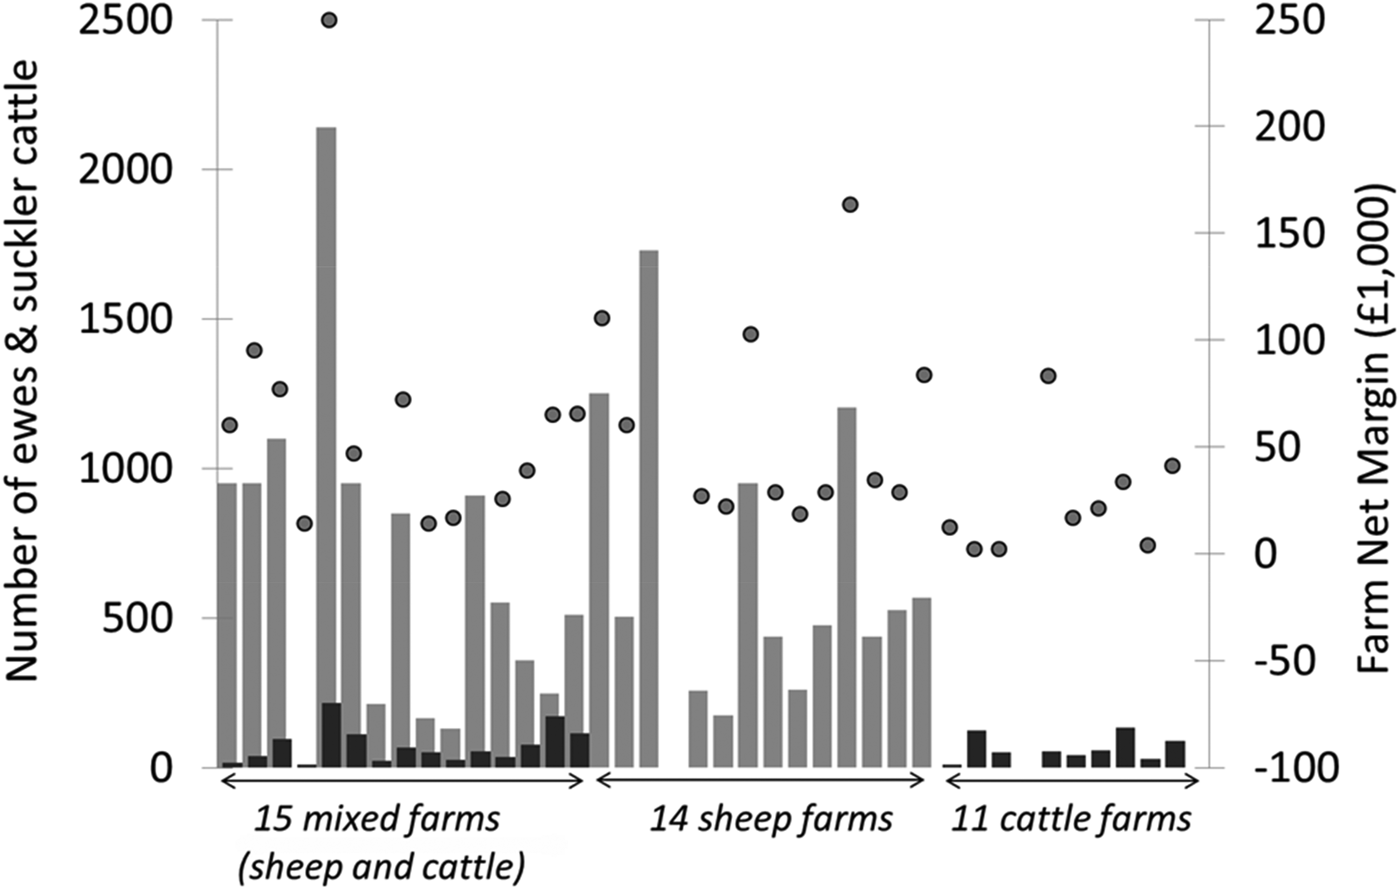
For model runs using farm-specific data and under the hypothetical scenario of ‘without Farm Payment’ (S4), the optimum stock numbers in mixed farms and in beef suckler farms were substantially changed, though this was less significant on sheep farms. The results showed that in most of the mixed and beef suckler cattle farms, the farm's response was to lower the optimum stock numbers (Fig. 4) compared to actual figures on farm (Table 2). Under scenario S5, stock numbers in 0·67 of the mixed farms and 0·93 of the sheep farms increased to actual figures observed in the dataset (Table 2) and improvements in profit were observed. Some of the beef suckler farms also returned a profit under this scenario (Fig. 5). Stock numbers in 0·82 of the beef suckler farms were also increased to actual figures. Under scenario S6, an increase in stock numbers to actual figures was observed in a greater proportion of mixed farms (0·87) than under scenario S5 (0·67). However, under scenario S6, an increase in stock numbers to actual figures was predicted in a smaller proportion of beef suckler farms (0·64) compared to the proportion observed under scenario S5 (0·82). In the remaining 0·36 of the beef suckler farms, the stocking numbers were, on average, 66% lower than actual figures. Almost no change in stock numbers of sheep farms was predicted under the flat rate scenario (Fig. 6).
‘Without Farm Payments’ (scenario S4): optimized stock numbers (sheep light bars and cattle dark bars), and farm net margin (NM) (circles) of 40 farms estimated by the model using net margin per head reported in the dataset as input. Farms included in Figs 4, 5 and 6 belong to the farm types mentioned in Tables 3 and 4 excluding three farm types namely: Beef Cereal Finisher, Beef Grass Finisher and Beef Rearer/Finisher.
‘With Historic Farm Payments’ (scenario S5): optimized stock numbers (sheep light bars and cattle dark bars), and farm net margin plus Historical Farm Payments (circles) of 40 farms estimated by the model.
‘With regionalized Flat Rate Payments’ (scenario S6): optimized stock numbers (sheep light bars and cattle dark bars), and farm net margin plus flat rate Farm Payments (circles) of 40 farms estimated by the model.
DISCUSSION
The impact of greening of CAP payments was very small in most of the beef and sheep farms in Scotland. This was expected, as the target of the greening measures are largely lowland arable farms. This agrees with other studies that have argued that there will be very little impact of greening on EU agricultural production with little to no impact on livestock production (Mathews Reference Mathews2012; Allen & Hart Reference Allen and Hart2013; Hart & Menadue Reference Hart and Menadue2013). The PBL Netherlands Environmental Assessment Agency (Westhoek et al. Reference Westhoek, van Zeijts, Witmer, van den Berg, Overmars, van der Esch and van der Bilt2012) pointed out that the impact of crop diversification and permanent grassland measures will be negligible, as most farms already meet these criteria. They argue that the most effective measure would be the EFA criteria, where changes will be seen in the levels of production and GHG emissions in the EU.
The model results suggest that the greening measures affect only those farm types which have a lower share of subsidy payment on their farm margins (i.e., Beef Rearer and Finisher) compared to the rest of the farm types. The production level in these farm types is affected by a 7% reduction of eligible farm area that is allocated to EFAs. However, for the rest of the farm types (Beef Suckler and Sheep farm types), a change in farm subsidy payments is more critical than greening of payments. The farm subsidy payments in these farms contribute 0·90–1·00 of their farm margins. This indicates that the more dependent a farm is on farm payments, the less impact is seen when the greening measures are implemented. Nevertheless, when greening measures were ignored and the 0·30 greening payment was foregone, as seen under the ‘No Greening’ scenario (S3), all farms had a substantial reduction in farm margins. This shows that for Scottish beef and sheep farms, a change in farm payment is more important than changes that reduce farm production. The benefits of adopting greening measures against not adopting and forgoing the payment was substantially higher in most of the farms.
Within the farm types that are not affected by greening measures, the results of scenario S4 showed that 0·67 of the mixed farms would keep no cattle and 0·53 would keep no sheep on-farm. Under this hypothetical scenario, for sheep farms, keeping sheep on-farm was not part of the optimal solutions for 0·28 of these farms. For the beef suckler farms, 0·55 of those farms modelled would destock the entire herd from the farms, highlighting the uneconomic nature of un-supported beef production in Scotland. In general the mixed farms fared better, under a no farm payments scenario than the sheep and beef suckler farms. This indicates the resilience of the mixed farms in relation to changes in support payment. It should be noted that, under the current CAP policy, these farms do not forego the farm payments for not keeping animals on farms, as farm payments are paid regardless of animal numbers on a farm. However, it is likely that the introduction of the minimum activity criteria, referred to as the ‘Scottish Clause’ (RACCE 2014), may change this from 2015 onwards. Farms not meeting these criteria, based on stocking density, would be disqualified from payment.
Results showed that in general a change in CAP support payments from the ‘with Historic Farm Payments’ scenario (S5) to the ‘with regionalized Flat Rate Payments’ scenario (S6), will increase the proportion of mixed farms who will increase their stock numbers. This proportion decreased for the beef suckler farms, whereas no impact on stock numbers in sheep farms was predicted. The stock numbers in beef suckler farms that would decrease the herd size was, on average, 66% lower than the actual stock numbers. These predicted fluctuations of stock numbers in different farm types as a result of change in CAP support may have unintended positive or negative consequences for the farm environment as well as for animal health and welfare. A key issue for change in support rate is by how much and in what ways the potential negative consequences of increased stock numbers could be minimized.
The net margins of 0·63 of the farms, particularly beef suckler farms, were lower under the flattening scenario compared to the historical basic payment scenario. Around 0·53 of the mixed farms, 0·18 of the beef suckler farms and 0·29 of the sheep farms were financially better off under this scenario. These results support the assumption that farmers may still consider decoupled CAP support as a coupled payment. However, farmers may have other incentives for maintaining their current production level, such as making an annual contribution to fixed costs that are perceived to be unavoidable. Moreover, it may be that minimum activity criteria will be required to qualify for the farm payments (NFU Scotland 2014). Ultimately, CAP support makes beef and sheep livestock enterprises viable when they might otherwise become uneconomic and, in that sense, CAP support can be seen as coupled. A number of earlier studies analysing the 2003 Mid-Term Review of the CAP reported that many farmers still considered single farm payments coupled to production (Breen et al. Reference Breen, Hennessy and Thorne2005; Gohin Reference Gohin2006; Gorton et al. Reference Gorton, Douarin, Davidova and Latruffe2008; Renwick et al. Reference Renwick, Jansson, Thomson, Revoredo-Giha, Barnes, Schwarz and Moreddu2011). It should be noted that the fixed costs used in the model were not changed and therefore the presented results demonstrate the short-run effects of the examined scenarios. Further work could therefore look at the effect of flat rate payments in a longer run situation by allowing fixed costs to change.
Under a flat rate farm payment, two hill farm types (Beef Suckler and Sheep) receive a major improvement to their support payment from the regionalization scenario, doubling the farm gross margin as a result. Farm gross margins were still reduced for most of the farm types under regionalization of payments. The impact was slightly higher than the impact under the farm payment condition for the Finisher and Rearer/Finisher farm types. As with the previous case, the remainder of the farm types observed no impact of greening on their farm margins. Under a ‘No greening’ scenario all these farms showed a similar reduction of margins, principally due to foregoing 0·30 of their farm payments.
CONCLUSIONS
The results suggest that for Scottish beef and sheep farms, changing from the historic farm payment system is more critical than opting for the greening measures. For many farm types, moving to a flat rate of £108·04/ha reduced farm margins substantially. For lowland sheep farms this decrease was almost 45%. Only a few beef suckler farms and sheep farms on hills in our sample (0·18 and 0·29, respectively) improved their net margins under the flat rate regionalization scenario. Majority of these sheep farms were extensive with an average area of 1600 ha and had a large flock size of, on average, 1120 ewes. Clearly, as compulsory requirement for payment, all the farm types benefit from implementing greening measures, rather than not adopting and foregoing 0·30 of their farm payments. Results also show that in general, the mixed farms (keeping both sheep and cattle) perform better under a ‘No farm payments’ scenario than the specialized farm types. Most of the farms showed an increase in stock numbers and returns on profit when subsidies were added to their margins. Under a flat rate scenario, stock numbers and farm margins increased in 0·53 of the studied mixed cattle and sheep farms. However, for the rest of the farms almost no change in stock numbers was found under a flat rate scenario, compared to the historical farm payment scenario.
The authors thank the Scottish Government for funding this research. We are also grateful to the Quality Meat Scotland (QMS) for providing data. This research was undertaken within the Scottish Government Rural Affairs and the Environment Portfolio Strategic Research Programme 2011–2016, Theme 4: Economic Adaptation.