A place where every interest and shade of opinion in the country can have its cause even passionately pleaded, in the face of the government and of all other interests and opinions (…), is in itself, if it answered no other purpose, one of the most important political institutions that can exist anywhere, and one of the foremost benefits of free government (Mill, Reference Mill1861: 105).
Introduction
Political scientists have long maintained that political equality is paramount to the proper functioning of democracy (Dahl, Reference Dahl1989). Equally old is the concern that political equality is potentially undermined by socio-economic inequality (Winters, Reference Winters2011). A disproportionate influence of wealthier, higher educated citizens in government would be a violation of basic notions of procedural fairness. We seek to address these issues of unequal political representation in one of the most proportional democracies in the world: the Netherlands.
One instance of unequal representation arguably occurred on 1 June 2005, when 62% of Dutch voters rejected the so-called ‘Treaty establishing a Constitution for Europe’ in the first national referendum in over 200 years. They did so despite overwhelming parliamentary support in favor of the constitutional treaty. In fact, 85% of the Dutch Second Chamber, the country’s lower house of parliament, supported adoption of the treaty.Footnote 1 Much like in other European democracies, the attitudes of Dutch voters toward European integration are heavily stratified by level of education (Bovens and Wille, Reference Bovens and Wille2010; Lubbers and Jaspers, Reference Lubbers and Jaspers2011; Hakhverdian et al., Reference Hakhverdian, Van der Brug and De Vries2012), so in this particular instance the views of the people’s representatives ostensibly aligned with the views of one particular segment of the electorate, namely the higher educated. On 6 April 2016 Dutch voters were yet again called to the ballot box for a national plebiscite, this time regarding the association treaty between the European Union and Ukraine. The results were eerily similar to the 2005 referendum. Once again, about two-thirds of the Dutch voters (61%) rejected the treaty despite large majorities of their elected representatives in both the lower house (79%) and upper house (73%) of Parliament having voted in support of the treaty. But perhaps this lack of political agreement between elected representatives and the citizens they claim to represent was a fluke or a byproduct of the referendum process. Perhaps we would find a closer match between elite and mass political orientations when we consider a broader range of political issues and time periods.
Recent studies in the United States have greatly contributed to our knowledge about unequal representation by comparing the preferences of low- and high-income groups to roll-call voting in Congress (Bartels, Reference Bartels2008; Ellis, Reference Ellis2012; Hayes, Reference Hayes2012) and policy outcomes (Flavin, Reference Flavin2012; Gilens, Reference Gilens2012; Gilens and Page, Reference Gilens and Page2014). These authors conclude that political influence in the United States is sharply stratified along income lines (cf. Ura and Ellis, Reference Ura and Ellis2008). In the Netherlands, and in much of Western Europe, the issue of unequal representation of income groups is more underexplored. To the extent that the effect of socio-economic inequality on representation has been studied here (e.g. Bovens and Wille, Reference Bovens and Wille2010, Reference Bovens and Wille2017), it has largely focused on education but not on income as the determinant of inequality. However, we believe there is merit in including both income and education when studying unequal representation, as they both shed light on distinct sources of bias (e.g. Ellis and Ura, Reference Ellis and Ura2011). Political competition in Western Europe is structured along two dimensions, one economic and one cultural (Pellikaan et al., Reference Pellikaan, De Lange and Van der Meer2007; Van der Brug and Van Spanje, Reference Van der Brug and Van Spanje2009), each anchored by different social indicators. The economic dimension encompasses issues such as redistribution and taxation which are best predicted by income and social class. The cultural dimension includes multiculturalism and European integration, among other issues, and is anchored by level of education (Van de Werfhorst and De Graaf, Reference Van de Werfhorst and De Graaf2004). We would expect income and education groups to occupy different positions on these respective dimensions, an important requirement for unequal representation to arise in the first place (Soroka and Wlezien, Reference Soroka and Wlezien2008), and both factors to illuminate different domains in which political inequality could manifest itself.
What makes this case relevant beyond the specific Dutch context is that influential scholars have argued that proportional representation enhances ideological congruence between elites and masses (Lijphart, Reference Lijphart1999; Iversen and Soskice, Reference Iversen and Soskice2006; Powell, Reference Powell2009). That is to say, the more proportional the electoral system of a country, the more its governments and voters overlap on the left-right axis. The same applies to congruence between the legislature and the electorate. Elections based on proportional representation are also more likely to yield legislatures that bear closer ideological resemblance to that country’s citizens (Golder and Stramski, Reference Golder and Stramski2010). The Dutch electoral system, which counts as among the most proportional democracies in the world, ought to prevent, or at the very least minimize, representational distortions of the type reported above. In this sense, the Netherlands provides a least likely context for unequal representation to arise (Flyvbjerg, Reference Flyvbjerg2006).
We analyze the political representation of socio-economic groups in the Netherlands by focusing our efforts on ideological congruence between citizens and members of parliament. Our analyses reveal stark differences in the political representation of income and education groups. The views of parliamentarians are far more similar to those of rich and/or high-educated citizens than to those with less income and/or education. Both income and education contribute to unequal representation overall. On economic issues, the two factors are equally important, while education trumps the effect of income on cultural issues. These gaps remain intact when controlling for other relevant characteristics. Furthermore, we show that the use of left-right self-placement items leads to vastly different conclusions on both overall levels of political representation as well as on the existence of unequal representation, highlighting the limits of employing broad ideological labels and self-identification in this particular research context. Finally, an analysis of developments over time reveals that inequalities in congruence have grown in recent years. These results show that even in a country with one of the most proportional electoral systems in the world, the views which are represented in parliament contain major distortions of views of the wider electorate.
Descriptive (mis)representation
How does the unequal distribution of resources flowing from education and income affect the composition of a lawmaking body? We focus on the possibility that the views of rich and high-educated citizens are similar to those of representatives because the latter are overwhelmingly drawn from the ranks of the former. These socio-economic characteristics in turn affect representatives’ views and behaviors.
Descriptive representation refers to the idea that ‘the legislature be so selected that its composition corresponds accurately to that of the whole nation’ (Pitkin, Reference Pitkin1967: 60). The literature on descriptive representation has largely focused on the numerical underrepresentation of women and ethnic minorities (Mansbridge, Reference Mansbridge1999; Broockman, Reference Broockman2013). There is overwhelming empirical evidence to suggest that the absence of women and ethnic minorities in legislatures and other political arenas biases policy outcomes in favor of men and whites. A series of studies on female leadership in India has found that female leaders at the local level invest more in public goods that are congruent with the priorities of women (Chattopadhyay and Duflo, Reference Chattopadhyay and Duflo2004), while also raising perceptions of representational quality (Beaman et al., Reference Beaman, Chattopadhyay, Duflo, Pande and Topalova2009). These findings are particularly compelling as the Indian context provides a natural experiment, which greatly improves causal inferences on the effects of descriptive representation. However, many non-experimental studies in wildly diverging settings have found comparable results on the desirable consequences of the political presence of women (e.g. Karvonen and Selle, Reference Karvonen and Selle1995; Bratton and Ray, Reference Bratton and Ray2002). Studies on ethnicity have also shown that ethnic groups fare better when fellow group members hold legislative and executive office (e.g. Whitby, Reference Whitby1997; Banducci et al., Reference Banducci, Donovan and Karp2004; Tate, Reference Tate2004).
Still, the question remains whether the same logic that underlies descriptive representation based on gender and ethnicity generalizes to other shared characteristics, such as social class, education, age, and so on. Based on their reading of early scholarship on the topic, Carnes and Lupu write that ‘the idea that the class makeup of the world’s political institutions does not matter became the conventional wisdom in comparative politics’ (Reference Carnes and Lupu2014: 2). Gilens’ (Reference Gilens2012) work on unequal representation in the United States is a recent reiteration of that conventional wisdom. While Gilens shows that affluent Americans exert much more influence on policy outcomes than middle and lower income Americans, he dismisses the composition of the legislature as a possible driver of that disparity and instead identifies the propensity of high-income Americans to donate to political campaigns as the likely culprit (Gilens, Reference Gilens2015).
Yet others do find evidence that the social background of representatives matters a great deal for their attitudes and behavior. Carnes and Lupu (Reference Carnes and Lupu2014) show that legislators in Latin American countries hold economic attitudes that are consistent with their social class background. Lawmakers from working class backgrounds were significantly more leftist than lawmakers from white-collar professions. These distinct perspectives on, for instance, the level of social spending also translate into legislative conduct in terms of bill sponsorship (but not roll-call votes). In a similar vein, working class representatives in the United States think and act differently on economic issues, even when controlling for a host of other factors (Carnes, Reference Carnes2013; see also Butler, Reference Butler2014). Comparable findings emerge in the local level in the Netherlands where higher educated local representatives were found to be more pro-EU and pro-immigration than their lower educated colleagues, mirroring findings on the relationship between education and attitudes at the mass level (Hakhverdian et al., Reference Hakhverdian, Van Ditmars, De Lange and Schakel2018).
The vast majority of parliamentarians in the Netherlands have high-socio-economic status. Their educational backgrounds, in particular, have received a lot of attention in recent years. As Bovens and Wille (Reference Bovens and Wille2010, Reference Bovens and Wille2017) note, about 90% of all members of parliament belong to the group with the highest level of educational attainment, with the overwhelming majority having completed university training. Moreover, this share has increased since the 1970s, while other distortions in descriptive representation, including those based on gender and ethnicity, have shrunk (though they have certainly not disappeared) (Van den Berg and Van den Braak, Reference Van den Berg and Van den Braak2004: 71–72). Very few members of parliament hold blue-collar positions before and after being a representative, and few of them come from a poor or working class family, though the importance of social milieu seems to be declining (Bovens and Wille, Reference Bovens and Wille2017). In short, then, a large part of Dutch parliamentarians are currently drawn from the higher social-economic strata, a conclusion that generalizes to other European countries (Best, Reference Best2007).
The most obvious explanation for the overrepresentation of higher socio-economic groups among elected officeholders is that both income and education are important predictors of political engagement and participation (Lijphart, Reference Lijphart1997; Bovens and Wille, Reference Bovens and Wille2010; Schlozman et al., Reference Schlozman, Verba and Brady2012). As Arend Lijphart has noted, ‘this systematic class bias applies with special force to the more intensive and time-consuming forms of participation’ (Reference Lijphart1997: 1), and holding office is perhaps the most intensive form of political engagement of all. In order to become a candidate, a citizen seeking to run for elected office must first become a member of a political party and research has shown that party membership in the Netherlands is anchored, among other factors, by educational attainment (Bovens and Wille, Reference Bovens and Wille2010; Hakhverdian et al., Reference Hakhverdian, Van der Brug and De Vries2012). Other potential explanations include the fact that wealthy and higher educated people are more likely to be a part of social networks that are important for political recruitment, through venues of higher education, work, leisure and voluntary associations, and that they more often possess the skills and confidence to succeed as a candidate (Bovens and Wille, Reference Bovens and Wille2010, Reference Bovens and Wille2017). Many of these skills relate to verbal and written communication. In his research on descriptive misrepresentation in the United States, Carnes emphasizes the importance of structural factors, like ‘the practical burdens associated with holding office and the gatekeeping decisions of party leaders and interest groups’ (Reference Carnes2013: 12). It is important to note, however, that one of the most prominent of these factors in the US context, the fact that political campaigns are so expensive that candidates with great personal wealth are at an advantage, does not translate to many non-US settings where money in politics is regulated more strictly and political parties and candidates rely on public funds to finance their campaigns.
In sum, and even though we cannot directly test whether or not education and income matter for elite opinion due to the simple constraint that almost every representative in Dutch parliament is higher educated, we expect the political views of representatives to align with the views of higher educated, richer citizens as these groups share relevant descriptive characteristics with one another.
Data and methods
The lion’s share of the analyses is based on two data sources: the Dutch Parliamentary Election Studies (DPES) and the Dutch Parliament Study (DPS), both conducted in 2006. The DPES is a survey that is conducted at every parliamentary election among a representative sample of Dutch citizens, focusing on a host of political issues. The DPS asks many of the questions from the DPES to members of the Dutch Lower House of Parliament. 114 members of parliament, 76% of a total of 150, completed the survey in 2006. An examination of this sample, presented in Online Appendix A, shows that it is broadly representative of parliament as a whole. Moreover, the DPS was conducted under strict guarantees of anonymity and is not publicly available. As a result, the survey captures as best as possible the electorally uncontaminated preferences of representatives, since these representatives were able to speak freely and answer without fear of retribution by either voters or colleagues. The data from 2006 will receive the most attention, simply because they are the most comprehensive in terms of issue coverage and temporal fit with the mass survey. However, the DPS was also administered to members of parliament in 2001 and 1990, which can be paired with data from the DPES of 1998 and 1989, respectively. Using these sources, we will also shed some light on developments over time in unequal representation.
Congruence
Our empirical analyses of unequal representation consist of calculating congruence scores which capture the similarity of preferences between elites and masses.Footnote 2 Congruence itself can be operationalized in various ways. Until quite recently, most studies measured congruence by reducing the stance of representatives and citizens to a single point on a left-right scale and calculating the distance between them (Huber and Powell, Reference Huber and Powell1994; Budge and McDonald, Reference Budge and McDonald2007). Despite its strengths in terms of coverage in time and space, this approach has some major shortcomings. First and foremost, it ignores the distribution of both representatives’ and citizens’ views on the scale. As a result, this measurement cannot distinguish a centrist electorate from a highly polarized one, assuming that both extremes of the distribution are roughly equal in size. In both cases, one would conclude that a centrist government produces a high level of congruence, even though in the latter case, it would be far removed from most citizens.
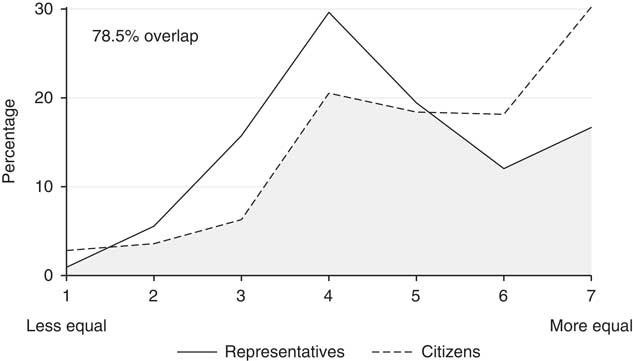
This problem was remedied by the introduction of various other measures of ideological congruence by Golder and Stramski (Reference Golder and Stramski2010). Instead of utilizing a measure of central tendency such as the mean or the median, their so-called ‘many-to-many’ congruence measure uses a distribution of preferences for both citizens and representatives on any given scale. In concrete terms, congruence is calculated by overlaying the distributions of citizens and representatives. As Andeweg explains: ‘we compare the percentage of voters positioning themselves at that point [in the distribution] with the percentage of MPs positioning themselves at that same point, and we take the lower of these two percentages. If we sum the resulting (…) percentages, we have a measure for the overlap between the two distributions’ (Reference Andeweg2011: 43). The resulting measure ranges from 0 and 100%. The higher the percentage, the larger the overlap. The larger the overlap, the better the views of the electorate are mirrored in parliament.Footnote 3
An example of this procedure is provided in Figure 1, which presents many-to-many congruence for the entire electorate on the issue of income inequality (see Online Appendix B for the survey question). On the far left hand side of the figure, which indicates a preference for larger income differences, the line for members of parliament lies slightly below the line for citizens, so we use the percentage of parliamentarians who place themselves here (0.9%). Moving one step to the right, the line for citizens is lower, so their relative frequency (3.6%) is added to the first number. If we continue this procedure for the rest of the distribution, we arrive at an overlap of 78.5%.
Many-to-many congruence on the issue of income inequality.

Below, we calculate many-to-many congruence for each subgroup (in terms of education and income terciles) on each available political issue and then compare the outcomes. In order to test whether differences in congruence scores between subgroups are statistically significant, a bootstrapping procedure will be used to estimate a confidence interval around each score. Online Appendix C provides more information on this procedure.
Variables
In 2006 the elite survey contained five items from the mass survey on specific political issues. These focus on income inequality, European integration, multiculturalism, crime and euthanasia, all measured on a seven-point scale (see Online Appendix B for the survey questions). The first of these clearly belongs to the economic dimension of the Dutch policy space, while the others belong to the cultural dimension. It might be argued that euthanasia is not a part of either dimension and is no longer a relevant issue in the Netherlands (Pellikaan et al., Reference Pellikaan, De Lange and Van der Meer2007), but if so, this will become clear in the analyses. Left-right self-placement was measured on an 11-point scale, which was then converted to seven points.
Net household income is measured using 20 categories.Footnote 4 These categories are collapsed into three groups, which contain roughly the same number of respondents: low (<€25.155), middle (€25.155–€39.540), and high incomes (>€39.540). For 1989 and 1998, the threshold for income categories was chosen so as to create three groups of roughly equal size in those years as well. Education contains five categories: elementary (lower), vocational, secondary, middle-level vocational or higher level secondary, and higher level vocational or university. The first two of these are grouped together as low education, the next two form the middle category and the final level counts as high education. Unlike for income, the education categories were kept the same for 1989 and 1998. As a result, there are few respondents who are higher educated in 1989 (<5% of the sample).
Since there is no regression model, it is not possible to include control variables in the conventional way. However, several factors might explain potential gaps in congruence between income and education groups, and therefore need to be controlled for. Perhaps the most obvious are political participation, political knowledge, age, ethnicity, and gender (Ellis, Reference Ellis2012). As Ellis points out when discussing income, ‘much prior discussion (…) implicitly or explicitly point to these sorts of resource- or engagement-based factors as the driving forces behind biases in representation’ (Reference Ellis2012: 940). The same reasoning could apply to education.
To investigate to what extent participation, knowledge, age, ethnicity, and gender can explain the previous findings, we divide all these variables into two or three categories and calculate congruence for all possible combinations of, say, participation and education. We then calculate the gap in congruence between education groups while participation is held constant. Due to this manual way of controlling for external factors, it is not feasible to control for more than two variables at once; this already creates 18–27 separate distributions, some of which contain less than a hundred respondents.
Political participation is measured using items on voting, joining demonstrations, and contacting members of the government, among other things. With these items we construct three categories of participation: low, middle, and high. If respondents reported voting in the parliamentary elections of 2006, the most recent municipal elections and the referendum on a European constitution, they are put into the middle category. If they did not vote in all three elections, this is coded as low participation.Footnote 5 If they did vote in all three and undertook other forms of participation besides voting they are placed into the highest category.
An index of political knowledge is already present in the DPES, based on the recognition of several Dutch politicians, along with their party and function. The variable with five categories is recoded into three categories by grouping together the lowest two and the highest two values. Age is also recoded into three categories. Respondents under the age of 40 are grouped into the first category, respondents between 40 and 60 years of age are placed into the second, and respondents of 60 years or older into the third. These values are fairly arbitrary; they are mainly chosen to create groups with comparable sizes. Next, ethnicity is divided into two categories: Dutch and non-Dutch. It would be interesting to distinguish Western immigrants from non-Western immigrants, but unfortunately these groups are not large enough to do so. Lastly, gender is divided into female and male.
Results
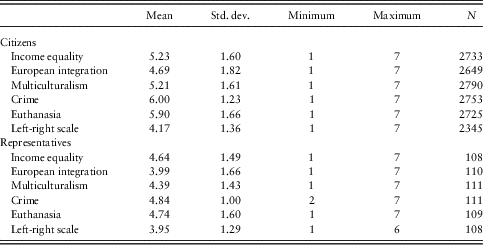
The descriptive statistics for the five policy issues and left-right self-placement for both citizens and members of parliament are displayed in Table 1. The means show that the views of citizens are, on average, clearly distinct from the views of parliamentarians on all issues, with left-right self-placement being the notable exception. With regard to income inequality, the average citizen favors smaller income differences than the average member of parliament. The average citizen also favors less European integration and multiculturalism, tougher action on crime and more freedom regarding euthanasia than the average MP. The underrepresentation of ‘left-nationalist’ voters has been documented by others in both a pan-European (Van der Brug and Van Spanje, Reference Van der Brug and Van Spanje2009) as well as Dutch context (Andeweg, Reference Andeweg2011; Thomassen, Reference Thomassen2012). Below we shall show that this ‘blind corner of political representation’ (Thomassen, Reference Thomassen2012) relates to the unequal representation of lower educated, poorer citizens.
Descriptive statistics for five policy issues and left-right self-placement

Income inequality and multiculturalism
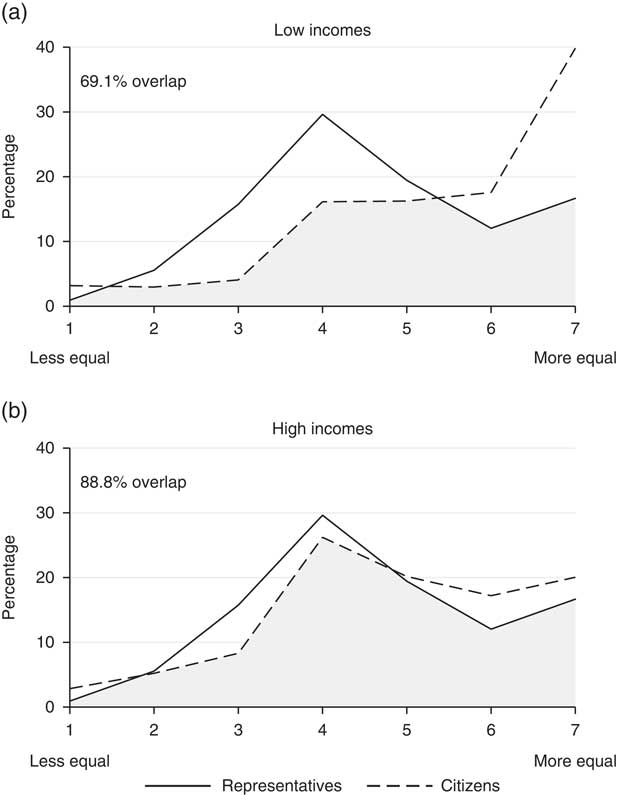
Figure 2a and 2b displays ideological congruence for low- and high-incomes regarding income inequality. These graphs clearly show that the overlap between citizens and MP’s increases with income (69.1 vs. 88.8%). They also show where the distribution of low-income citizens differs from that of parliamentarians. As could be expected, the poorest third of the electorate is tilted toward the right-hand side of the scale, expressing a preference for smaller income differences. On the other hand, most members of parliament are found in the middle of the scale. In other words, low incomes hold much more egalitarian preferences than members of parliament.
Many-to-many congruence on the issue of income inequality for (a) low incomes and (b) high incomes.

What is more surprising about Figure 2 is that even the richest third has slightly more egalitarian views than members of parliament. The mean scores for the item are 5.51 (SE=0.05) for low incomes, 5.29 (SE=0.05) for middle incomes, 4.87 (SE=0.05) for high incomes, and 4.64 (SE=0.14) for parliamentarians. A possible explanation of this pattern would be that parliament represents an even smaller economic elite than the highest third of the income distribution. This is somewhat supported by the available evidence. Overall, the original income variable, which has 20 categories, has a rank correlation of ρ=0.82 (P<0.001) with ideological congruence. That is to say, the highest level of congruence is achieved by the top category (net household income of more than €66.501 in 2006) with a score of 90.2%. The truly wealthy have even higher earnings and possessions so it might very well be possible that congruence would be even higher for them but testing this proposition lies outside the scope of our data.
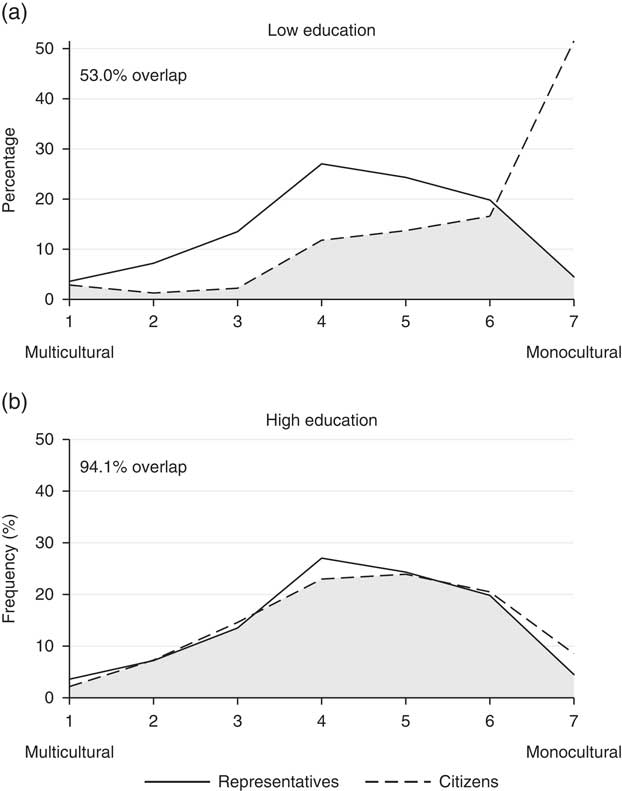
As an example of a cultural issue, Figure 3a and 3b presents many-to-many congruence of low- and high-educated citizens on multiculturalism. Here, the difference between the lower and upper tercile is even larger than in the figures related to income inequality. For lower educated citizens congruence with parliamentarians is mediocre at best (53.0%). The former clearly have more monocultural views than the latter. For higher educated citizens, on the other hand, congruence is almost perfect (94.1%).
Many-to-many congruence on the issue of multiculturalism for (a) lower educated and (b) higher educated.

All issues
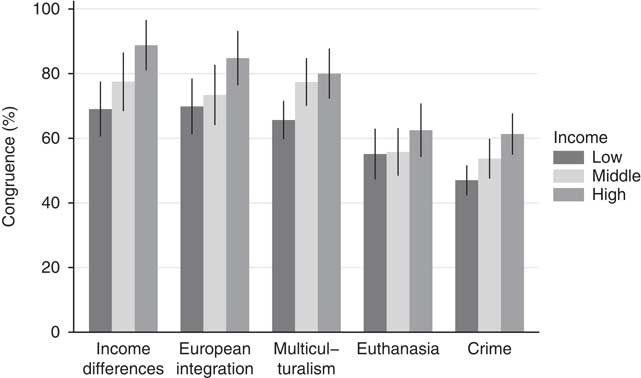
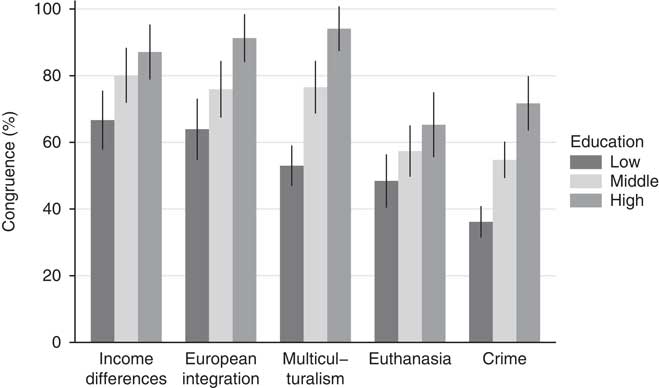
The findings so far generalize to the other issues (European integration, crime, and euthanasia). Figure 4 presents ideological congruence by income terciles for all five issues, and Figure 5 does the same for education terciles. Error bars indicate the 95% confidence interval based on bootstrapped standard errors. The striking conclusion from these figures is that the representation of lower educated citizens is significantly worse than that of higher educated citizens on every issue. The same applies to income groups, with the exception of euthanasia, where the difference between low and high income is not significant (t=1.29, P=0.197). Furthermore, scores for the middle tercile lie between the other two for all five issues. In the case of education this middle group scores significantly lower than the highest group on European integration (t=2.75, P=0.006), multiculturalism (t=3.39, P<0.001), and crime (t=3.46, P<0.001). In the case of income, the difference between middle and high incomes lies on the edge of significance for income inequality (t=1.88, P=0.060) and European integration (t=1.81, P=0.071). Given the strict nature of the significance test, it might well be the case that these values indicate real effects.Footnote 6
Ideological congruence and income.

Ideological congruence and education.

Figures 2 and 3 might suggest that these differences in congruence are mostly caused by the fact that low-educated and low-income citizens are more likely to place themselves at the extremes of the scale. If so, that could mean that, for instance, lower educated citizens and representatives do not so much differ in the direction of their views on multiculturalism but only in the intensity of those views. We can further explore this matter by reducing the original seven-point scales to three-point scales, combining the scores 1–3 and 5–7, and calculating congruence again. If we do so, we find that the gaps between education and income groups mostly remain intact (see Online Appendix D). The gaps are somewhat smaller than before, as expected, but they are still substantial (and still statistically significant). Hence, our findings are not simply due to the fact that low-educated and low-income citizens express more extreme views on at least some issues than other groups.
Party representation
Thus far we have mainly treated the entire group of representatives as a collective. However, as is the case for citizens, representatives from different parties hold diverging views, giving rise to the question whether the unequal congruence detailed above varies when we take this elite heterogeneity into account. To answer this, we compare the opinions of education groups and income groups to the opinions of representatives across the three largest parties at the time: CDA (centrist), PvdA (center-left), and VVD (center-right).Footnote 7 In doing so we still find considerable evidence of unequal representation when comparing representatives and voters per party. For example, the average congruence of CDA representatives and CDA voters on all five issues is 41.5% for low-educated CDA voters and 65.9% for high-educated CDA voters. We broadly find the same results for the PvdA and to a lesser extent for the VVD.
Furthermore, the results look very similar when comparing each party’s representatives to the entire electorate. For instance, the average congruence between CDA representatives and citizens is 40.0% for low-educated citizens and 62.2% for high-educated citizens. This also applies to the other two parties. A notable exception is the issue of income inequality, where the center-left PvdA does not represent high income and education terciles any better than the middle and bottom terciles. On the other issues, however, the PvdA shows a skew that is even slightly larger than the other two parties. Finally, the overall congruence with citizens is highest for the PvdA on income inequality and highest with the VVD on the four cultural issues. Given these parties’ positions, this suggests a dominant left-nationalist sentiment in public opinion, to which we will return below.
Issues vs. left-right
Overall then, these findings point to a clear, positive relationship between income and education on the one hand, and degrees of congruence on the other. We reach different conclusions, however, when we capture representation using left-right self-placement. Overall levels of congruence turn out to be much higher while the unequal representation of socio-economic groups is much more muted (see Online Appendix E). The latter is especially true for income, which shows no differences in levels of ideological congruence between terciles whatsoever when captured in left-right terms (comparing low and high incomes, t=0.19, P=0.848). There are differences between education groups, with congruence increasing from 78.5% for low-educated citizens to 96.0% for high-educated citizens (t=3.18, P=0.002), but the levels of inequality are much smaller compared to when we use actual policy items. Furthermore, even the preferences of less-educated citizens appear to be represented quite well in parliament if we were to confine our analyses to the left-right scale.
Since policy issues provide a less ambiguous and abstract basis for the measurement of congruence, we conclude that congruence in left-right terms leads to an overly rosy picture of the quality of political representation (Lesschaeve, Reference Lesschaeve2017). It would suggest that congruence is ‘nearly perfect’ (Andeweg, Reference Andeweg2011: 47) and ‘better than ever’ (Thomassen et al., Reference Thomassen, Van Ham and Andeweg2014: 60), and that there are only limited gaps at best between groups of citizens. However, analyses based on the underlying issues offers much less ground for optimism and reveal that left-nationalist views are somewhat underrepresented (Van der Brug and Van Spanje, Reference Van der Brug and Van Spanje2009; Thomassen, Reference Thomassen2012).
Disentangling income and education
So far, it seemed like income and education both contributed to inequalities in congruence. This is not a conclusive answer though, because income and education partially overlap and the graphs do not account for this. In the DPES, they share a rank correlation of ρ=0.26 (P<0.001) (or ρ=0.28 (P<0.001) if the original variables are used). To separate the effects of income and education, we therefore construct nine categories for every possible combination of income and education and calculate congruence for each category. Income inequality and multiculturalism are again used as examples.
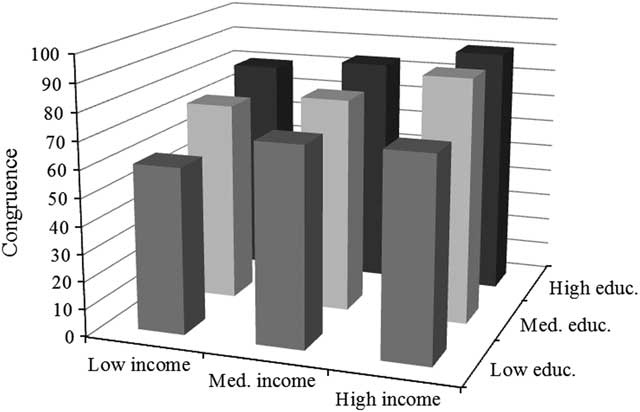
Figure 6 presents congruence scores on income inequality for all nine combinations of income and education. Congruence increases along both the income axis and the education axis, providing further support for the claim that both factors are important independent of the other. Keeping education constant, we find a difference of 16.1 percentage points in congruence between low and high incomes. If income is kept constant, the difference between low and high education is 13.0 percentage points. Income and education therefore have similar effects on the political representation of redistributive preferences. For both, the difference between lower and upper terciles remains within the range of statistical significance.
Congruence on income inequality by income and education.

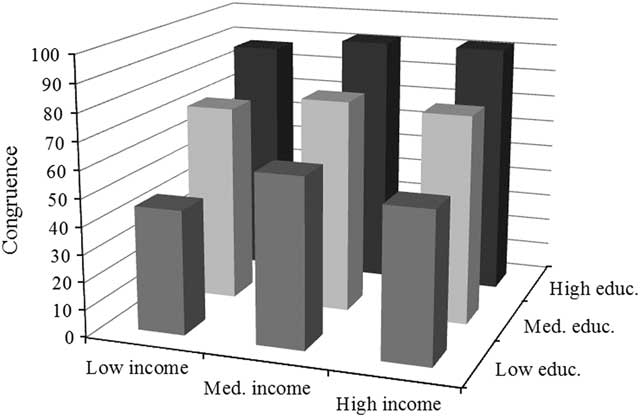
We repeat this procedure for the issue of multiculturalism (Figure 7). In contrast to the economic realm, income and education clearly do not contribute equally to differences in congruence on cultural issues. There is hardly any increase along the income axis, while the increases along the education axis are very large. Keeping education constant, there is a difference of 5.9 percentage points between low and high incomes, which is also no longer statistically significant. But if income is held constant, the difference between low and high education turns out to be 36.6 percentage points, which is still highly significant. This means that education can explain almost two-thirds of the income effect, whereas income can only explain about a tenth of the education effect. Education therefore has an extremely strong effect on congruence regarding multiculturalism, while the effect of income is negligible. Additional analyses show that this also holds for the other cultural issues.Footnote 8 The explanation for this finding was alluded to earlier: education groups differ much more in their opinions on cultural issues than do income groups (Van de Werfhorst and De Graaf, Reference Van de Werfhorst and De Graaf2004).
Congruence on multiculturalism by income and education.

The above discussion carries an important implication: the political views of the bottom two-thirds of the electorate in terms of income and education are only reflected in the views of members of parliament insofar as they overlap with the views of rich and higher educated citizens. In other words, those with low levels of income and education are not represented directly but only indirectly to the extent that they happen to agree with those above them. Therefore the more low incomes disagree with high incomes, and low-educated citizens disagree with high-educated citizens, the less their views are reflected among parliamentarians. But a sobering conclusion that arises from our analyses in Figures 6 and 7 is that for citizen orientations to be congruent with those of their elected representatives both a high income and high education are of paramount importance.
Control variables
Thus far none of the analyses have included control variables. As was described earlier, it is possible to control for political participation, knowledge, age, ethnicity, and gender by dividing all these variables into two or three categories and calculating congruence for all possible combinations of, say, participation and education. For the cultural issues we only focus on the educational effect, since the income effect lost significance when controlling for education.
Even if we assume that all the above variables are completely exogenous to income and education, which is surely an unrealistic assumption (as the theory section has reviewed), most of the effects remain significant (see Online Appendix F). At most the control variables can explain about a third to half of the effects found so far. With regard to income inequality, political knowledge and education reduce the income effect from 19.8 percentage points to 9.0 percentage points, a reduction of 54%. This gap is on the edge of statistical significance. For the same issue, the effect of education is reduced from 20.4 to 12.9 percentage points by age and income, a reduction of 37%. The educational effect on European integration is lowered by 24% by political knowledge and income. The same two variables have the biggest impact with regard to crime, where they explain 28% of the educational effect. Political participation and age reduce the effect of education by 33% for multiculturalism. Finally, ethnicity explains 47% of the educational effect for euthanasia. All other combinations of control variables have a smaller impact on the effects of income and education. The introduction of control variables does therefore not fundamentally change the main finding that there are clear gaps in ideological congruence between income and education groups. The control variables reduce the size of the effects, but even then most congruence gaps between lower and upper terciles are in double digits.
A more realistic and less stringent interpretation of these results, however, acknowledges that some of these control variables are endogenous to education and income. This is obviously not the case for age, ethnicity, and gender, but it might be true for political participation and knowledge. That is, the effects of education and income on congruence partly work through political participation and knowledge. In that case, we would conclude that 15–30% of the effects are mediated by participation and knowledge, and exogenous factors explain <20% of these effects for most issues.
Developments over time
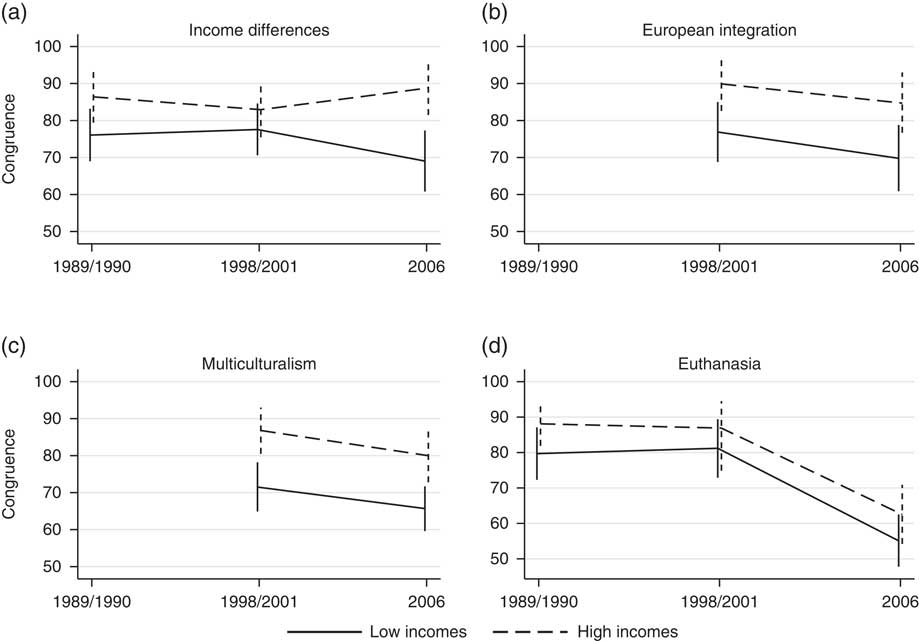
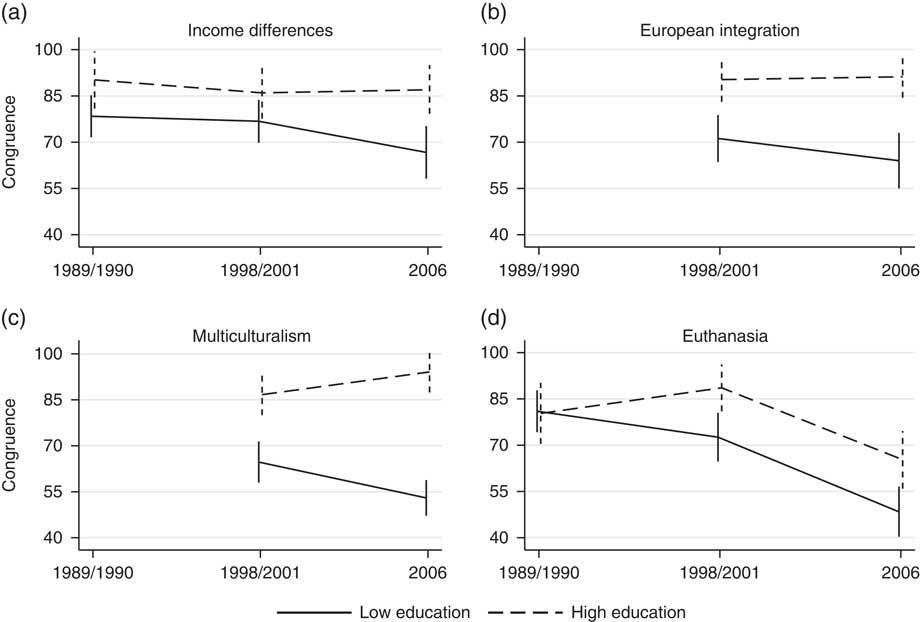
Finally, the current data enables us to sketch developments over time, albeit in a limited way. Similar high-quality surveys were administered to members of parliament in 2001 and 1990, which can be paired with data from the DPES of 1998 and 1989, respectively. Of the five issues discussed above (income equality, European unification, multiculturalism, crime, and euthanasia), crime is the only one that was not included in previous surveys. The other four will be discussed in order. Figure 8a–8d summarizes the findings by presenting congruence scores for low and high incomes on the four issues over time. Figure 9a–9d does the same for lower and higher education. Error bars again indicate the 95% confidence interval. All figures, including those for the middle groups, are provided in Online Appendix G. Online Appendix H provides the average scores for the same issues and time points.
Congruence over time by income.

Congruence over time by education.

The political representation of economic preferences did not display wide gaps between income and education groups before 2006. The explanation for this is not that low and high incomes held more similar views before 2006. The average scores show that they did not (see Online Appendix H). Instead, both parliamentarians and the public became slightly more egalitarian in their views between 1989/1990 and 1998/2001. This development continued for citizens after that but was reversed for members of parliament. This explains why representation became clearly unequal in 2006. Congruence remained high for the top terciles of income and education, while it dropped for the middle and bottom terciles.
European integration was measured at one previous point in time, in 1998/2001. In this year, congruence was less unequal than in 2006, but there were still clear gaps between income and education groups (both significant at α=0.05). The average scores show that both parliamentarians and the public became more skeptical towards European integration between 1998/2001 and 2006. The increase in unequal congruence for education groups is largely due to the fact that low- and high-educated citizens drifted further apart in their views (also see Lubbers and Jaspers, Reference Lubbers and Jaspers2011; Hakhverdian et al., Reference Hakhverdian, Van Elsas, Van der Brug and Kuhn2013). Here, too, congruence remained high for the top terciles of income and education, while it decreased for the middle and bottom terciles. On average, parliament is much more in favor of European integration than even higher educated citizens at both points in time, a result that is also borne out by the only two national referenda that the Netherlands has ever organized since the introduction of universal suffrage almost a century ago (see the Introduction section).
Turning to multiculturalism, we find that gaps between education groups in particular became bigger over time. All groups became more monocultural in their views except for parliamentarians, whose views remained unchanged. In 1998/2001, they were more monocultural than higher educated citizens. By 2006, they had become relatively more multicultural. As a result, congruence sharply dropped for lower educated citizens, while it actually increased for those with a high level of education.
Finally, the euthanasia issue is more interesting because of the development of overall levels of congruence than for the development of inequalities in congruence. First, the average citizen was always somewhat more progressive on this issue than parliament. Second, all income and education groups became more progressive from 1989 to 2006. Third, higher educated citizens used to be slightly more progressive than lower educated citizens, and high incomes used to be more progressive than low incomes, but this gap had closed by 2006. Essentially, everyone had become progressive by then. This is in line with the view that moral issues like euthanasia no longer form a line of conflict in the Dutch political landscape (Pellikaan et al., Reference Pellikaan, De Lange and Van der Meer2007). Fourth, and perhaps the most interesting finding, parliament did not become more progressive between 1989 and 2006. As a result, congruence displayed a dramatic drop between 1998/2001 (84.3%) and 2006 (57.9%). As was said earlier, citizens across the board are represented quite poorly when it comes to the issue of euthanasia.
Conclusion
This study has revealed clear and significant differences in the political representation of socio-economic groups in the Netherlands. The views of national representatives are much more in accordance with the views of higher educated, rich citizens, than with the views of their lower educated, poorer counterparts. Both income and education contribute to unequal representation overall. On economic issues, the two factors are equally important, while education trumps the effect of income on cultural issues. Finally, a discussion of developments over time shows that inequalities in congruence have grown in recent years.
These results are striking given the fact that they are based on data from 2006, that is, after the rise of Pim Fortuyn and populism in the Netherlands. A common narrative maintains that, after the established parties had ignored various and growing concerns on the cultural dimension for years, Fortuyn and others like him formed a ‘self-correction of the representative democracy’ (Thomassen et al., Reference Thomassen, Van Ham and Andeweg2014: 64). Even after this supposed correction, the views of parliamentarians mostly reflect those of high-educated citizens. In fact, this has only become more apparent over time. One could argue that 2006 is an exceptional year, because it falls between Fortuyn and Wilders, the new figurehead of right-wing populism in the Netherlands. However, the rise of populist parties forced established parties to move closer to their positions on issues like multiculturalism, an effect that should already have taken hold by 2006 (Van Spanje, Reference Van Spanje2010). Still, it certainly seems plausible that Dutch parliament today, with Wilders’ party among its ranks, would perform better on most of our cultural measures.
As for the economic dimension, Bovens and Wille (Reference Bovens and Wille2011: 99–101) suggest that congruence is high and more equal here, because it concerns ‘easy issues’ (see also Thomassen et al., Reference Thomassen, Van Ham and Andeweg2014). This is not supported by our analysis. Economic issues and their societal anchors are still relevant. This holds even more true when we consider the situation after 2006. While we suspect that congruence has become somewhat less unequal on the cultural dimension since then, due to the continued drift of most parties toward monocultural positions, we expect congruence to have become more unequal on the economic dimension, as most parties have shifted to the right in the past decade (Van Spanje, Reference Van Spanje2010).
Our study is not without limitations. The most important caveat concerns the link from elite opinion to actual policy outcomes. We have focused on the views of national elected representatives, but an obvious and crucial question remains: if socio-economic inequality affects descriptive representation, does it also influence substantive representation (Pontusson, Reference Pontusson2015)? If the views of representatives do not decisively affect their actions or the actions of the government, unequal congruence between income and education groups ought not to be a cause for concern.
Past research has identified that representatives’ preferences as expressed in surveys have a direct although by no means overwhelming bearing on their legislative behavior (Kam, Reference Kam2001; Willumsen and Öhlberg, Reference Willumsen and Öhlberg2017), but to the best of our knowledge scholars have not yet linked legislator preferences to legislative behavior in the Netherlands. In fact, strict party discipline in the Dutch parliament leaves little if any room to use formal legislative behavior as a dependent variable in statistical models (Andeweg and Thomassen, Reference Andeweg and Thomassen2011). From a practical point of view, combining roll-call analyses with survey evidence might prove impossible because roll calls are increasingly and exceedingly rare (Louwerse et al., Reference Louwerse, Otjes and Van Vonno2018) – most legislative voting is conducted by a show of hands and only party-level results are recorded in the minutes – and elite surveys are conducted under anonymity which further impedes linking preferences and formal behavior for individual MPs.
And yet there are good reasons to believe that inequalities are in fact magnified and not remedied further downstream in the policy-making process. Recent scholarship on unequal representation in the Netherlands has found similar patterns to the ones highlighted in our study when comparing the political orientations of education groups to policy positions espoused by the government (Aaldering, Reference Aaldering2017). In response to her earlier seminal work on the descriptive representation of women and blacks, Mansbridge (Reference Mansbridge2015) has recently called attention to descriptive representation based on socio-economic variables. While she contends that overall the case to be made for descriptive representation based on gender and ethnicity is more compelling, she nonetheless points out that the direct presence of the working class in parliament might be important given their subsequent paucity in the policy-making realm. Many of the other venues in the political system are dominated by richer, higher educated individuals who once again differ in their political interests and preferences than others (Bovens and Wille, Reference Bovens and Wille2017). Interest group activity, for example, is biased in favor of the wealthy and higher educated (Schlozman et al., Reference Schlozman, Verba and Brady2012; Boräng and Naurin, Reference Boräng and Naurin2016). Furthermore, the benefits that come with large financial resources means that interest groups representing moneyed interests have an important advantage over others (Van Waarden, Reference Van Waarden1992).
The so-called revolving door between business and government adds further cause for concern (Domhoff, Reference Domhoff2005 [1967]). Even if representatives do not directly reciprocate any past or future employment in the business world, this employment might make it likelier that they will share the mindset of their employer (Buiter, Reference Buiter2008). Since the mid-1990s, at least half of all Dutch ministers have worked in the private sector after their time in government, showing that the revolving door is a real phenomenon in the Netherlands (Hollanders, Reference Hollanders2015). Furthermore, members of parliament now move on to other positions much more quickly than they did before the 1990s (Thomassen et al., Reference Thomassen, Van Ham and Andeweg2014), which could well increase their dependence on potential future employers. All in all, the gaps in political representation that we have outlined are unlikely to be filled down the road by other influential political actors on behalf of the underrepresented.
An obvious solution to the current underrepresentation of the political preferences of citizens from lower income and education groups, is to call on parties for a more active recruitment of parliamentarians from their ranks. The former President of the Dutch lower house of parliament, Gerdi Verbeet, has argued for the presence of more lower and middle educated politicians in parliament. Most people would object to her suggestion, as the view that an academic degree is an inherently desirable trait for political leaders is widespread. However, whether or not lower educated representatives actually function worse than their higher educated counterparts remains to be seen. Carnes and Lupu (Reference Carnes and Lupu2016) fail to find any evidence to suggest that the level of education of political leaders and their performance in office are actually linked. The call for a composition of legislative bodies that is more representative of the population at large therefore does not necessarily compromise its quality. But even if formal schooling were to produce better leaders, a human capital approach to education that focuses on skill acquisition alone would still miss part of the story. Education leaves a mark on people’s broad normative proclivities, both as a result of the curriculum to which one is exposed as well as through social interactions with peers (Hakhverdian and Mayne, Reference Hakhverdian and Mayne2012). We should therefore treat education as more than a mere proxy for someone’s skills and cognitive functions. Education anchors political beliefs among citizens as well as representatives and this carries important implications for our understanding of the functioning of representative democracy.
Acknowledgments
A previous version of this paper was presented at the Comparative Politics PhD Club at the University of Amsterdam. The authors are grateful to the participants of that workshop for their feedback. The authors also wish to thank the reviewers and editors of EPSR for their comments and Rudy Andeweg for granting us access to the DPS. This research was partly funded by the Netherlands Organisation for Scientific Research (grant numbers 451-13-013 and 406-15-089).
Supplementary material
To view supplementary material for this article, please visit https://doi.org/10.1017/S1755773918000036